Introduction
The large band gap inherent to GaN devices facilitates their application to high voltage/high power applications, without succumbing to the problem of avalanche breakdown typical of other technologies (e.g. GaAs) when subject to high electric field intensities across the gate-drain region [Reference Dunleavy, Baylis, Curtice and Connick1]. When this feature is combined with the dense electron concentration in the channel due to spontaneous and piezoelectric polarization effects, in addition to benefits of the high-electron mobility transistor (HEMT) structure, it leads to one of the most promising semiconductor technologies for the stringent high-frequency and high-power demands of 5G applications [Reference Eastman and Mishra2–Reference Shen, Heikman, Moran, Coffie, Zhang, Buttari, Smorchkova, Keller, DenBaars and Mishra5].
In the past decades, the requirement to improve the efficiency of radio frequency (RF) amplifiers has led to the development of new, high-efficiency power amplifier (PA) modes, such as class-F and class-J PAs, among others [Reference Cripps6]. The design of these modes of PA demands a model that can not only accurately predict the behavior of the transistor at the fundamental frequency but also at related harmonic frequencies.
Many different modeling approaches have been pursued over the years; from behavioral-based methods to physics-based/semi-empirical models [Reference Root, Verspecht, Horn and Marcu7–Reference Raffo, Bosi and Vadala16]. Physics-based models of RF components have been employed extensively in the RF world e.g. the exponential pn-junction equation and the Ebers-Moll bipolar junction transistor (BJT) models, however, their continued development for application to more exotic transistor technologies is difficult and slow [Reference Crupi, Schreurs and Caddemi17].
As an alternative approach, behavioral models dispense with specific physical knowledge, are typically very accurate within their validity domain, and allow fast, automated, extraction from measured data. The reduced need for specific physical insight into their device operation means vastly reduced development time. Accurate behavioral predictions from models based on conventional approximations, such as polynomials [Reference Root, Verspecht, Horn and Marcu7–Reference Verspecht, Root, Wood and Cognata12] or rational functions [Reference Cai, King, Merrick and Brazil13] are reported. However, those traditional approximation methods are not ideal due to poor extrapolation ability and numerical issues inherent with both extraction and extrapolation of higher degree polynomial functions.
Artificial neural network (ANN) techniques [Reference Ko, Roblin, Landa, Reynose-Hernandez, Nobbe, Olson and Martinez18–Reference Huang, Zhong, Wu and Guo22] provide another choice for large-signal modeling. The disadvantage of ANNs lies in the difficulty in determining the optimal model configuration for a given desired model accuracy, particularly when distinct ANNs are required for separate parts of the model [Reference Angiulli, Cacciola and Versaci23, Reference Cai, Yu, Sun, Chen and King24].
The field of machine learning (ML), traditionally associated with artificial intelligence [Reference Bishop25], has recently demonstrated some useful applications to RF circuit design [Reference Chen, Merrick and Brazil26]. In [Reference Cai, King, Yu, Liu and Sun27], a model based on support vector regression (SVR) using a kernel implemented with radial basis functions (RBF), is applied to a 10 W GaN transistor. The results show excellent agreement when modeled and measured outputs are compared. However, the model presented in [Reference Cai, King, Yu, Liu and Sun27] can only predict the behavior of the device under a fixed operating frequency; it cannot be used to predict the behavior across a broad frequency band.
The work in this paper extends the model introduced in [Reference Cai, King, Yu, Liu and Sun27] by enabling broadband behavioral prediction, which is then validated through load-pull and multi-harmonic scattered-wave measurements across a broad frequency range. As a demonstrative example, the proposed model is applied to a class-J PA design with measured and modelled results compared for model validation purposes.
The paper is organized as follows. The basic theory of the SVR modeling technique, the application of the SVR-based method to RF transistor modeling, along with the model extraction, are presented in the section “Basic theory of the new model”. Model validation results, from simulations and experimental measurements are provided in the section “Model validation”. The basic class-J PA theory is given in the section “Class J PA theory”. In the section “Practical class J PA design”, the proposed model is applied to practical broadband class-J PA design. Finally, conclusions are provided in the section “Conclusion”.
Basic theory of the new model
Support vector regression
SVR is a regression technique based on the popular support vector machine (SVM) machine learning classification technique, developed by Vapnik et al. in 1996 [Reference Drucker, Burges, Kaufman, Smola, Vapnik, Mozer, Jordan and Petsche28]. It is a nonparametric technique (i.e. it makes very few assumptions about the form of the modeling functions used) based on supervised learning (i.e. training data are required to determine the model parameters).
Suppose that n sets of multi-input single-output training data are given as $\{ {{\bf x}_i, \;{\rm \;}y_i} \} _{i = 1}^n$ , where ${\bf x}_i\in {\bf R}^d$
 denotes the d-dimensional input variables, with $y_i\;\;{\bf R}$
 denoting the scalar output value. The unknown function relating inputs and output can be expressed as

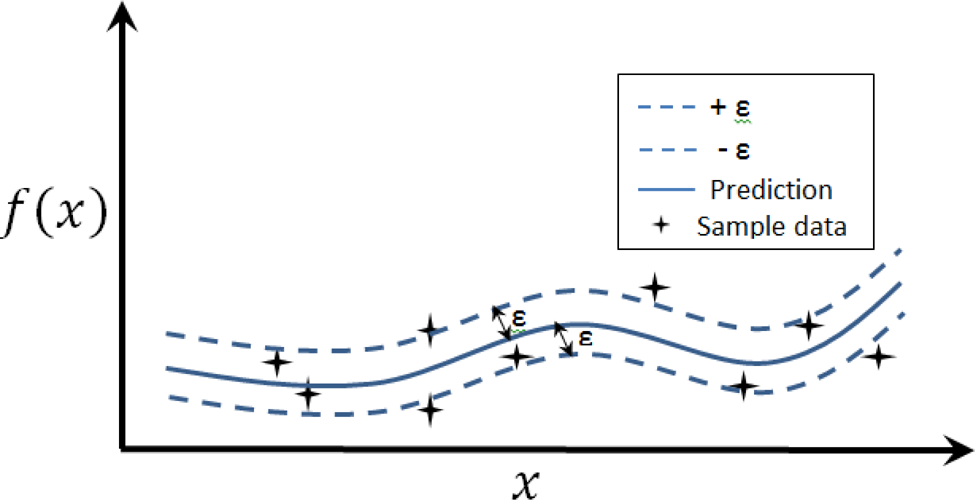
where ${\bf w}$ is a weighting vector and b is a scalar bias term. The SVR technique leads to a convex optimization problem that attempts to find the simplest model for the observed data while permitting an acceptable error (± ɛ), when constructing the model $f( {\bf x} )$
 , as seen in Fig. 1. This is known as an ɛ-insensitive error function and is introduced to improve the sparsity of the solution.
Support vector regression.

The error function for SVR is expressed as

where C is the control for the model complexity. Slack variables, ${\rm \xi }_i^ \pm$ , are introduced to penalize points that lie outside the ɛ-insensitive region (usually in a linear fashion, as here) and to ensure the optimization problem is feasible (this is similar to the soft margin approach in the standard SVM technique for classification). This constrained optimization problem can be solved using the method of Lagrange multipliers [Reference Shen, Heikman, Moran, Coffie, Zhang, Buttari, Smorchkova, Keller, DenBaars and Mishra5].
For applications to nonlinear transistor modeling, where typically complex relations exist between input and output harmonic components, the linear model in (1) should be replaced by the nonlinear model $\mathop \sum \limits_{i = 1}^n \beta _iK( {{\bf x}_i, \;{\bf x}} ) + b, \;$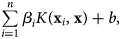 where the β i are model coefficients and K is the kernel function.
Proposed modeling method
As described in previous work [Reference Cai, King, Yu, Liu and Sun27], under certain conditions, the relationship between the incident and scattered waves at all ports and harmonics can be represented by

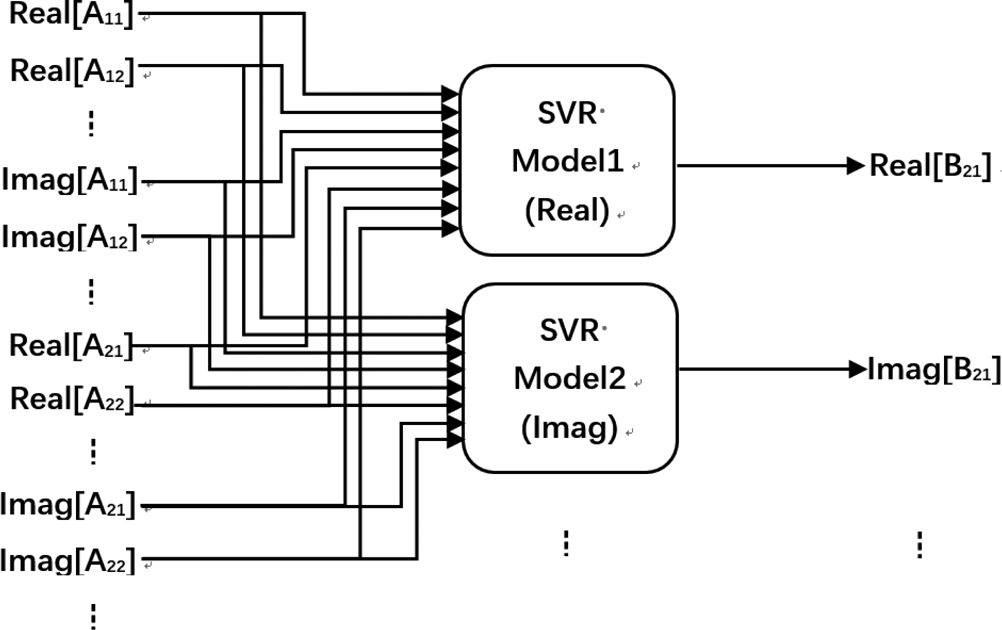
where $\overbrace{{A_{qn}}}^{{}}$ are the incident waves, A 11, A 12, …A 21, A 22, …. The describing function f pm captures how the complex amplitude of the scattered waves, B pm, depends on the complex amplitude of (potentially all) the A qn, where p and q are in the output and input port indices, respectively, and m and n are the output and input harmonic indices, respectively. The quantities β pm,i and b pm, are the respective model coefficients and bias terms. The topology of the model is described in Fig. 2.
Block diagram of existing SVR based behavioral model (RF).

From the figure, it can be seen that the model presented in [Reference Cai, King, Yu, Liu and Sun27] employs two SVR machines, one each to represent the real and imaginary parts of the output scattered wave. The real and the imaginary parts of the incident waves, A qn, are fed as separate inputs to both machines.
This existing model, however, only can be used to predict the behavior at a fixed frequency; it cannot accurately predict across a frequency band, as the model allows for no input frequency terms.
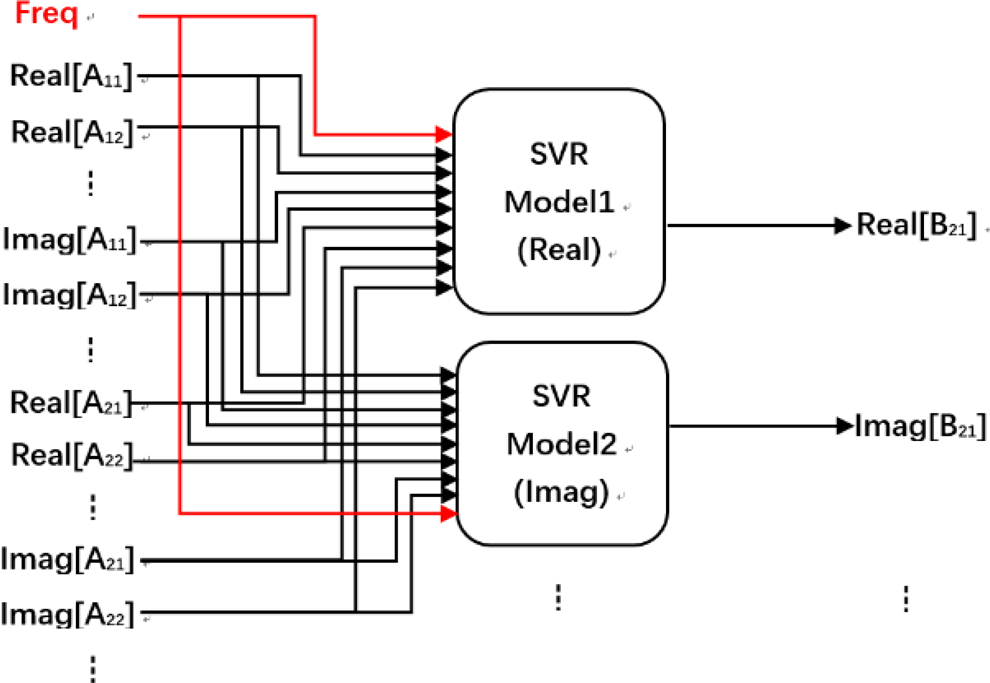
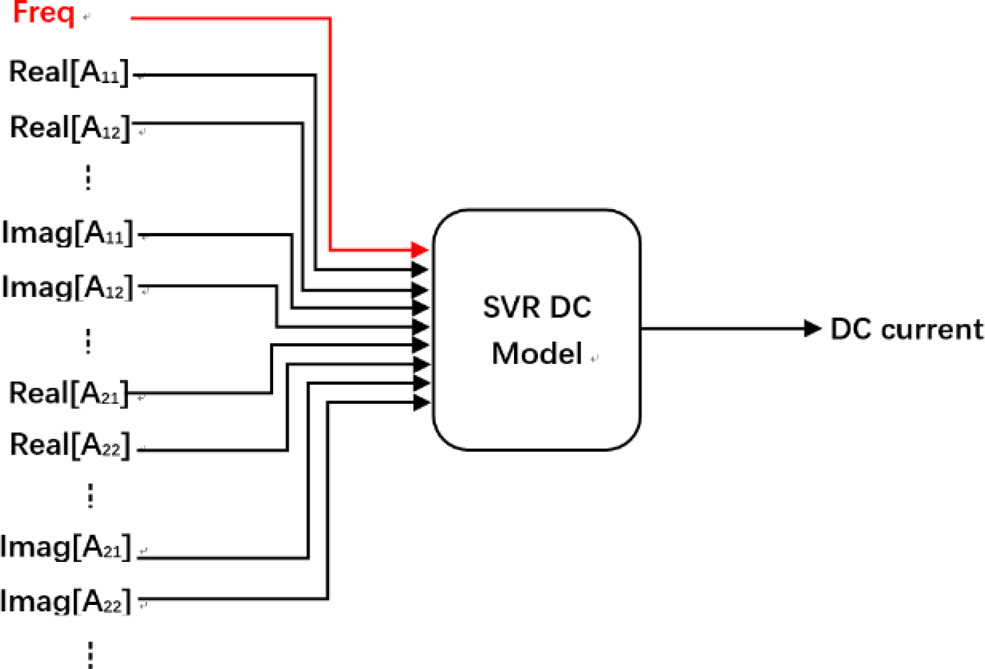
In this work, we extend the model (3) to include, explicitly, the frequency of operation. The model topology, now including this frequency input parameter, is shown in Fig. 3. The topology of the broadband SVR model for dc is given in Fig. 4. Similar to the RF topology, the frequency information is provided to the model as an input.
Block diagram of the broadband SVR based behavioral model (RF).

Block diagram of the broadband SVR based behavioral model (DC).

The model topology in Fig. 3 implies that the following adjustment must be made to (3), giving

where it can be seen that frequency f is now included implicitly as a parameter. The proposed broadband SVR model is obtained after it has been trained on a set of training data $\left\{ {{f_t},\overbrace {{A_{q{n_t}}}}^{},{\rm{}}{B_{pm}}_t} \right\}$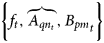 . After that, the model can be used for behavioral prediction.
Model extraction
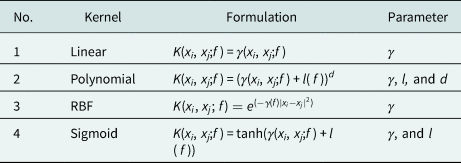
The four different kernel functions considered for the SVR algorithm are a linear function, a RBF, a sigmoidal function, and a polynomial function.
The details of the nature and implementation of these kernel functions are given in Table 1. As can be seen from the table, the kernel functions contain hyperparameters that must be optimized to obtain the optimal model. More information on this procedure is found in [Reference Cai, Yu, Sun, Chen and King24].
Four different kernels.

Explanation, γ: gamma; l: bias coefficient; d: degree.
Model validation
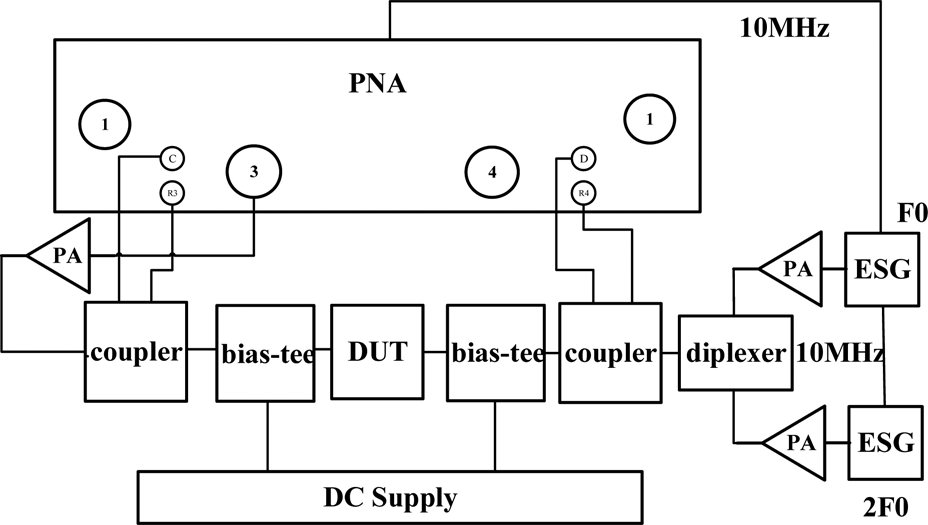
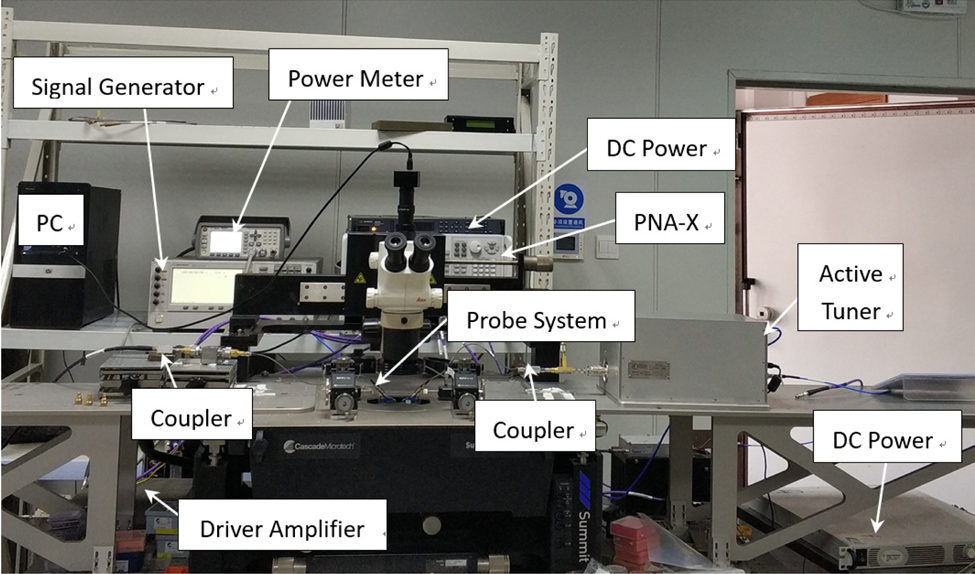
In this section, the proposed model is verified against experimental data to demonstrate the model ability to predict, accurately, the response across a range of frequencies and input power levels. The test bench consists of a Keysight PNA-X combined with a Focus Microwaves active load-pull system. A block diagram of the test bench is shown in Fig. 5 with the corresponding setup picture shown in Fig. 6.
Block diagram of test bench.

Experimental test bench setup.

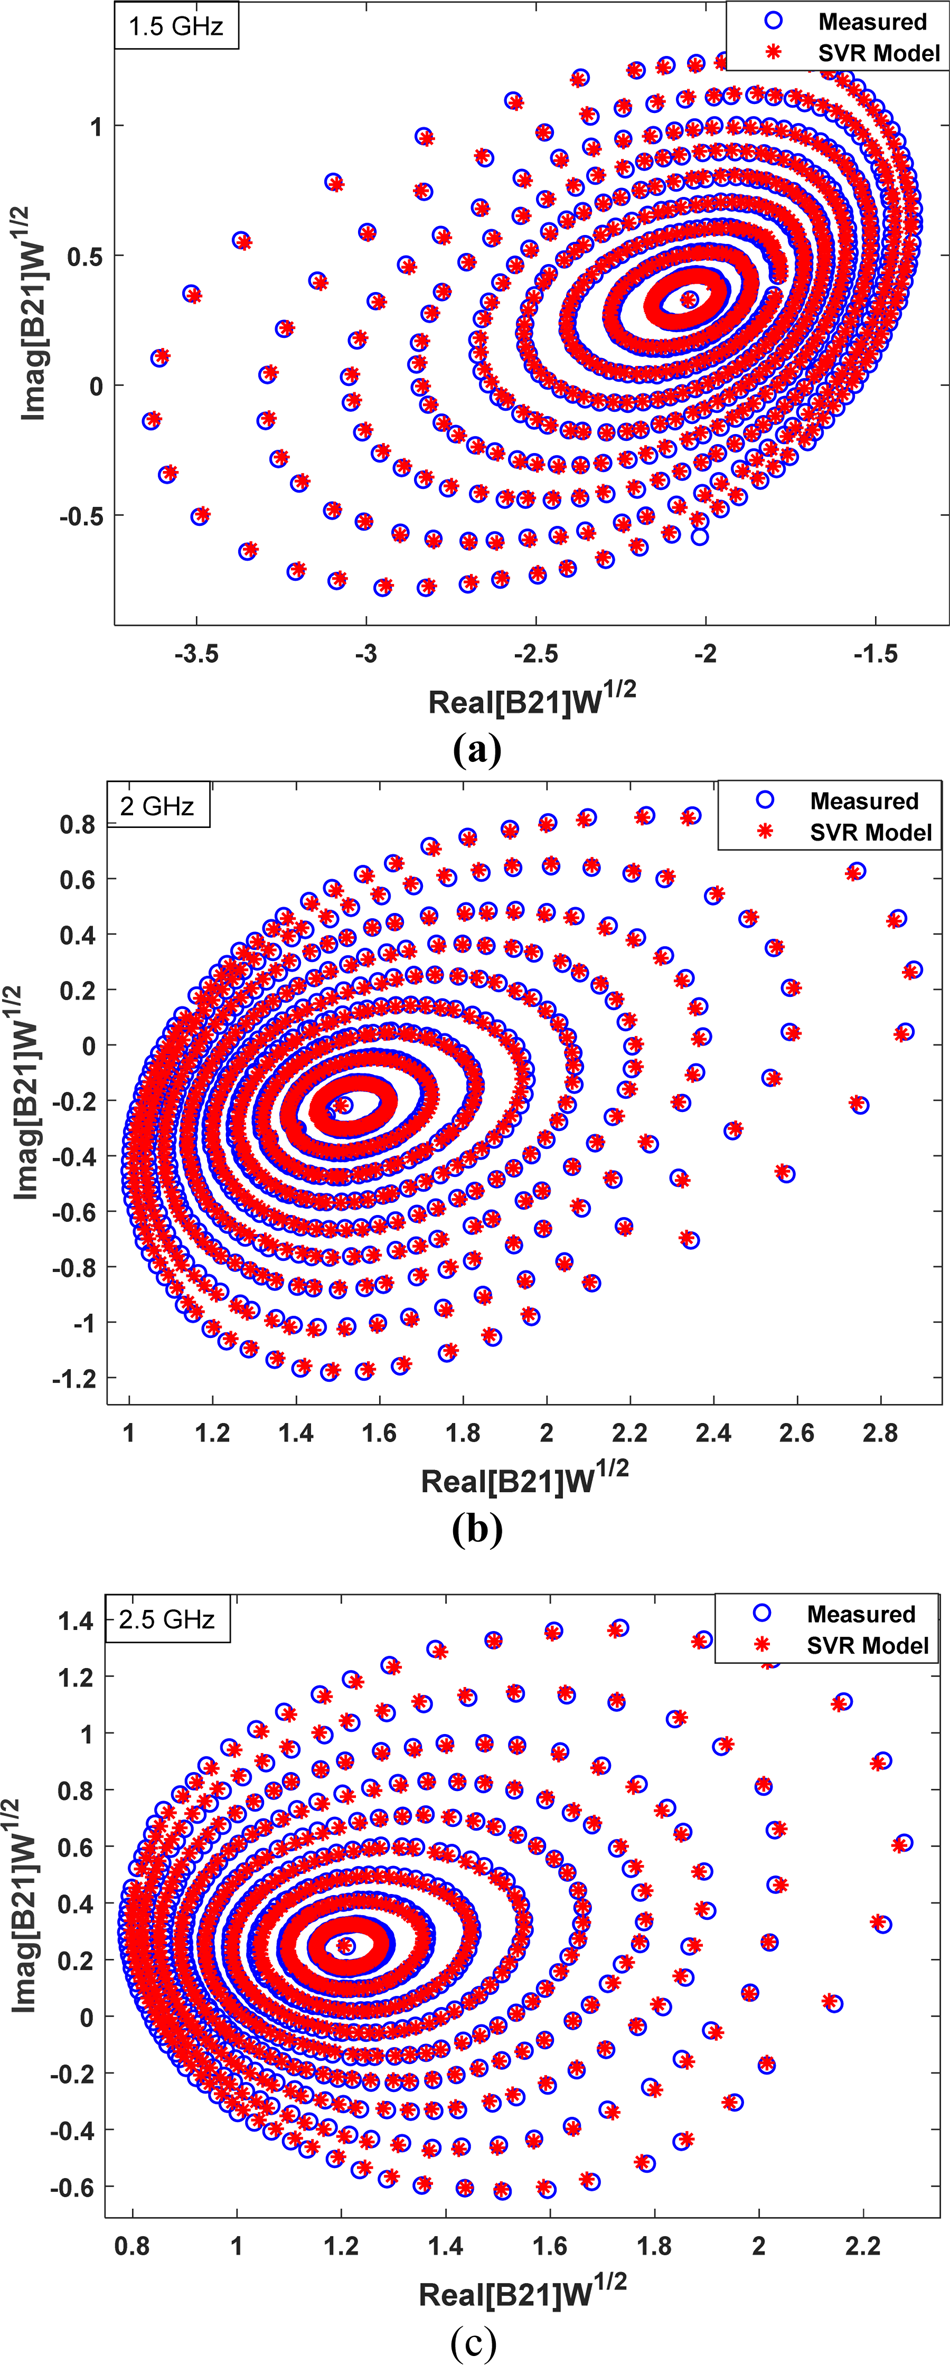
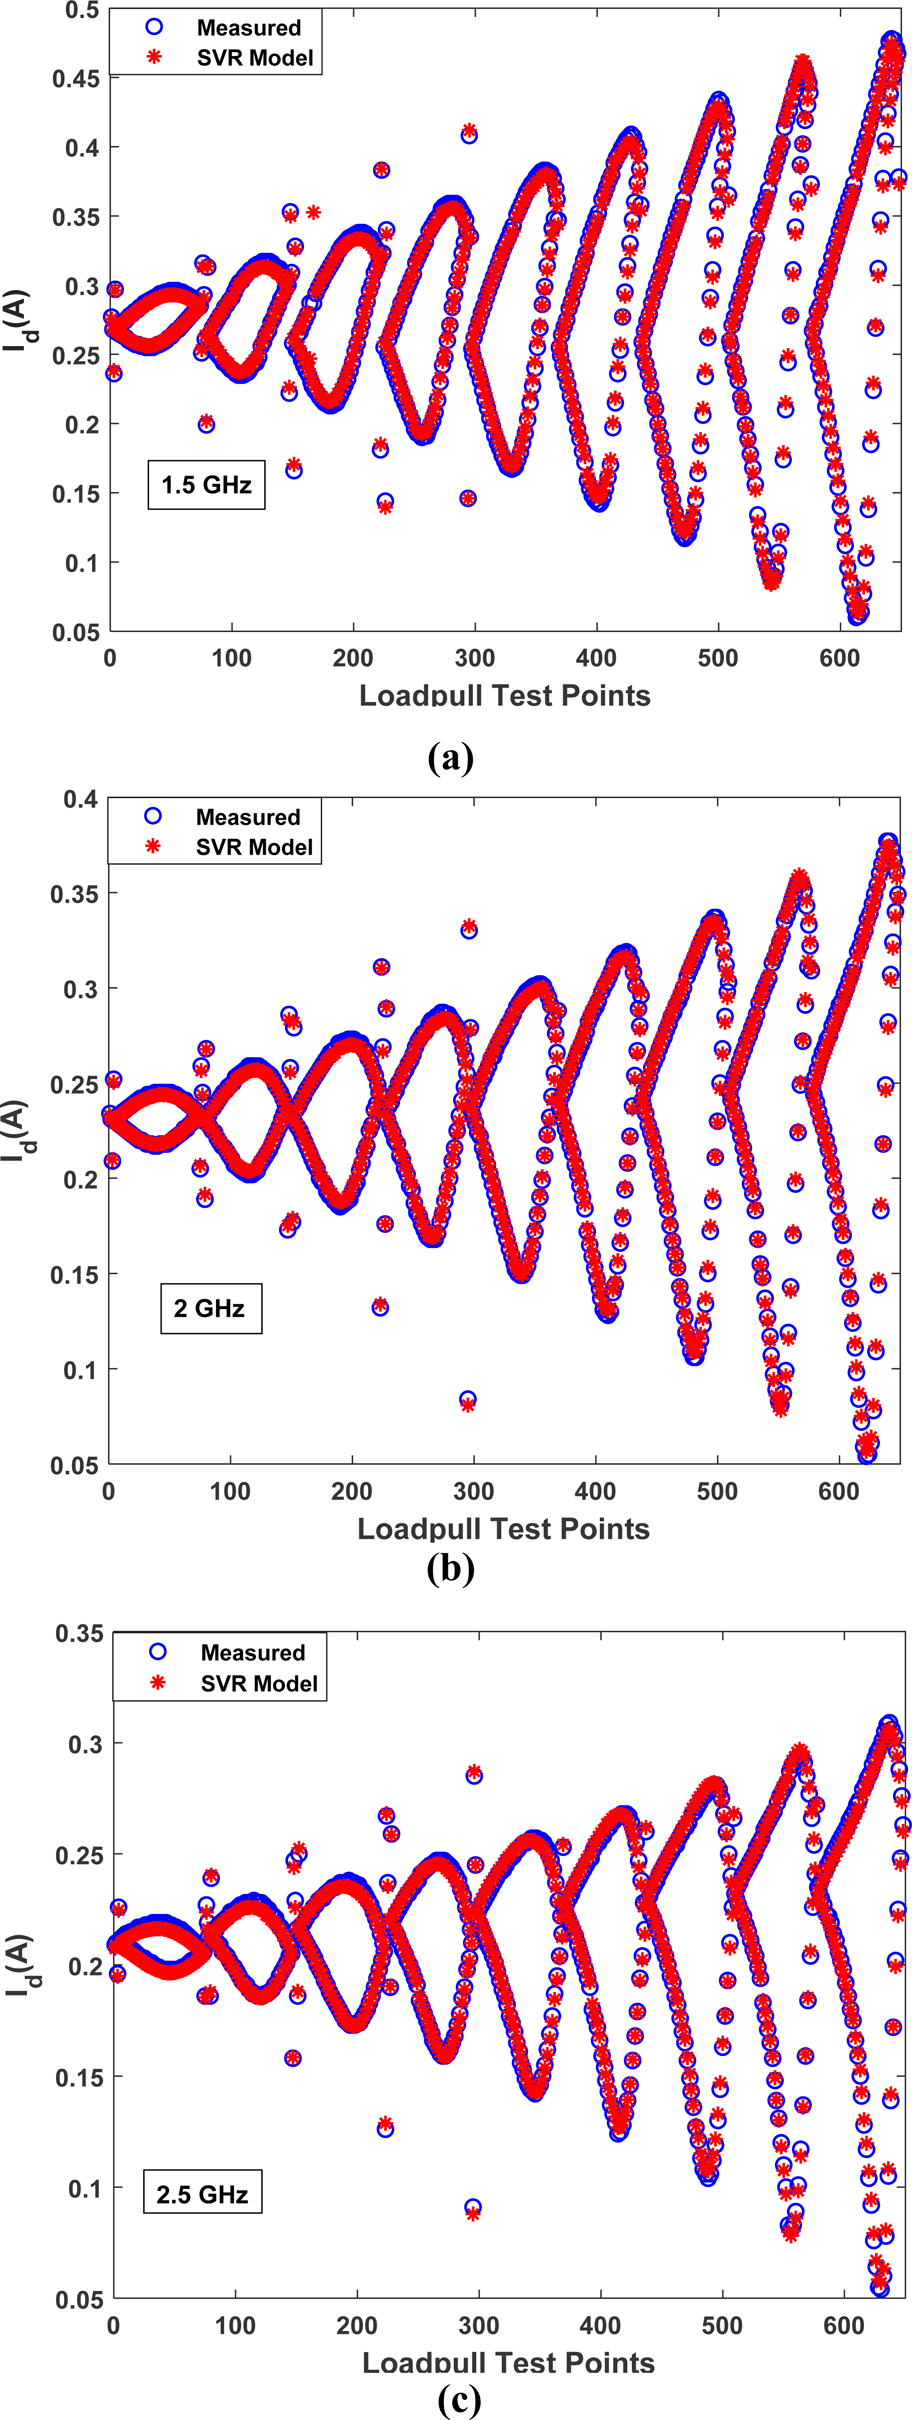
In the first experimental validation, the model ability to predict the response across a range of frequencies is demonstrated. The Wolfspeed CGH40010 device is used in the validation. The device is biased at −3 and 28 V, at gate and drain, respectively. The fundamental scattered wave at port-2, B 21, is taken as the comparison quantity, and 300 load points are used for training, with higher-order impedances set to the matched condition. The input power fixed at +20 dBm. The broadband SVR model is extracted for fundamental frequencies at 1.5, 2, and 2.5 GHz. The prediction performance can be seen from Fig. 7. The model can provide accurate prediction across all three frequencies, with +20 dBm input power. In addition, the corresponding dc behavioral prediction is also examined. The performance is given in Fig. 8. Similar to the RF results, the proposed model provides excellent performance.
Measured and modelled results for (a) 1.5 GHz, (b) 2.0 GHz, and (c) 2.5 GHz cases with +20 dBm input power.

Measured and modelled corresponding IDS results, (a) 1.5 GHz, (b) 2.0 GHz, and (c) 2.5 GHz cases with +20 dBm input power.

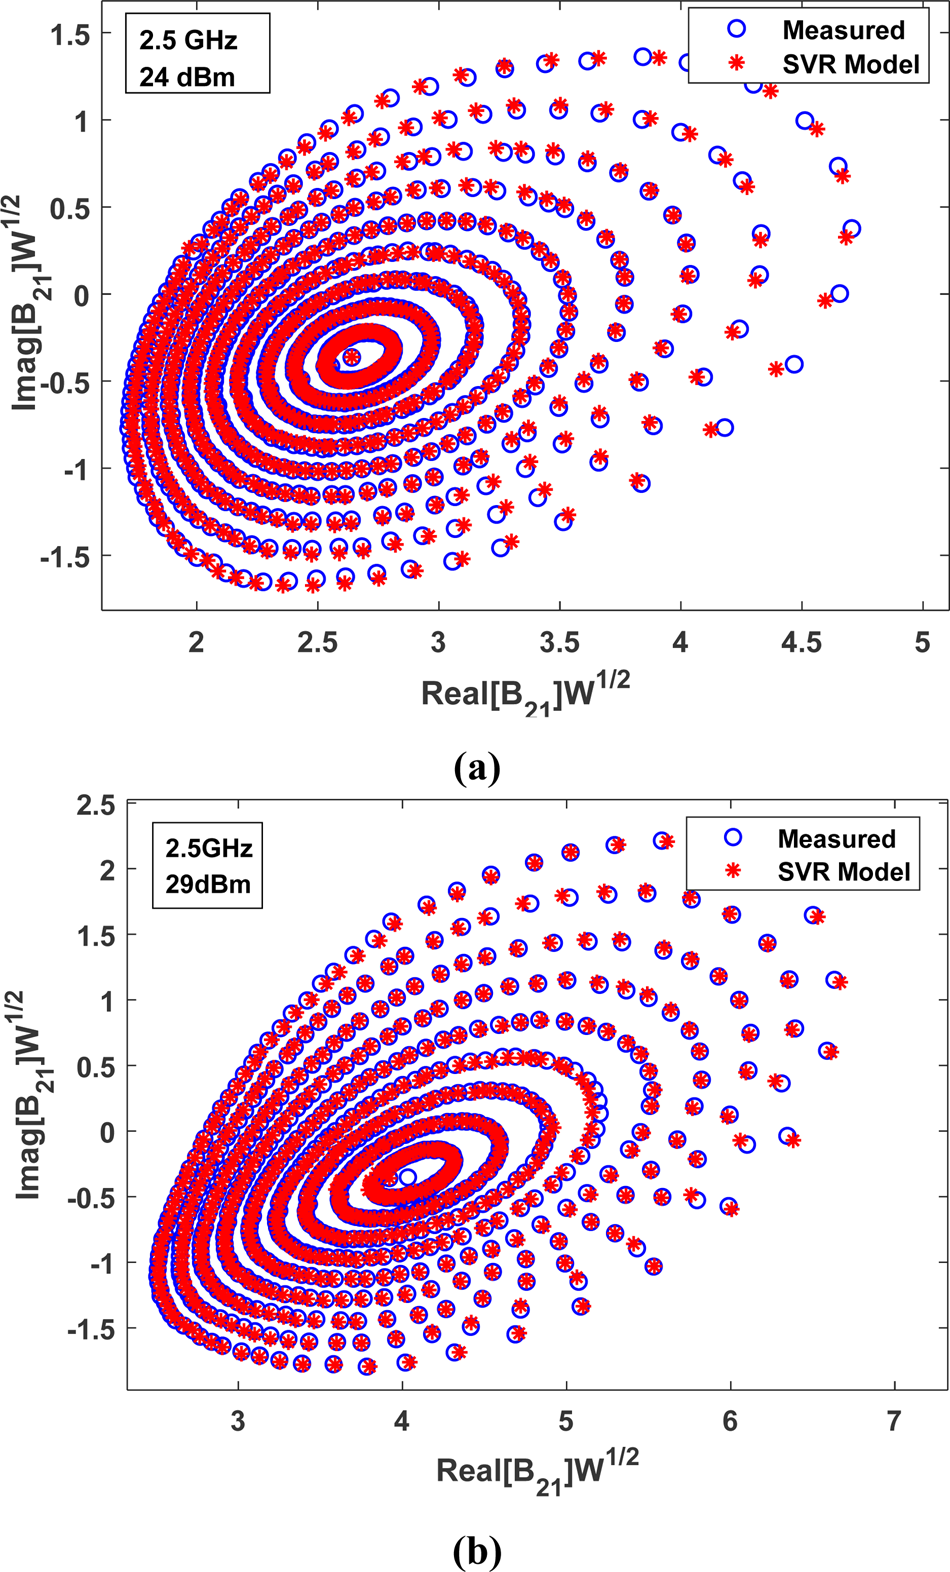
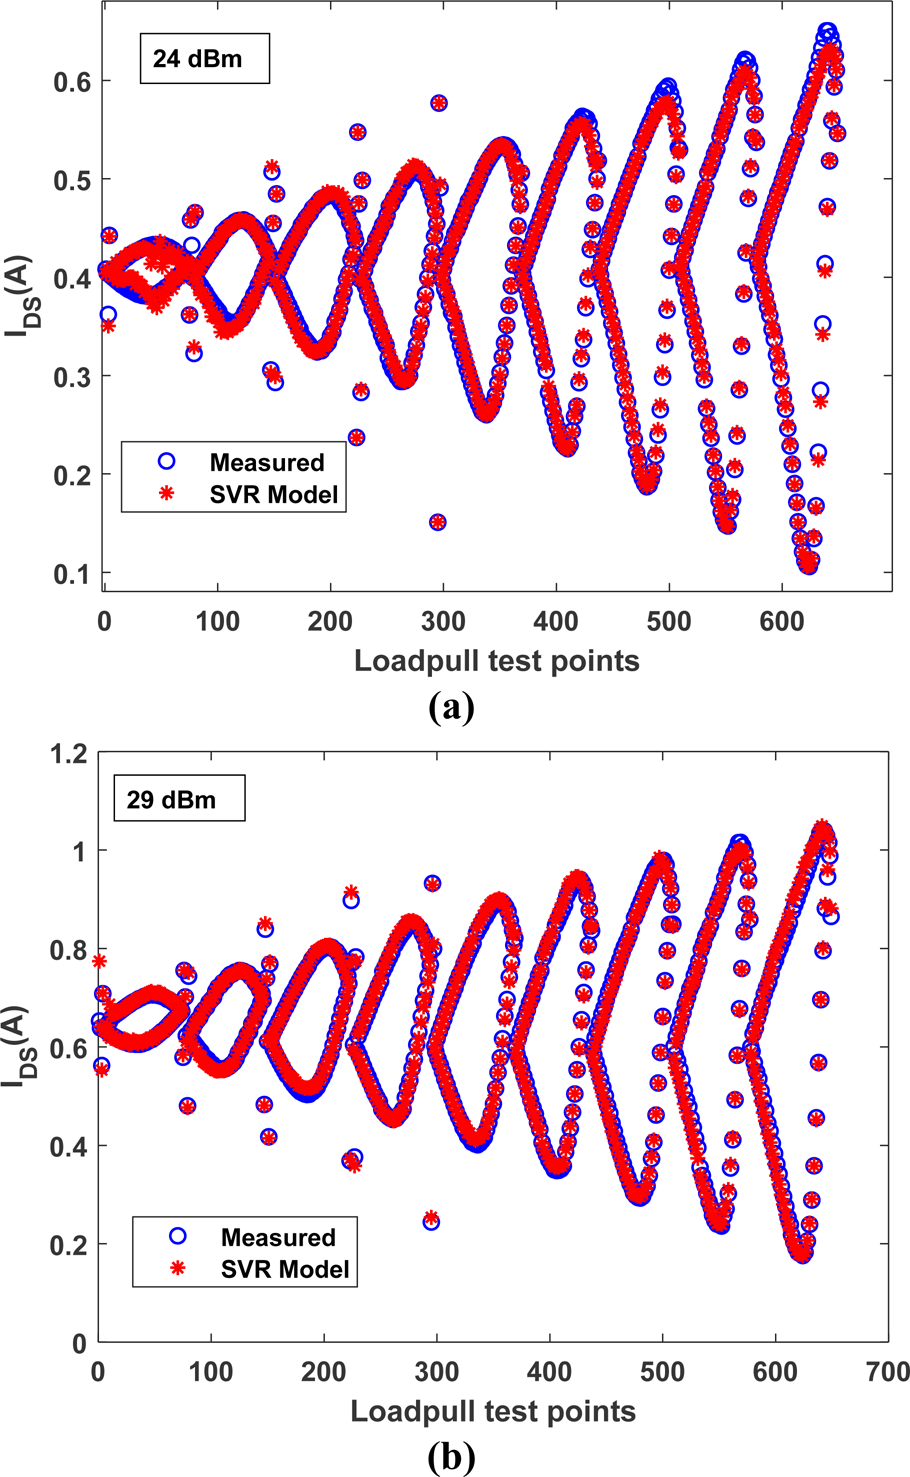
Figures 9 and 10 show measured and modelled versions of both the fundamental scattered wave, B 21, and the drain dc current, Ids, as the load impedance varies, for excitations of +24 and +29 dBm at 2.5 GHz. It is seen that the measured data are in strong agreement with the model.
Measured and modelled results for Pin,av of (a) +24 dBm, and (b) +29 dBm, with a 2.5 GHz input signal.

Measured and modelled corresponding IDS results, for Pin,av of (a) +24 dBm, and (b) +29 dBm, with a 2.5 GHz input signal.

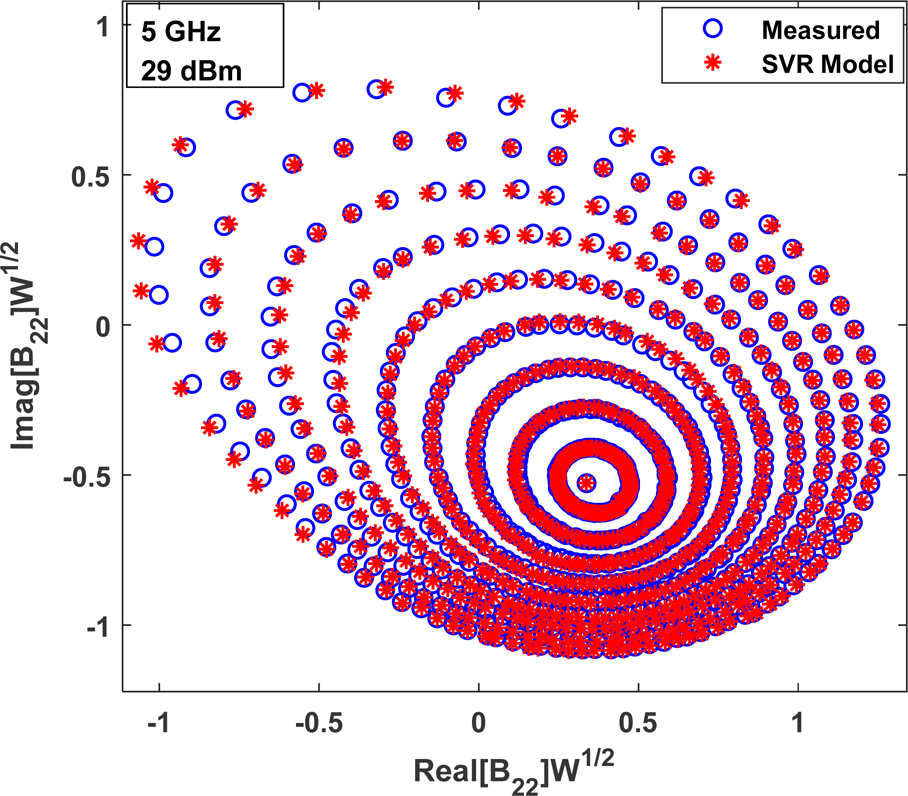
The measured and modelled second harmonic scattered wave, B 22, for excitation of +29 dBm at 2.5 GHz is also provided in Fig. 11. As can be seen from the results, the proposed model shows high harmonic fidelity, a key requirement for modern waveform-based PA design.
Measured and modelled second harmonic scattered wave, B 22, results for Pin,av = +29 dBm, with a 2.5 GHz input signal.

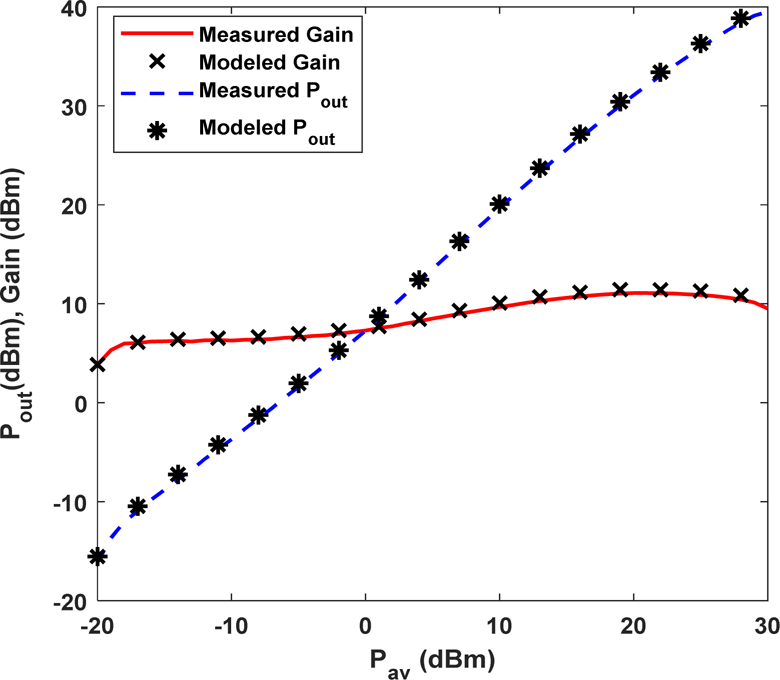
Finally, a one-tone power sweep of the DUT is also shown in Fig. 12. In this test, the specific power levels used for model extraction/training, are: −20, −15, 0, +8, +15, +22, +25, and +28 dBm. Once the model is obtained, it is used to predict the behavioral of the DUT with the input power varying from −20 to +30 dBm. Shown are the gain and the output power measurements and corresponding modelled results across an input available power sweep ranging from −20 to +30 dBm at 2 GHz. The proposed model can accurately predict the behavior of the DUT across different input power levels.
One-tone power sweeps on an unmatched 10-W device placed in a test fixture. Shown are transducer gain, and output power measurements and model results over a sweep ranging from −20 dBm to +30 dBm, with 2 GHz.

Class J PA theory
This section applies the proposed model to a practical engineering design problem. Using the method described in this paper, a model is extracted from a 10 W GaN device, and used for the design of a modern harmonically-tuned class-J PA. In the remainder of this section, we provide a brief overview of the theory of this mode of PA operation.
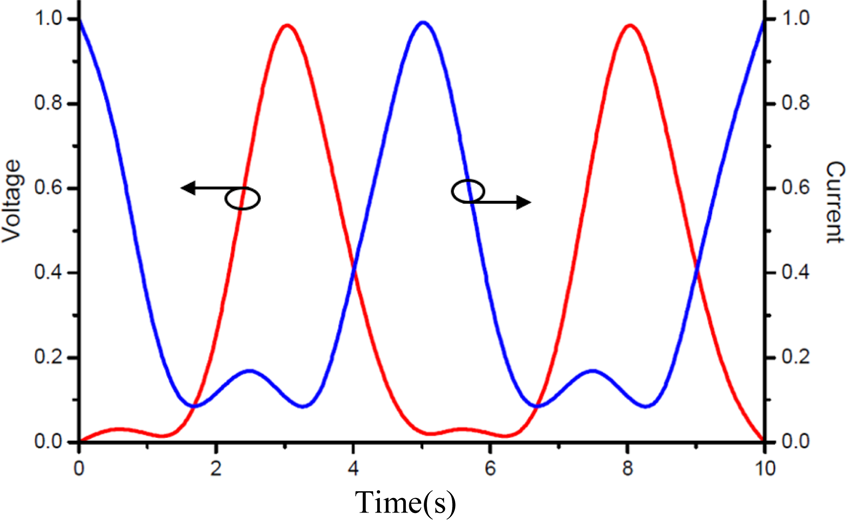
The class-J mode of PA, as introduced in [Reference Cripps6], relies on a drain voltage waveform that is “engineered” through appropriate load terminations. The bias point of the class-J mode is set according to class-B or “deep” class-AB modes. The ideal voltage and current waveforms of the transistor can be seen from Fig. 13 [Reference Cripps6].
Ideal class-J normalized voltage and current waveforms.

As described in Table 2 [Reference Wright, Lees, Benedikt, Tasker and Cripps29], the ideal normalized output fundamental and second harmonic components are given, along with the corresponding fundamental and second-harmonic impedances in (5) and (6), where R L is the load impedance. The third-harmonic component is assumed short in ideal class-J theory.
Ideal normalized half-wave voltage component

In order to ensure broadband operation at high efficiency with sufficient output power, compromises are required for setting the design values for the load resistance [Reference Roff, Benedikt, Tasker, Wallis, Hilton, Maclean, Hayes, Uren and Martin30]. Using the proposed broadband SVR model, a matching network is synthesized across the full fundamental and harmonic bands.


Practical class J PA design
A class-J PA circuit was designed and fabricated in this section to validate the proposed model under real-world conditions. To begin the design stage, the proposed model is firstly extracted using load-pull-based data. The same 10 W GaN packaged transistor from the previous section is used, with load-pull data measured at several frequencies between 2.5 and 3.5 GHz, with an input available power of +29 dBm.
The general design procedure for the PA is given in previous work [Reference Wright, Lees, Benedikt, Tasker and Cripps29]. Through analysis of the device IV-characteristics (with due regard to the knee region), the optimum fundamental impedance can be fixed. After tuning the harmonic impedance, a class-J mode PA design can be obtained. For practical implementation of the output matching/waveform engineering network, the simplified real frequency technique is employed to synthesize the broadband design [Reference Yarman31].
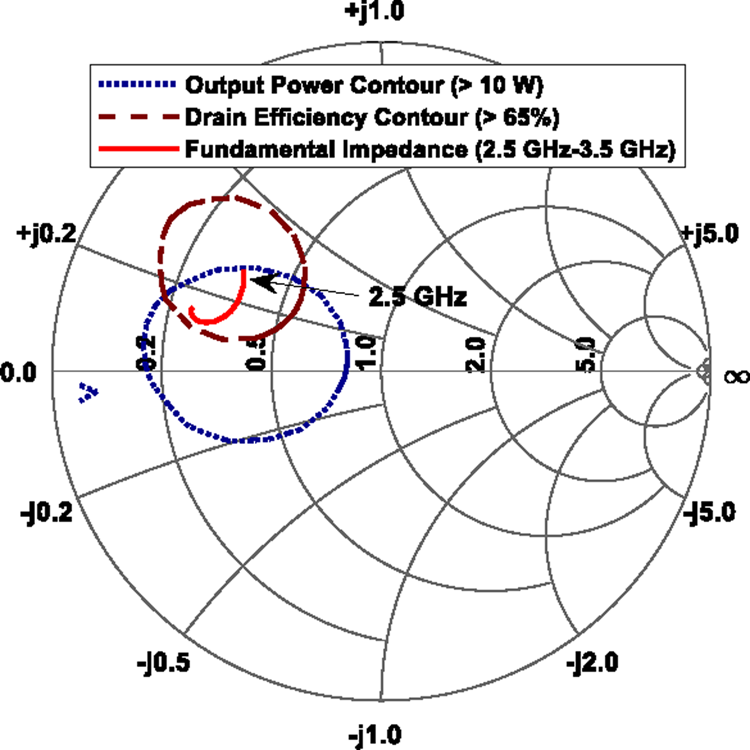
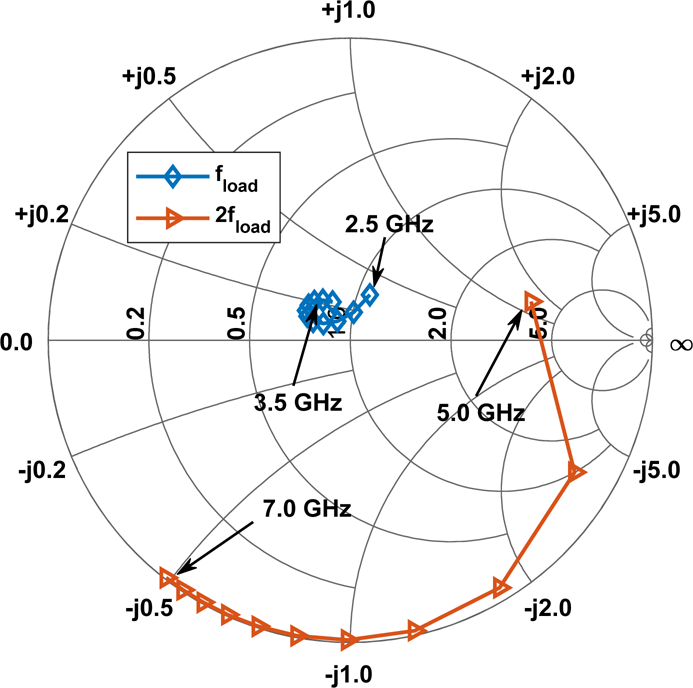
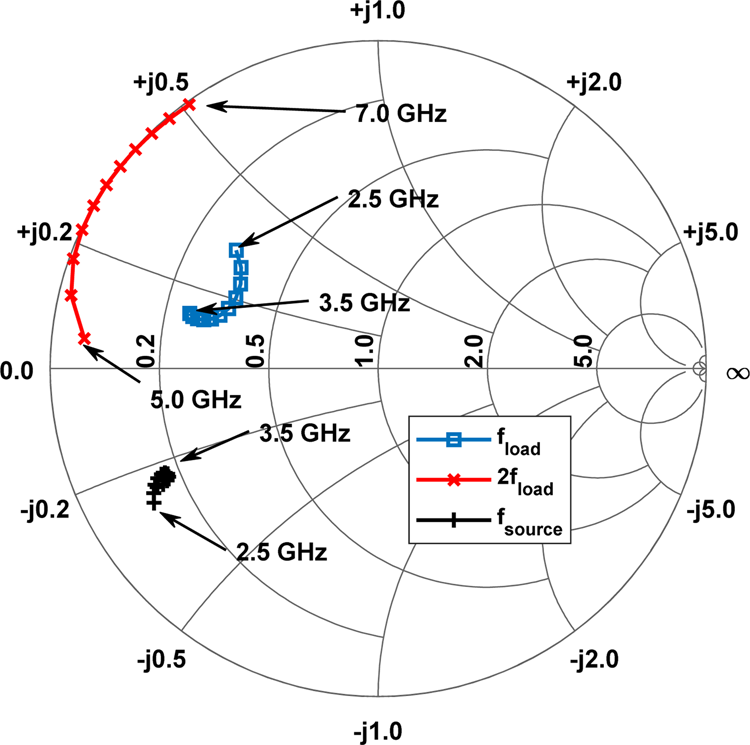
Based on a load-pull simulation using the proposed broadband SVR model across the desired frequency band, a target package-plane load impedance trajectory across frequency is determined, as shown in Fig. 14. This impedance is chosen such that it provides a drain efficiency greater than 65% and output power of over 10 W. As can be seen from the results, once the maximum power delivery area and maximum drain efficiency area have been found by the proposed SVM model, a compromise has to be made since these regions are not coincident, in general. As shown in Fig. 14, one such suboptimal overlapping area is identified within which the output power is greater than 40 dBm and the drain efficiency is over 65 %. A matching circuit is designed, targeting this “area” of the load Smith chart, providing a predetermined compromise between PA output power and drain efficiency. The resulting current-generator-plane load impedance trajectory across frequency can also be obtained via de-embedding, as shown in Fig. 15. This allows the designer to verify that the PA operates in the desired mode – class-J, this is the case. The corresponding fundamental and second harmonic load impedance at the external drain package-plane, for which a matching circuit must be synthesized, is given in Fig. 16, along with the fundamental optimal source matching impedance trajectory.
Compromise area (DE>65% & Pout>10 W) used by designers to choose fundamental load trajectory, from 2.5 GHz to 3.5 GHz, looking at external drain package plane.

Compromise (Drain Efficiency > 65% & Pout >10 W) target S-parameters line used for designers to choose fundamental and second harmonic load impedances i.e. looking at current generator plane.

Compromise (drain efficiency>65% and Pout>10 W) target S-parameters trajectory used for designers to choose fundamental and second harmonic load impedances i.e. looking at external drain package plane.

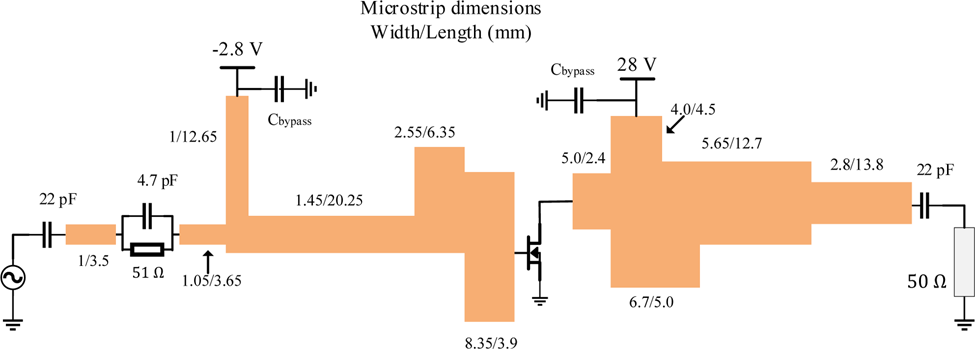
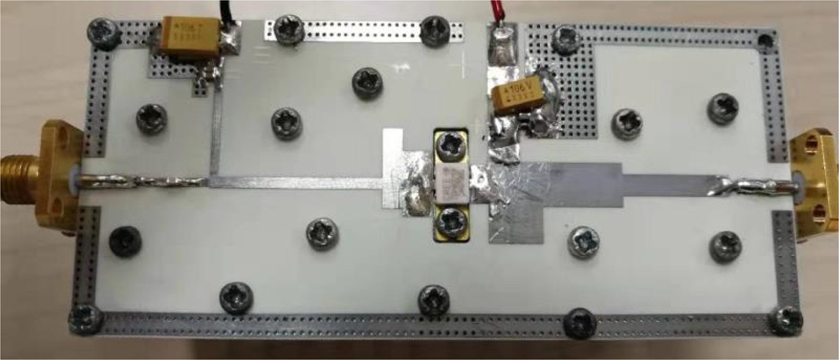
After the matching networks are determined, the PA is fabricated on Rogers 4350B microstrip board. This board has a substrate thickness equal to 0.762 mm and a nominal relative permittivity equal to 3.48. The layout of the PA is shown in Fig. 17. A photograph of the fabricated PA is shown in Fig. 18.
Actual size diagram of fabricated class-J PA.

Photograph of fabricated class-J PA.

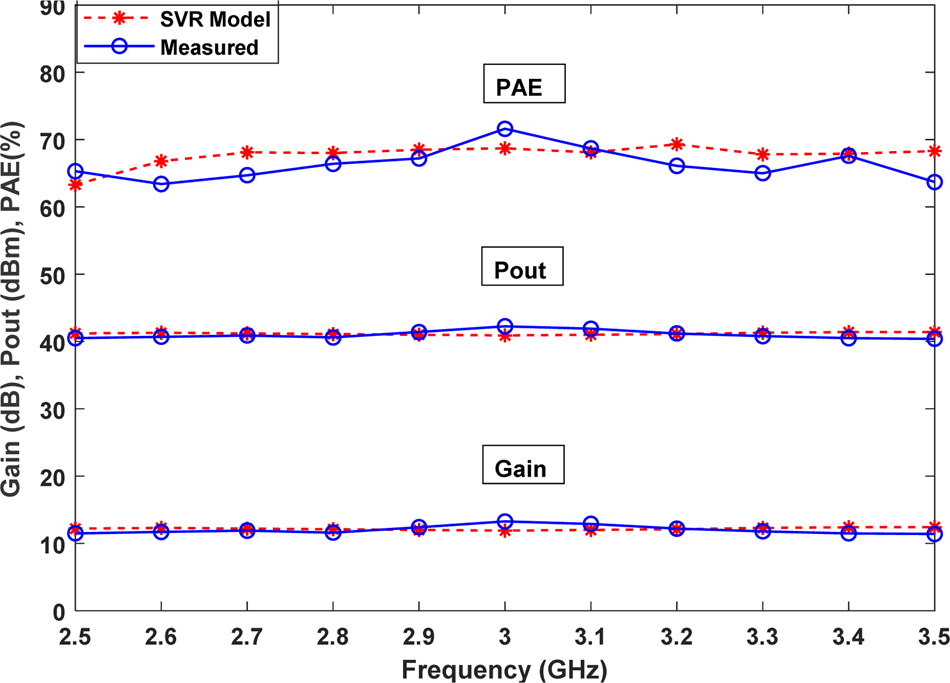
The performance of the fabricated PA across the targeted frequency band is shown in Fig. 19, along with the simulation results from the proposed broadband SVR model. An excellent match of the output power, efficiency, and gain, between the model simulation results and measurements of the realized class-J PA is seen in the figure. The realized PA provides an average power added efficiency of 66.34%, an across-the-band-average output power of 41.01 dBm, and gain of 12.01 dB.
Class-J PA measured and modelled from proposed model results.

Conclusion
This paper presents a new broadband behavioral model for a 10 W Wolfspeed GaN HEMT device, based on the SVR method from the field of machine learning. The basic theory of the modeling technique is provided, along with the model implementation and model extraction procedure. Unlike previous work, the proposed modeling method includes, explicitly, frequency information as an input to the model, which enables broadband scattered-wave prediction from the model. Validation examples from experimental tests prove the effectiveness of the new modeling technique. The model provides prediction throughout the Smith chart, at both the fundamental and second harmonics of RF behavior, across a wide frequency range, with excellent model fidelity. The proposed model can also give an accurate prediction for the dc behavior across the frequency band.
In order to verify the proposed model under realistic real-world conditions, a high-efficiency broadband class-J PA is designed based on this model. The optimal input and output matching impedance is chosen through broadband load-pull simulation of the new model. Performance comparison between the simulation results based on the model and the measurements from the fabricated PA show very good agreement for output power, gain, and efficiency across the full frequency band.
Financial support
This work was supported by the National Natural Science Foundation of China (NSFC) under Grants 61971170,61701147, 61971171, and 61827806.
 Jialin Cai (StM’10, M’15, SM’20) received the B.E. degree and M.E. degree both in Electronic Engineering, from Zhejiang University in 2007 and Southeast University in 2010, respectively, and the Ph.D. degree in electronic engineering from University College Dublin in 2015. From 2015 to 2016 he was a Post-doctor researcher at University of Aveiro, Portugal. Currently, he is an Associate Professor with Key Laboratory of RF Circuit and System, Ministry of Education, Hangzhou Dianzi University, Zhejiang, China. His main research interests include active device, circuit and system-level modeling, the analysis and design of nonlinear microwave circuits, in particular, the RF power amplifiers.
 Justin B. King (StM’04, M’12, SM’18) received the B.E. degree in electronic engineering from University College Dublin (UCD), Dublin, Ireland. He received the Ph.D. degree for his work on Device Modeling in 2012, after studying at the UCD RF and Microwave Research Group in the School of Electrical and Electronic Engineering under the supervision of Prof. Thomas Brazil. He is currently Head of the Trinity RF and Microwave Research Group in Trinity College, Dublin, Ireland. He has served on the TPC for both national and international conferences and is a member of the MTT-S Young Professionals Committee. His current research interests include nonlinear electrothermal device characterization, with emphasis on high-power GaN transistor modeling for modern PA design. He is also interested in device physics, nonlinear circuit simulation algorithms, and modeling for antenna arrays.
 Shichang Chen (S’09–M’14) received the B.S. and Ph.D. degrees from the Nanjing University of Science and Technology and City University of Hong Kong in 2009 and 2013, all in electronic engineering. From September 2013 to August 2014, he was with the City University of Hong Kong as a Postdoctoral Fellow. He is currently with Hangzhou Dianzi University as an Associate Professor. His research interest focuses on high-efficiency power amplifier, integrated circuits, and sensors.
 Meilin Wu received the B.S degree from Yichun University in 2019. From September 2019, he is a master student of Hangzhou Dianzi University, Hangzhou, China. His research interest focuses on the high-efficiency power amplifier.
 Jiangtao Su (SM’08) was born in China in 1981. He received the B.E. and M.E. degrees in electronic engineering from Ocean University of China, QingDao, China in 2002 and 2005, and Ph.D. degree in electrical and electronic engineering from Cardiff University, Cardiff, UK in 2011, respectively. In 2010, he joined Mesuro.Ltd as a scientific engineer until December 2015. Since 2016, he has been with the School of the Electronic Information, HangDian University, China, where he is a specially appointed researcher. His current research interests include nonlinear device characterization and modeling, large-signal nonlinear measurement, and mmWave circuits design.
 Jianhua Wang received the B. S. degree in physics from Zhejiang Normal University, Jinhua, Zhejiang, China, in 2013, and the Ph. D. degree in electromagnetic field and microwave techniques from University of Science and Technology of China, Hefei, Anhui, China, in 2018. He joined the Hangzhou Dianzi University, Hangzhou, Zhejiang, China, in 2018 as a lecturer, his current research interests include microwave/millimeter-wave testing theory and technology.