I. INTRODUCTION
Electrospinning has become a widely used method to fabricate porous nanofiber membranes due to its high surface-to-mass ratio, fabrication simplicity, and capability of producing random or aligned nanofibers made of a wide variety of polymers. Electrospun fiber membranes have been used in multiple fields such as filtrations,Reference Mohammadian and Haghi1 membranes,Reference Wang, Ding, Lee, Wang and Lin2 tissue engineering scaffolds,Reference Sotoudeh, Jahanshahi, Jahanshahi, Takhtfooladi, Shabani and Soleimani3 wound healing,Reference Unnithan, Barakat, Pichiah, Gnanasekaran, Nirmala, Cha, Jung, El-Newehy and Kim4 release control,Reference Park and Lee5 sensors,Reference Jamil, Batool, Imran, Usman, Rafiq, Willander and Hassan6 and energy storage,Reference Doan, Boyle, Ottley, Hoppe and Alam7 just to name a few. In electrospinning, typically, a stream of melted polymer or a polymer solution is connected to a high electric field. The electric field provides an electric force to the polymer solution resulting in the formation of fibers as the electric field surpasses a threshold value where electrostatic repulsion forces from surface charges overcome the surface tension.Reference Geng, Kwon and Jang8 Electrospinning offers a promising way to fabricate uniform continuous fibers with diameters ranging from the nano- to the microscale, which is much smaller than those prepared by traditional methods of solution spinning or melt spinning.Reference Han, Chen, Branford-White and Zhu9 The material, fabrication method, and resulting structure of the electrospun fibers significantly influence the property and application of the electrospun membranes. Some material and processing variables, which are considered important to the microstructure of electrospun fibers, include solution properties, applied voltage, tip-to-target distance (working distance), solution feed rate, processing temperature and humidity, and the type and configuration of the electrode collector.Reference Megelski, Stephens, Chase and Rabolt10–Reference De Vrieze, Van Camp, Nelvig, Hagstrom, Westbroek and De Clerck13 Among them, solution properties are the most crucial factor affecting electrospun fiber formation.
Solution properties include the molecular weight and molecule structure of the polymer solute as well as the conductivity, surface tension, pH value, and rheological properties. The fiber diameter and membrane porosity are the most important microstructure factors for electrospun fibers, and dictate the application areas of the resulting membranes.Reference Huang, Zhang, Kotaki and Ramakrishna14 Thus many prior studies have focused on the effects of solution properties on fiber formation. It has been reported that the higher the molecular weight, the larger the electrospun fiber diameter will be.Reference Afifi, Yamane and Kimura15 However, for highly branched molecules, the fiber diameter is smaller than the fiber electrospun from linear molecules.Reference McKee, Park, Unal, Yilgor and Long16 Lim et al.Reference Vega-Lugo and Lim17 reported that the solution’s pH value significantly affects electrospinning behavior of whey protein isolate/poly(ethylene oxide) (WPI/PEO) solutions. In particular, acidic solutions resulted in smooth fibers, neutral solutions produced spheres with ultrafine fibers, and alkaline solutions led to fibers embedded with beads. Improving solution conductivity by the addition of carbon nanotubesReference Choi, Jang, Hyeon and Sok18 and other conductive additives,Reference Nayak, Kyratzis, Truong, Padhye and Arnold19 or by the dissolution of sodium chlorideReference Rwei and Huang20 in the polymer solution, can enhance solution electrospinnability as well. Surface tension of the polymer solution directly affects polymer jet formation, as electrostatic forces in the electric field must overcome the surface tension of the solution to form a polymer jet.
Rheological properties are among the most complicated solution factors affecting fiber formation. Researchers have related polymer molecular chain entanglement theories with the polymer solution’s viscosity to investigate the effect of viscosity on electrospun fiber formation. Experimental observations in electrospinning confirmed that for the fiber formation to occur, a minimum level of polymer concentration is required. This critical concentration is called the critical chain entanglement concentration (C e).Reference Mit-uppatham, Nithitanakul and Supaphol21 This concentration defines the transition from semidilute unentangled regimes to semidilute entangled regimes. Below this concentration, application of voltage to the solution results in electrospraying or bead formation due to Rayleigh instability.Reference Shenoy, Bates, Frisch and Wnek22 As the concentration increases, entanglements between polymer chains first result in both fibers and beaded nanofibers, and eventually produces uniform fibers.Reference McKee, Wilkes, Colby and Long23
In a polymer solution, both concentration and molecular weight affect the degree of chain entanglement. In a dilute solution, chain overlapping is absent. As the concentration increases, the molecular chains start to overlap and eventually entangle with each other when C = C e. The solution viscosity and fiber diameter also increase with increasing physical chain entanglements.Reference Mit-uppatham, Nithitanakul and Supaphol21,Reference Tong and Wang24
Numerous types of polymers have been used for the electrospinning process.
Among them thermoplastic polyurethane (TPU), which belongs to the polyurethane (PU) group, is a linear segmented block copolymer composed of soft and hard segments. In most TPUs, soft segments such as aliphatic polyether polyols or aliphatic polyester polyols are coupled with hard segments of diisocyanates, such as toluene diisocyanate (TDI), diphenylmethane diisocyanate (MDI), and 1,6-hexamethylene diisocyanate (HDI), followed by a chain extension with a diol in the presence of catalysts. Thus, the molecular weight and molecular structure of a TPU can be adjusted via the chemical synthesis formula and ratio of soft and hard segments.Reference Groth, Klosz, Campbell, New, Hall and Goering25 The electrospinning microstructure of PU and the application of PU electrospun fibers have been studied extensively.Reference Stankus, Guan and Wagner26 Despite the wealth of literature on electrospun PU fibers, fundamental studies on the effects of rheological properties on the electrospinning behavior of TPU and TPU blends is scarce because of the numerous TPU molecular structures.
Several researchers have reported the effects of rheological properties on the electrospinnability of solutions of polymer blends. The interactions between different polymer molecular chains and between polymer chains and solvent molecules were found to be important. For instance, the addition of poly(ethylene oxide) (PEO) was found to improve the spinnability of a chitosan solution dramatically. This was because replacing part of the chitosan with PEO at the same concentration reduced the solution’s viscosity so that a chitosan/PEO solution at a higher concentration could be electrospun.Reference Klossner, Queen, Coughlin and Krause27,Reference Pakravan, Heuzey and Ajji28 In another polymer blend solution study, strong hydrogen bonds formed between poly(vinyl phenol) and poly(vinyl pyrrolidone) molecules and induced a better electrospinning microstructure than either of the pure polymers alone under the same electrospinning conditions.Reference Buruaga, Munoz, Irusta, Gonzalez and Iruin29 A study of the shear viscosity behavior of keratin/PEO blends reported that the keratin might have displaced the solvent molecules and penetrated into the PEO chain coils, thus increasing the relaxation time and viscosity of the blend solution and affecting its electrospinning behavior.Reference Varesano, Aluigi, Vineis and Tonin30
To the best of the knowledge of the authors, the electrospinnability of TPU blends has not yet been reported. Therefore, the effects of rheological properties and chain entanglements of molecules from soft and hard segments on the electrospinning of TPU blends and their fiber formation behavior were investigated in this study. Relationships between the electrospun fiber diameter, the Berry number, and the normalized concentration of the solutions were also studied and reported in this article.
II. EXPERIMENTAL SETUP
A. Materials
Two kinds of medical grade TPUs—i.e., Tecophilic SP-80A-150 with weight average of molecular weight [(Mw) = 179464 Da; number average of molecular weight (Mn) = 63,492 Da] and Carbothane PC-3572D [(Mw) = 201873 Da; Mn = 94,212 Da]—were generously donated by Lubrizol Corp. (Wickliffe, OH). In this study, the Tecophilic SP-80A-150, which is an aliphatic hydrophilic polyether-based TPU, is labeled “soft TPU” (because it contains predominantly soft segments) whereas the Carbothane PC-3572D, which is an aliphatic aromatic polycarbonate-based TPU, is termed “hard TPU” (due to its high loading of hard segments). The solvent used in the solution is N, N-dimethylformamide (DMF), which was purchased from Sigma Aldrich (St. Louis, MO). The molecular weight data of both TPUs were measured using gel permeation chromatography (GPC). All materials were used as received.
B. Electrospinning process
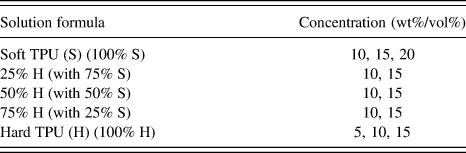
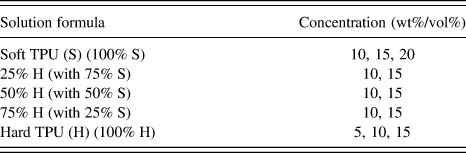
The TPU pellets were dried at 80 °C for 2 h prior to solution preparation. The two types of pure TPUs and their blends at different ratios were prepared and at multiple concentrations by dissolving different amounts of TPU pellets in DMF for 8 h with magnetic stirring at 70 °C. The solutions were prepared based on the material composition formulas listed in Table I. In particular, the solutions of soft TPU (S), hard TPU (H), and their blends at 25% H, 50% H, and 75% H weight ratios were prepared.
Electrospinning solution formulas.
For the electrospinning process, the solution was first loaded in a plastic syringe that was connected to an 18-gauge blunt end needle then mounted on a digital syringe pump. The electrospinning procedure was carried out at 15 kV, 150-mm working distance, and with 0.5 mL/h flow rate. The electrospun fibers were collected using a ground thin aluminum foil as the electrode collector. The same conditions were used for all of the solutions to eliminate the effect of processing parameters. All of the solutions were used immediately after they were prepared to avoid possible phase separation of soft and hard TPUs.
C. Characterizations
1. Fourier transform infrared spectroscopy
Fourier transform infrared spectroscopy (FTIR; Bruker Tensor 27, Billerica, MA) was used to identify the change of functional groups at different blend and solution formulas. The electrospun membranes collected were analyzed in absorbance mode in the range of 600–4000 cm−1.
2. Thermogravimetric analysis
Soft and hard segment portions in various TPU and TPU blend solutions were measured based on their decomposition temperature difference by thermogravimetric analysis (TGA; TA model No. Q50). Approximately 10 mg of electrospun membrane were used for each test, which was initiated at room temperature and heated at a rate of 10 °C/min to 500 °C.
3. Rheological property tests
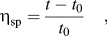
Dynamic viscosities were tested using a Fenske routine viscometer (Cannon Instrument Company, State College, PA) at 80 °C following the standard test method for kinematic viscosity (ASTM D445). Due to the relatively high viscosity of the solutions, a higher temperature (i.e., 80 °C) was used so that the solution would flow freely within the test instrument. The specific viscosity, ηsp, was calculated based on Eq. (1),
 $${\rm{\eta }}_{{\rm{sp}}} = {{t - t_0 } \over {t_0 }}\quad,$$
where t and t 0 were the measured flow times of the solution and the DMF solvent, respectively.
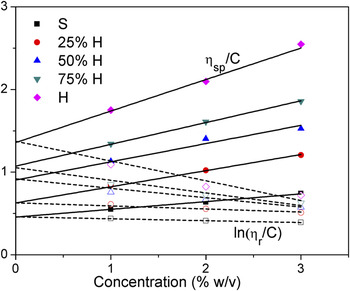
The intrinsic viscosity [η], which is a measure of a solute’s contribution to the viscosity of a solution or the volume per unit mass that the polymer occupies in a solution, was determined by extrapolating ηsp/C or ln (ηr/C) to the zero concentration according to the Huggins’ equation, where ηr = t/t 0 is the relative viscosity.
The solutions’ storage and loss moduli dependence on shear stress and frequency was tested via a parallel-plate rheometer (AR 2000ex, TA Instruments, New Castle, DE). A 25-mm parallel-plate geometry was used and all tests were performed at 25 °C. An oscillatory stress sweep test was carried out with a stress range from 0.1 to 1000 Pa under a constant 1 Hz frequency. Oscillatory frequency sweep tests were performed at a constant stress of 1 Pa, which was obtained within the linear viscoelasticity range from the stress sweep test, with an increase of angular frequency from 0.1 to 100 rad/s.
The steady-state shear viscosities of the solutions were tested with an ARES rheometer (TA) at 25 °C. A 4 °C cone-and-plate geometry was used for the steady-state shear viscosity test with an increase of shear rate from 0.01 to 10 s−1.
4. Scanning electron microscopy
The microstructure and formation of electrospun TPU fibers were characterized using a fully digital scanning electron microscopy (SEM; LEO GEMINI, Zeiss, Germany, model No. 1530 with an accelerating voltage of 3 kV). The electrospun membranes were cut with a scalpel and sputtered with gold for 40 s before imaging. Fiber diameter was measured via the Image Pro-plus (IPP) software package. At least 50 individual fibers were measured from several SEM images at different locations of the sample membrane. Both fiber diameter frequency and average fiber diameter were calculated based on the fiber diameter measurements.
III. RESULTS AND DISCUSSION
A. Proportion analysis of hard and soft segments
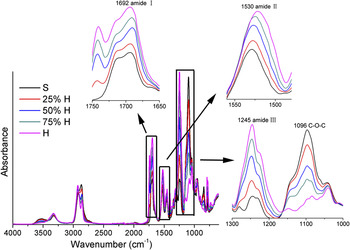
As shown in Fig. 1, FTIR results revealed a gradual change of soft and hard segments portions in the electrospun membranes of TPU blends. No creation of a new peak or peak shifting was observed from the FTIR results, which indicated that no chemical reaction had occurred during the polymer mixing or electrospinning processes. The absorption peaks at 1530 and 1245 cm−1 corresponded to (–C–N–) bonds in the urethane (–NHCOO–) groups from amide II and amide III, respectively.Reference Pinto, Visconte and Nunes31 The peak at 1692 cm−1 represented the amide I group. Stretching of the ether group C–O–C was associated with the absorption peak at 1096 cm−1.Reference Dong, Li and Zou32 The amide groups, which were induced by the reactions of diisocyanate and chain extenders as well as diisocyanate and polyol, represented the content of the hard segments. On the other hand, the ether group, which only existed in the soft segments, represented the respective portion of soft segments. The FTIR results clearly show that as the content of hard TPU (Carbothane PC-3572D) increased, the intensity of the hard segments increased and the intensity of the soft segments decreased. This confirmed that the ratio of soft and hard segments in the blend solutions could be adjusted simply by changing the respective portions of soft and hard TPUs.
FTIR test results of S, 25% H, 50% H, 75% H, and H electrospun membranes. Four functional groups were enlarged to show the intensity variation more clearly.

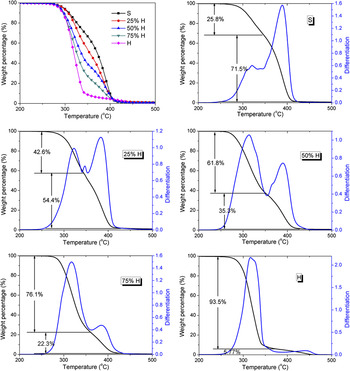
The proportion of soft and hard segments in the electrospun membranes was investigated by TGA based on their different decomposition temperatures. The peptide bonds in the hard segments could be easily broken at high temperatures while ether and carbons bonds had higher cleavage temperatures.Reference Buczek, Krowarsch and Otlewski33 Therefore, the ratio of hard segments could be estimated according to the weight loss of the first differentiation peak. It was found from the TGA results (see Figure 2) that the ratio of hard segments increased gradually from 26 to 94% from samples S to H with their blends in between. It was also found that all of the samples started and finished decomposition at about the same temperatures. The fact that the curves of the TPU blends were located between those of S and H indicated a homogenous thermal degradation behavior.
TGA test results of S, 25% H, 50% H, 75% H, and H electrospun membranes and the estimated proportion of hard segments (top number percentages) and soft segments (bottom number percentages).

B. Rheological properties of TPU blend solutions
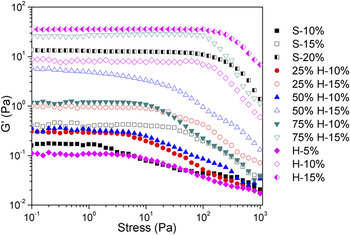
The effect of blending hard TPU with soft TPU on the rheological properties of electrospinning solutions was studied via different characterization methods. Stress sweeps were used to characterize the stability of the solutions. That is, on the storage modulus versus oscillatory stress plot, the wider the linear viscoelastic range and the higher stress that the solution could withstand, the more stable the solution was. As all of the solutions were in the linear viscoelastic range at a stress of 1 Pa, this constant stress was used for the frequency sweep rheological testing. It can be seen in Fig. 3 that the stability of the solution decreased with decreasing polymer concentration and increased with increasing hard segment content at the same concentration. The storage modulus within the linear viscoelastic range also exhibited the same tendency, which indicates that the more hard segments there are in the solution, the higher the storage modulus of the solution will be at the same concentration.
Oscillatory stress dependence of the storage modulus (G′) for TPU solutions. The second percentage in the legend represents the solution’s concentration.

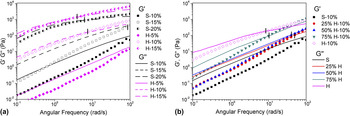
The oscillatory frequency sweep measurement was carried out to investigate the physical entanglement between molecular chains in the polymer solutions. It is well known that the storage modulus represents the elasticity and stored energy of materials and that the loss modulus is associated with the viscous nature and unrecoverable viscous loss of materials. As shown in Fig. 4, both storage modulus (G′) and loss modulus (G″) increased with an increase in the angular frequency and G″ was always higher than G′ at low frequencies. This suggested that a liquid-like behavior prevailed in the lower frequency range. On the other hand, at high frequencies G′ exceeds G″ indicating that the solid-like characteristics and energy stored in the test samples became more predominant.Reference Chisca, Barzic, Sava, Olaru and Bruma34 It was also found that both G′ and G″ increased with increasing solution concentration [Fig. 4(a)] and hard segment content [Fig. 4(b)]. Generally speaking, the frequency at which the elastic and viscous moduli cross, i.e., G′ = G″ marks the transition from the viscous-like region to the elastic-like region. This kind of transition could be attributed to the fact that the degree of entanglement was enhanced by high frequencies. For solutions at low concentrations such as S-10% and H-5%, no crossover point could be observed within the frequency range tested. Data for both soft and hard TPUs in Fig. 4 also showed that the crossover frequencies tended to shift to a lower frequency as the solution concentration increased [Fig. 4(a)]. As shown in Fig. 4(b), an increase of the hard segment proportion also led to a decrease of the crossover frequency for solutions at 10% concentration. It has been reported that the shift of the crossover point reflects a change of degree of physical cross-linking in the material.Reference Ren, Picout, Ellis and Ross-Murphy35,Reference Chronakis and Ramzi36 Thus the shift of crossover frequencies here confirmed that the physical cross-linking and chain entanglement in the polymer solutions increased as the concentration and hard segment content increased.
Angular frequency dependence of storage (G′) and loss (G″) moduli. (a) Soft and hard TPU solutions at various concentrations. (b) S, 25% H, 50% H, 75% H, and H solutions at 10% concentration. The crossover points of G′ and G″ of each solution are marked for better visualization. The second percentage in the legend represents the solution’s concentration.

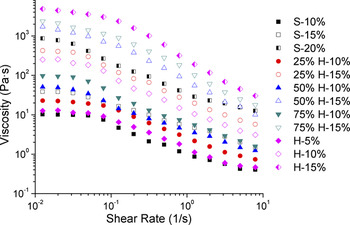
The steady-state shear viscosity test results of different TPU solutions using a cone-and-plate rheometer are shown in Fig. 5. It was found that the solutions exhibited a Newtonian fluid behavior at low shear rates and a shear thinning behavior as the shear rate increased. At low shear rates the stress was not high enough to alter the conformation of the polymer molecular chains in the solution, thereby resulting in a Newtonian plateau at low shear rates, which corresponded to zero-shear viscosity (η0). As the shear rate increased the polymer molecular chains started to orient themselves parallel to the flow direction leading to a drop in shear viscosity.Reference Kopperud, Hansen and Nystrom37 Note that solutions with higher polymer concentrations showed a higher solution viscosity. It was also noticed that as the solution concentration and hard segment increased, the shear thinning behavior became more profound and occurred at a lower shear rate. This effect can be explained in terms of the enhanced entanglement networks, which could be disturbed at a lower shear rate in the steady-state shear viscosity measurement.Reference Nie, He, Zheng, Xu, Li and Han38 Alternatively, it can also be explained by the fact that the shear thinning behavior started to occur when a critical shear stress level was reached. Solutions with a higher zero-shear viscosity would reach the critical shear stress level at a lower shear rate.
Steady-state shear rate dependence of viscosity for TPU solutions. The second percentage in the legend represents the solution concentration.

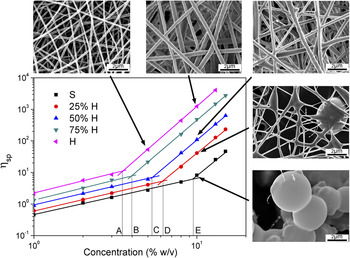
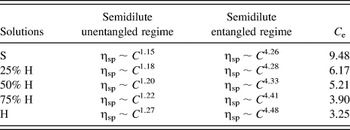
As introduced in the previous section, the critical chain entanglement concentration C e is crucial for the formation or elimination of beaded fibers. The log-log plot of specific viscosity (ηsp) of different TPU and TPU blend solutions as a function of concentration is shown in Fig. 6. According to the method proposed by Colby et al.,Reference Krause, Bellomo and Colby39,Reference Bordi, Colby, Cametti, De Lorenzo and Gili40 there are two different power-law dependences and regions between ηsp and the solution concentration. For neutral linear polymers in a good solvent, the specific viscosity can be represented as ηsp ∼ C 1.25 in the semidilute unentangled regime and as ηsp ∼ C 4.25−4.5 in the semidilute entangled domain.Reference Chisca, Barzic, Sava, Olaru and Bruma34Table II lists the curve-fitted power-law coefficients and the values of the critical chain entanglement concentration C e for various TPU solutions. It was found from the results that the relationship between ηsp and C e for all of the five TPU solutions exhibited two distinct power-law dependences and regions. Moreover, the exponents in both regimes increased as the hard segments in the solution increased. As illustrated in Fig. 6, the C e obtained from the plot (indicated by the capital letters A–E) decreased gradually from 9.48 to 3.25% as the hard TPU portion increased in the blends. Thus it was confirmed that the addition of hard TPU into the electrospinning solutions increased the hard segment content, improved the elasticity or jet stability of the solution (based on the solution modulus and viscosity tests and observation of fiber’s microstructure), and reduced the critical chain entanglement concentration required for bead-free electrospun fiber formation.
Concentration dependence of the specific viscosity of TPU solutions. The SEM images show the representative electrospun fiber morphology corresponding to the selected data points indicated by arrows. The chain entanglement concentration Ce is shown in the figure and listed in Table II.

Power law dependence of semidilute unentangled and entangled regimes, and critical chain entanglement concentrations of different solutions.

C. Electrospun fiber microstructure of TPU blends
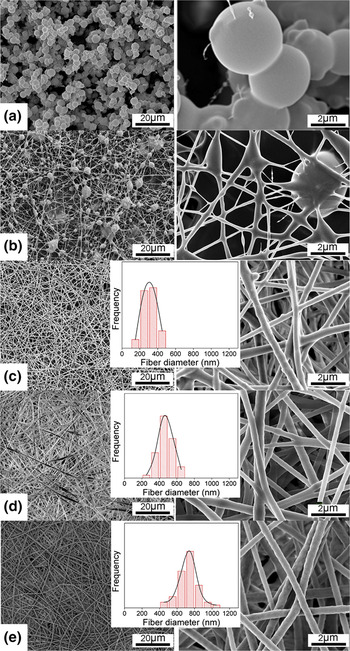
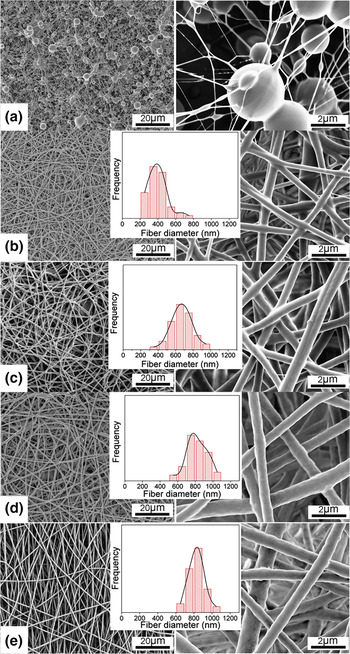
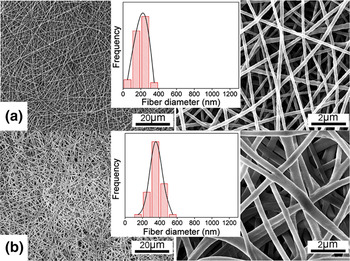
The SEM images of electrospun fibers using different solutions at the same processing conditions are shown in Figs. 7–9. The fiber diameter distribution frequency is plotted in the insets of the images. It was noticed that the diameter distribution of bead-free fibers [in Figs. 7(c)–7(e), Figs. 8(b)–8(e), and Figs. 9(a)–9(b)] is quite uniform and shows a nominal distribution for most membranes. In addition, the diameter distribution for the TPU blend electrospun membranes was slightly broader than that of the pure TPU membranes at 15% concentration (see Figure 8). This greater fiber diameter variation resulted from the different kinds of characteristics of the soft and hard segments in the TPU blends.
SEM images of fiber structure by electrospinning different TPU solutions at 10% concentration: (a) S, (b) 25% H, (c) 50% H, (d) 75% H, and (e) H. The inset histograms indicate the statistical fiber diameter frequency.

SEM images of fiber structure by electrospinning different TPU solutions at 15% concentration: (a) S, (b) 25% H, (c) 50% H, (d) 75% H, and (e) H. The inset histograms indicate the statistical fiber diameter frequency.

SEM images of fiber structure by electrospinning of (a) H-5% and (b) S-20%. The inset histograms indicate the statistical fiber diameter frequency.

Polymer droplets were observed in Fig. 7(a), which was electrospun using solution S-10% (i.e., pure software TPU solution at 10% concentration). This solution concentration was just over the chain entanglement concentration of 9.48% (see Figure 6 and Table II). As a result, the degree of chain entanglements was not sufficient enough to yield fiber formation. As the hard segments in the TPU solution continued to increase, fibers (embedded with beads) started to form even at a solution concentration of 10%. For example, a beaded fiber structure was observed with the 25% hard TPU blend solution at the same solute concentration of 10% [see Figure 7(b)]. Note that the C e of the 25% H solution was 6.17%, meaning that the 10% concentration used was 1.6 times that of the C e. Thus the formation of fibers with beads interspersed started to occur, even though the molecular chain entanglement was not sufficient enough to produce a uniform fiber structure. A similar situation was noticed for the S-15% sample [Fig. 8(a)] whose concentration at 15% was 1.6 times that of its C e of 9.48%. Therefore, similar beaded fibers were formed. It has been reported that the solution concentration needs to be at least 2–2.5 times that of C e to form uniform, bead-free fibers for linear and branched polyesters.Reference McKee, Wilkes, Colby and Long23 In this current study of TPU solutions, it was found that soft TPU formed uniform fiber structures at the 20% concentration [see Figure 9(b)], which was about 2.1 times that of C e(S). The 25% H solution formed bead-free structures at a concentration of 15%, which was about 2.4 times that of C e (25% H). Both the 50% H and 75% H solution samples exhibited uniform fiber structures at 10% concentration, which was 1.9 times and 2.6 times higher than their C eS, respectively. The pure hard TPU solution could produce bead-free structures at 5% concentration, albeit with very small fiber diameter [see Figure 9(a)]. This was because its chain entanglement concentration for the pure hard TPU solution was very low (3.25%).
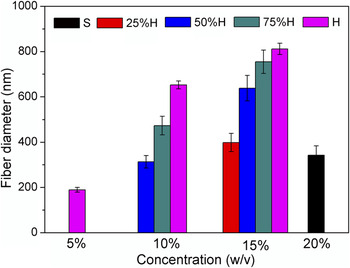
The statistical results of the measured fiber diameters for the different TPU blends solutions at various concentrations are shown in Fig. 10. Combined with the SEM images, it was found that at the same solution concentration the electrospun fiber diameter increased as the hard TPU content increased, which corresponded to the gradually decreased C e as the portion of hard segments increased. This result suggested that the hard TPU possessed better electrospinnability than the soft TPU. This was because of its higher ratio of hard segments and larger molecular weight, which provided longer molecular chains and thus a higher modulus, higher viscosity, lower critical entanglement concentration, and improved jet stability.
Fiber diameter results of electrospun fibers from different TPU solutions at various concentrations.

D. The dependence of fiber diameter on solution properties
As previously shown in Figs. 7–9, the fiber diameter increased with increasing solution concentration. It is well known that the solution concentration plays a major role in stabilizing the electrospun fiber structure. In addition to using the chain entanglement concentration, C e, to characterize the formation of electrospun fibers, other researchers have alternatively correlated solution properties and fiber formation with the Berry number.Reference Hong, Chou and He41,Reference Tao and Shivkumar42 The Berry number is defined as the product of [η] and C, where [η] is the intrinsic viscosity of the solution and C is the concentration of the solution. Solutions with [η]C < 1 are considered dilute solutions without any chain overlap, whereas polymer chains begin to entangle with each other when [η]C > 4. This is also the transition point where the fibers started to form in electrospinning. Stable fiber formation can be assured when [η]C > 9 at which point the chain entanglements become dominant.Reference Tao and Shivkumar42 The intrinsic viscosity is necessary to obtain the Berry number of a solution. The following Mark–Houwink–Sakurada equation has been commonly used to calculate the intrinsic viscosity,
 $$[{\rm{\eta }}] = KM^a \quad,$$
where M is the molecular weight of the polymer, and the constants K and a depend on the polymer, solvent, and temperature.Reference Rai and Rosen43
Unfortunately, these constants are not available in the literature for TPU as the TPU molecular structure varies widely depending on material synthesis and composition. Therefore, in this study the intrinsic viscosity, [η], of various TPU solutions was measured via the method described in the Experimental section above, as shown in Fig. 11. It is obvious that [η] increases with increasing content of hard segments.
Intrinsic viscosity ([η]) extrapolation from ηsp/C and lnηr/C as a function of solution concentration, where ηsp and ηr represent the specific viscosity and relative viscosity, respectively.

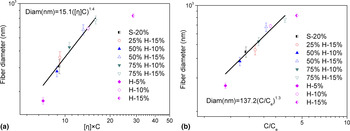
To further investigate the relationship between the fiber diameter and the Berry number, the fiber diameter was plotted against the Berry number for the various TPU solutions as shown in Fig. 12(a). The data points of the solutions that could be electrospun into uniform fibers are showed in the figure, and a power-law relationship was observed between the fiber diameter and the Berry number ([η]C) as
 $${\rm{Diam\, (nm)}} = 15.1([{\rm{\eta }}]C)^{1.4} \quad.$$
Variation of fiber diameter with (a) the Berry number ([η]C) and (b) the normalized concentration (C/C e) for electrospun fibers from different TPU solutions.

It was noticed that most solutions formed a uniform fiber structure in the [η]C > 9 regime, which agreed well with the previous study.Reference Tao and Shivkumar42 One of the two exceptions was the H-5% solution, which produced uniform fibers at [η]C = 7.2. The H-15% solution data was found to be another abnormal point from the fitted relationship, thus was not included in the curve fitting. The reason for this might be that the fitted equation is no longer applicable when the solution gets too close to the minimum or maximum solution concentration that can be electrospun (forming a uniform fiber structure). It was found in the additional test that the H-17.5% solution was too viscous for the electrospinning process and that the hard TPU could not be fully dissolved at 20% concentration (polymer chunks still existed in the solution even after dissolving for 8 h at 70 °C). It was also noticed from Figs. 8(d) and 8(e) that the fiber surface started to become rougher when the solution concentration and hard segment content were close to the maximum solution concentration that could be electrospun.
Some investigators have also correlated the electrospun fiber diameter with the so-called normalized concentration (C/C e), where C e is the aforementioned critical chain entanglement concentration.Reference Gupta, Elkins, Long and Wilkes44,Reference McKee, Elkins and Long45 The dependence of fiber diameter on C/C e is plotted in Fig. 12(b). A power-law relationship between the fiber diameter and C/C e was fitted as follows.
 $${\rm{Diam \,(nm)}} = 137.2(C/C_{\rm{e}} )^{1.3} \quad.$$
Again, the data point of the H-15% solution sample was not included in the power fitting for the reason described above. It was found that both Eqs. (3) and (4) described the relationship between the average fiber diameter and two different types of variables—i.e., the Berry number ([η]C) and the normalized concentration (C/C e)—pretty well.
IV. CONCLUSION
A soft TPU resin and a hard TPU resin, as well as their blends at different weight ratios, were used to (1) investigate the effects of hard and soft segment proportions and TPU solution concentrations on the microstructure of electrospun fibers and their formation mechanism, and (2) explore the relationship between the rheological properties of the solution and the resulting electrospun fiber diameters. The ratio of hard and soft segments in the solutions can be adjusted by controlling the content of soft and hard TPUs dissolved in DMF. Hard TPU, which has a higher molecular weight than soft TPU, had an extremely large portion of hard segments. The solutions with a higher concentration and more hard segments exhibited higher solution stability, greater storage and loss moduli, higher viscosity, and better electrospinnability due to the increase of molecular chain entanglement. The G′ and G″ crossover frequency obtained in the frequency sweep suggested that the degree of physical chain cross-linking and entanglements were higher for solutions having a higher concentration and more hard segments. It was also found that a pure soft TPU solution would not form a uniform bead-free fiber structure when its concentration was lower than 20%. The 25% H solution produced uniform fibers at 15% concentration, while the pure hard TPU could produce thin bead-free fibers even at 5% concentration. These results agreed with previously reported theory that states that beaded fibers form around C e concentrations while bead-free fibers can only be produced when the concentration is about two times that of C e. Relationships between the electrospun fiber diameter, the solution Berry number ([η]C), and the normalized concentration (C/C e) could be well described by two fitted equations based on the experiment data.
ACKNOWLEDGMENTS
The authors would like to acknowledge the support of the Chinese Scholarship Council and the Wisconsin Institute for Discovery, the financial support of the National Nature Science Foundation of China (Grant Nos.51073061 and 21174044), the Fundamental Research Funds for Central Universities (Grant No.2011ZZ0011), and the 973 Program (Grant No. 2012CB025902).