1. Introduction
Robotic treatment is becoming increasingly popular among patients suffering from neurological and musculoskeletal problems. Rehabilitation devices are used to help patients restore lost motor abilities. Manual or mechanical treatment is usually the only option for such patients to regain their motor abilities. Since there is repetition in specified exercises, manual assistance is difficult, time-consuming, and uncomfortable for the physiotherapist. Robotic rehabilitation is, therefore, a viable option [Reference Guiraud1, Reference Wahl and Schwab2, Reference Olaya and Delis3]. It can deliver high doses of motor instruction at a reasonable cost. Nonetheless, training is dependent on one-on-one interaction between a therapist and a patient in the historical setting; as a result, rehabilitation is expensive and time-consuming. In addition, the dosage is usually insufficient for adequate recovery. Previous research has focused on building robotic rehabilitation systems for patients with muscular and neurological disorders, but their practical application in clinics and homes has been limited. Robotic training is considered less effective than dose-matched motor training, provided by therapists [Reference Lo, Guarino, Richards, Haselkorn, Wittenberg, Federman, Ringer, Wagner, Krebs, Volpe, Bever, Bravata, Duncan, Corn, Maffucci, Nadeau, Conroy, Powell, Huang and Peduzzi4].
Task-oriented training is a research paradigm for upper extremity rehabilitation that includes three design concepts: skill development for functional activities, active participation training, and customized adaptive training. Recognizing a patient’s weakness and assigning appropriate tasks is challenging [Reference Jezernik, Colombo and Morari5, Reference Duret and Mazzoleni6]. To understand a patient’s functioning capability is essential to give appropriate therapy [Reference Rieger, Constantinescu, Redmond, Scott, King, Fedorak and Lundgren7, Reference Song and Tong8]. Constructive muscular engagement suited to the patients’ needs would help manage and adjust their activities-of-daily-living. The most common techniques for measuring a patient’s motor function are clinical scales and kinematic analysis. The Fugl–Meyer assessment, Oxford scale, Kendall scale, Ashworth scale, and a variety of other clinical measures are often used to assess upper limb functions [Reference Gladstone, Danells and Black9, Reference Radomski and Latham10]. Since these clinical measurements are semi-quantitative techniques [Reference Song and Tong8, Reference Kim, Kim and Kim11], it is difficult to distinguish the significant influence on muscle function and motor coordination during the rehabilitation process. As a result, detecting substantial changes in the patient’s motor movement using clinical measures is challenging. On the other side, due to the lack of quantifiable data on intervention effects and efficacy of various training protocols, the utility is limited across institutes and therapists [Reference Majidirad, Yihun and Cure12, Reference Garcia-Sanjuan, Jaen and Nacher13].
The surface electromyography (sEMG) and kinetic measures are essential tools in the study of movement because these can provide an electrophysiological perspective of motion. Researchers look at the effect of diminished dexterity on muscle activation post-injury [Reference Canning, Ada and O’Dwyer14]. The relationship between the post-stroke upper limb muscle weakness, co-contraction and clinical assessments of upper limb motor deficits and a physical handicap is examined by recording sEMG activity of paretic and non-paretic wrist flexors during isometric wrist flexion and extension [Reference Chae, Yang, Park and Labatia15]. Several studies have been conducted on mathematical and black box models to predict joint torque based on forces generated by muscle contraction. The Hill-based muscle model is a three-element model of mechanical muscle response used to convert sEMG signals to joint torque to maintain arm posture [Reference Fleischer16]. Callavaro et al. converted sEMG data using polynomial equations for joint torque prediction [Reference Cavallaro, Rosen, Perry and Burns17]. Using genetic algorithm (GA), researchers on sEMG have performed detection, analysis, feature extraction, and joint torque estimate [Reference Aung and Al-Jumaily18]. Regression analysis is utilized to estimate joint torque based on the best-fit mathematical model [Reference Elamvazuthi, Ling, Nurhanim, Vasant and Parasuraman19]. According to several recent studies, the optimum way to deduce a mathematical model for predicting joint torque is exponential equations [Reference Nurhanim, Elamvazuthi, Vasant, Ganesan, Parasuraman and Ahamed Khan20, Reference Kim, Park, Lee and Kim21].
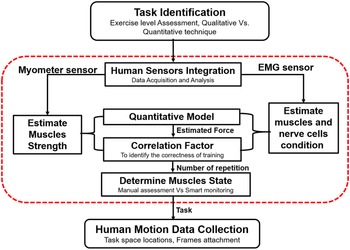
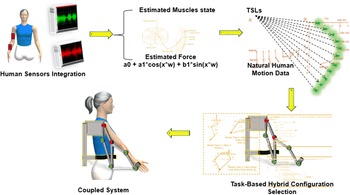
The research goal of the current study is to develop a quantitative statistical technique for weakness estimation and is capable of deciding the recommended exercise. When a person is connected to a robotic system, muscle weakness evaluation is essential to forecast the task for the rehabilitation device to create rehabilitation training. Figure 1 briefly explains the technique used in the present work for bio-mechanical–based joint motion reconstruction. The study used sEMG signals and force sensors to assess impairment and muscle engagement during elbow flexion/extension movement. A comparative analysis is used to identify the dominant muscle during elbow flexion motion, with the results confirmed using the Open-Sim software. Using a mathematical model, the force interaction is connected to the sEMG signals corresponding to the dominant upper arm muscle. The Pearson product correlation moment is computed to verify the efficient and successful rehabilitation training attempts. Anthropometric subject data are used to extract the necessary trajectory data points. Two realistic case studies are included to demonstrate the proposed algorithm framework as a tool for mapping weakness to robotic task planning.
Mapping of task planning to task-based robotic synthesis through automatic muscle weakness assessment tool.

2. Experimental setup and methodology
This section details the method for predicting a patient’s weakness to identify the task for the rehabilitation device in establishing rehabilitation training. The subjects’ elbow moment signals, sEMG signals, contact force signals, and natural human motion data are gathered for the study. Butterworth Low-Pass filter and crucial damping low-pass filtering are used to pre-process sensors data. This section has five stages: experiment setup and data acquisition, identification of dominant muscles by signal processing, correlation analysis, quantitative model estimation, and rehabilitation task planning.
2.1. Experimental setup and dataset acquisition
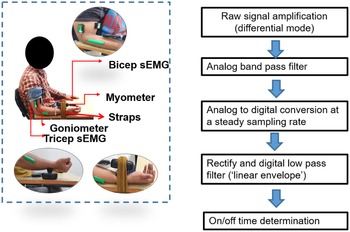
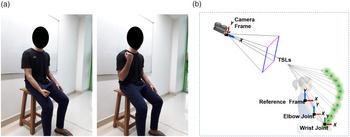
An experimental setup for elbow flexion/extension movement has been developed. The experimental setup consists of a MyoMeter sensor (M-550), wireless Goniometer (W-series) sensor, and LE-230 DataLite wireless sEMG sensors. These sensors have been purchased from the United Kingdom-based firm Biometrics Ltd to test muscle intervention and assessment. During the process, individuals are instructed to utilize their right hand; an extra harness system is primarily employed to keep the subject’s hand secure and to limit wrist mobility to a substantial degree. The body positions are demonstrated in Fig. 2(a), with the upper arms flexed to
 $0^{\circ}$
and forearms flexed to
 $90^{\circ}$
. The sensors’ reaction is explicitly tested for the biceps brachii and triceps brachii muscles during elbow flexion movement. The expected contact force is measured in real time using a wireless wrist-mounted Myometry sensor. Muscle activity is monitored using wireless sEMG sensors placed on the two aforementioned muscles during the elbow flexion. Wireless Goniometer sensors are used to track movement during exercise.
Data acquisition and signal processing.

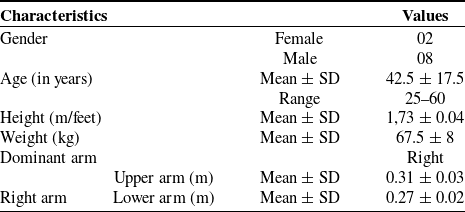
The data set contains motion data from 10 healthy subjects, 8 men and 2 women, ranging in age from
 $25$
to
 $60$
years old and weighing
 $50$
to
 $75.5$
kg, with their consent. The subject name protocol provides letters to distinguish male and female participants, as well as the subject’s serial number. For example,
 $F_{001}$
denotes a female candidate with a serial number of one. Table I displays the demographics and health information of the individuals.
Details of subjects demographic and health information. Here, SD represents standard deviation.

2.2. Dominant muscle identification using signal processing framework
The task is performed on the participants’ dominant arms. The angular displacements of the elbow joint are measured using a wireless Goniometer sensor. Sensors’ data are captured as analog signals, then smoothed and rectified using a digital low-pass filter. The sEMG signals from biceps brachii and triceps brachii are acquired from two selected muscles. Figure 2(b) depicts the analysis of the sEMG signals. The signal is recorded in differential mode, measuring the voltage difference between two electrodes. Before being digitized, the raw signal is subjected to analog filtering, most often band pass. Low and high frequencies are removed from the signal via band-pass filtering. The low-frequency cut-off is taken between
 $5$
and
 $20$
Hz, and the high frequency is taken as
 $200$
Hz –
 $1$
kHz [Reference Rose22]. The sampling rate is adjusted to at least twice the analog low-pass filter’s cut-off frequency. A digital high-pass filter to the stream is applied to eliminate movement and other artifacts. The 6th order,
 $20$
Hz high-pass filter, is employed to rectify and digitize the low-pass filter in the next step, where the signal’s absolute value is taken. The instances are identified to estimate on and off periods when the signal’s envelope (derived by removing mean value, rectifying, and applying a digital low-pass filter to the signal) exceeds a threshold. The threshold can be established by several factors, including:
 \begin{equation} Threshold = \mu + 3*\sigma, \end{equation}
where,
 $\mu$
and
 $\sigma$
denote mean and standard deviation, respectively.
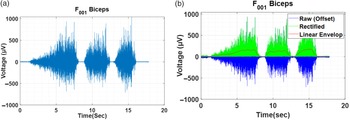
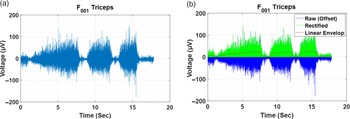
Algorithm 1 illustrates the procedure for extracting a linear envelope of signals. Figures 3 and 4 shows the raw data and processed data to extract linear envelope for a sample of biceps brachii and triceps brachii sEMG signals, respectively. Consequently, the sensors data have been analyzed for depicting all individuals’ sEMG sensors data for the biceps brachii and triceps brachii and for identifying substantial influences on upper arm movement.

A sample subject’s biceps brachii muscle responses while undergoing elbow flexion/extension exercise with three trials: (a) Pictorial representation of raw sEMG responses and (b) Processed sEMG responses to extract linear envelope.

A sample subject’s triceps brachii muscle responses while undergoing elbow flexion/extension exercise with three trials: (a) Pictorial representation of raw sEMG responses and (b) Processed sEMG responses to extract linear envelope.

2.3. Correlation analysis
Understanding the relationship between the muscles and the applied force is essential for task and interaction force control. To assess the relationship between the contact forces and the muscle responses, the Pearson product–moment correlation criteria (see Eq. (2)) are utilized. The correlation factor between the sensor data is used to reveal the redundant inputs and outputs and feature reduction and selection procedures—given the fact that the more linked the system is, the higher the correlation factor.
 \begin{equation} r = \frac{\sum (x_i - \bar{x})((y_i - \bar{y})}{\sqrt{(x_i - \bar{x})^2((y_i - \bar{y})^2}} \end{equation}
Here,
 $r$
= correlation coefficient,
 $x_i$
= value of muscle responses,
 $\bar{x}$
= mean of the value of the muscle response,
 $y_i$
= value of contact forces, and
 $\bar{y}$
= mean of the value of the contact forces.
2.4. Quantitative model and estimation
A mathematical model is required to convert sEMG signals of dominant muscle into muscle force estimation. The study utilizes the curve-fitting approach to identify the best fit mathematical model. An optimization problem is formulated using the Levenberg–Marquardt technique to minimize the error between the estimated and the actual forces (represented in Eq. (3)).
The fitness value is calculated by averaging the error percentages from all the data points.
 \begin{equation} Error = \sum _{i=1}^{n} \frac{(f_{est})_{i} - (f_{act})_{i}}{N_i}. \end{equation}
Here,
 $f_{est}$
denotes estimated force and
 $f_{act}$
denotes actual force.
 $N$
denotes data set size, and
 $n$
denotes sample rate. The coefficients
 $A_0$
,
 $A_1$
,
 $B_1$
, and
 $W$
play a crucial role in determining the simulated muscles strength based on sEMG signals.
The sum-of-squared errors (SSE), root mean square error (RMSE), and coefficient of determination (R-square) are the parameters used to evaluate the most appropriate model. SSE is calculated as the sum of the squared differences between the observed value and the predicted value, and a smaller value is preferable. The RMSE is defined as the standard deviation of the residuals (prediction errors) and must be less than one. The R-square is defined as the proportion of variation predicted by the independent variable in the dependent variable, and its value ranges from 0.1 to 1. A model with a greater value is preferred.
2.5. Rehabilitation task planning
This section maps the collected muscle activity information to the rehabilitation task planning by integrating recommended exercises. This provides the tasks to the customized robotic system designers.
2.5.1. Task identification
Task-oriented rehabilitation retrains human movements by providing standard physical tools in different spatial locations, allowing users to execute assigned activities. Moreover, the joint range-of-motion (ROM) and muscular flexibility must be sufficient to enable correct functional excursions of the muscles and bio-mechanical alignment [Reference Thompson and Morgan23, Reference O’Sullivan, Schmitz and Fulk24]. The research exclusively collects natural human motion data utilizing joint flexibility exercises (i.e. ROM exercises) to strengthen weak muscles. To establish the concept, the workouts assumes to be planar, and the focus is on elbows flexion/extension joint motion range. Figure 5(a) shows elbow flexion/extension joint motion range (sagittal plane) when the shoulder flexion angle is fixed at
 $0^{\;\circ }$
. A similar procedure can be implemented to other recommended exercises.
(a) Joint ROM exercise for muscular flexibility performing elbow flexion/extension when shoulder flexion angle is at
 $0^\circ$
(parallel to sagittal plane), Courtesy: Indian Spinal Injury Centre, New Delhi, India. (b) Experimental setup for human motion data collection.

2.5.2. Trajectory generations
To indicate the location and orientation of a robotic link about adjacent links, the Denavit–Hartenberg (D–H) convention is utilized. It is crucial to select a specific motion trajectory to plan a robot’s mobility by providing initial values for joint variables. The experimental setup, depicted in Fig. 5(b), is intended to collect natural human motion data to follow the therapeutically required motion trajectory. Here, task space locations (TSLs) are a set of coordinates that indicate the wrist positions of the participants. Trajectories are traced out to get realistic human motion trajectories corresponding to recommended rehabilitation exercises.
Both marker-based and marker-less data collection techniques for human mobility have been used in the past. The investigation has included simulations of dynamic movement, and neuromuscular coordination and physical performance have been examined. Additionally, simulators provide a scientific basis for therapy planning by identifying the source of abnormal activity. Towards this, the study has collected previously revealed participants’ natural human motion data sets, created utilizing scaled Open-Sim upper extremity musculoskeletal models. It aims that Open-Sim could simulate movement quickly and accurately. To begin with, the programme anticipates natural motion coordinate data by using motor control models, such as kinematic adaptations of human gestures at various phases. A tool named Robo-Analyzer is used to accelerate the kinematic model framework. It may also inspect each D–H parameter by selecting an individual joint and then the kind of D–H parameter. The appropriate D–H parameter is highlighted in the D–H parameters input table when a transformation frame is applied to the robot model.
Algorithm 2 shows the step-by-step procedure to obtain the subject-specific scaled musculoskeletal model. A large data set of joint coordinate trajectories is obtained using the simulations. The article does not provide a detailed analysis of the design of a trajectory-based rehabilitation device.

3. Results and discussion
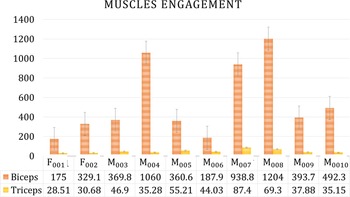
Muscle involvement has been widely studied to identify substantial influences on upper arm movement. Consequently, the sensor’s data have been analyzed. Figure 6 depicts all individuals’ sEMG sensors data for the biceps brachii and triceps brachii. As expected, the considered activity is best suited for biceps brachii, whereas triceps brachii necessitates a different action. As a result, the biceps brachii, regardless of human anatomy, has a considerably more significant influence on the outcome of the chosen activity.
A chart presenting a graphical depiction of the processed sEMG signal responses of the biceps brachii and triceps brachii muscles during elbow flexion/extension exercise for all ten participants.

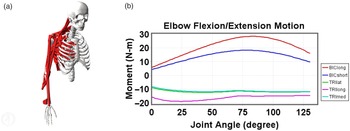
Open-Sim simulation software is utilized to verify the outcomes of the study, as shown in Fig. 7. Open-Sim musculoskeletal models support the findings. When the same exercise is conducted using Open-Sim software, the biceps brachii sEMG signals exert a more substantial influence than the other muscles. This reduces dimensionality by eliminating parameters with high dominance. Based upon this, dominant muscle analysis identifies critical, independent aspects that aid in developing a mathematical model with fewer parameters.
Open-Sim software validating results for dominant muscle identification by simulating musculoskeletal model: (a) posture of upper extremity musculoskeletal model and (b) muscles involvement during task completion.

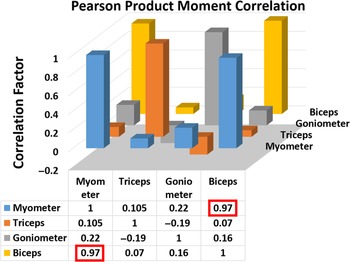
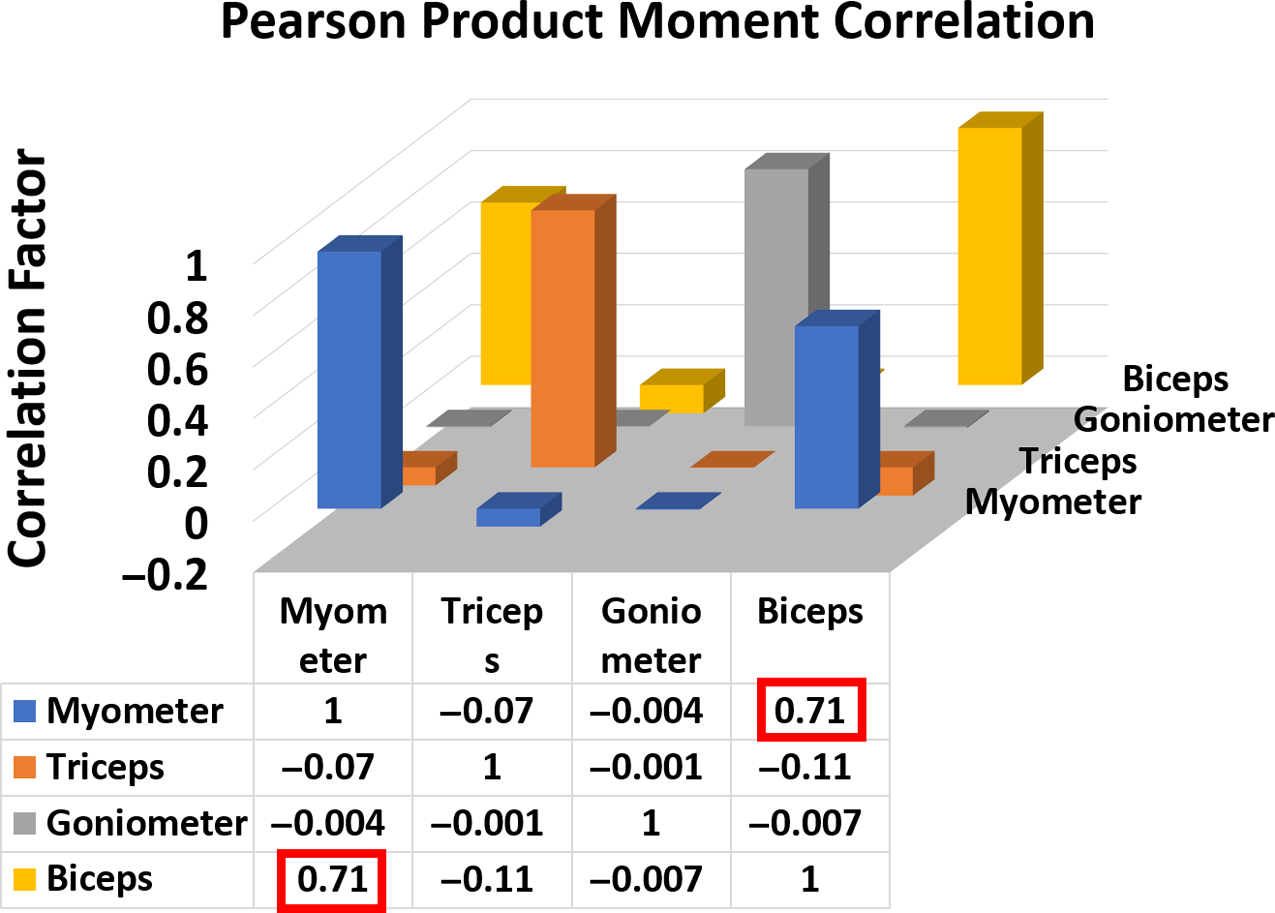
The correlation of sEMG signals collected from the biceps brachii and triceps brachii muscle groups is investigated to determine the importance of interdependent muscle responses. The only correlation between sEMG signals obtained from biceps brachii and contact force received from the MyoMeter sensor is more significant than 0.9 (highlighted with a red square), which is significantly greater than the others. In contrast, the pattern and diversity of contact force and muscle activation correlations appear to be subjective for different persons, and averaged values are used. Figure 8 depicts the overall data. In almost all instances, the correlation between biceps brachii and interaction forces is significant enough, which is preferable based on previous dominant muscle outcomes throughout the activity. This calculation can analyze a more robust and practical training and related rehabilitation progress.
Correlation factor for combined data (all 10 participants).

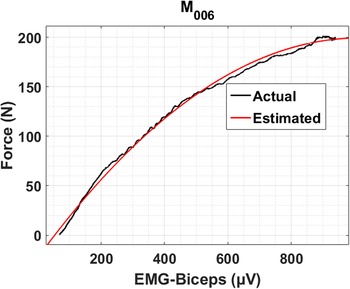
Following that, as described in Section 2.4, standard Fourier seriesFootnote 1 is obtained as a suitable mathematical model for determining the quantitative and statistical value of the biceps brachii’s muscular force. Figure 9 shows an example of a curve fitting match to the anticipated force to the actual force for an individual participant.
Curve fitting of the estimated force to the actual force in graphical form (one of the participant).

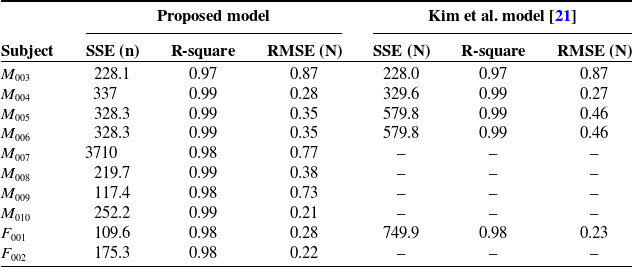
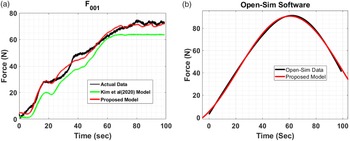
The comparative findings of the proposed model and Kim et al. [Reference Kim, Park, Lee and Kim21] model for all 10 participants while executing the prescribed work, that is the elbow flexion motion, are displayed in Table II. The SSE, RMSE, and R-square for the proposed model have all been shown to be acceptable. Figure 10(a) represents comparison of the proposed model to actual data, and Kim et al. [Reference Kim, Park, Lee and Kim21] model for one of the participant. The graph of the simulated model is found to be pretty close to the actual data. Additionally, the data from the Open-Sim musculoskeletal model are utilized to validate the proposed model, as seen in Fig. 10(b) where SSE
 $7.89\;{\rm N}$
, R-square
 $0.99$
, and RMSE
 $0.28\;{\rm N}$
are obtained. Hence, the proposed mathematical model based on the most influential muscle is demonstrated to be the best to predict the afflicted limb’s quantitative weakening value (force).
Comparative results of proposed model and kim et al. [Reference Kim, Park, Lee and Kim21] model for all 10 healthy participants in completing the assigned task, that is elbow flexion movement.

(a) Comparison of an individual participant’s actual data to Kim et al.’s model and proposed model data, (b) Comparison of proposed model to Open-Sim musculoskeletal model data.

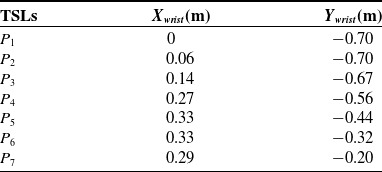
Through trajectory generation, a large data set of therapeutically desired natural human motion trajectory is gathered, and for the sake of simplicity, just a few numbers are displayed in Table III for one of the participant. Here, the modified joint coordinates are shown to be following the shoulder joint as the reference frame.
3.1. Case Study 1: patient of quadriplegia (less than 3 months): demonstration
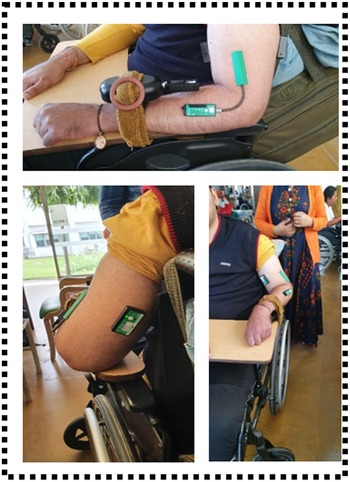
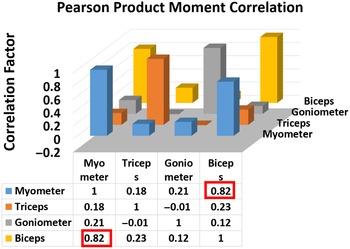
Medical and rehabilitation robots use human motion data to create various innovative recreational assistance devices that mimic the human body’s natural motion. When it comes to identifying muscular weakness-based task locations of therapeutically needed trajectory for each patient, the recommended technique will play a satisfying role. This case involves a 30-year-old man who has quadriplegia. Both of his upper limbs have shown limited elbow flexion movement during movement. The proposed algorithm’s framework is used to choose an experimental setting for evaluating weak muscle and tracking its recovery in a way that mimics the joint biological trajectory. Data have been collected from Spinal Injury Center, where the subject is a regular patient of Out-Patient Department (OPD). Disability is identified by sensors integration and data assessment. Figure 11 depicts the experimental setup, which consists of sensors integrated with human limb and can able to recognize muscle intervention and engagement, allowing for the mapping of weakness evaluation to task planning. Processed sensor data are utilized to determine Pearson product–moment correlation, and observed biceps brachii muscles have a higher correlation factor of
 $0.82$
for weaker limb and
 $0.88$
for weak limb. The Pearson product–moment correlation for the weaker limb is depicted in Fig. 12, with the higher correlation component highlighted in red.
Using Open-Sim software, transformed human motion data of the wrist with respect to the shoulder as a reference frame (one of the participants).

Case Study 1: Some clicks of sensors integration with Patient of Quadriplegia (injury less than 3 months), Courtesy: Indian Spinal Injury Center (ISIC).

Case Study 1: Illustration of Pearson Product Moment Correlation for the weaker limb.

The mathematical model is obtained with the measures SSE
 $328$
N, R-square
 $0.95$
, and RMSE
 $0.28$
N for weak limb and SSE
 $1572$
N, R-square
 $0.77$
and RMSE
 $6.46$
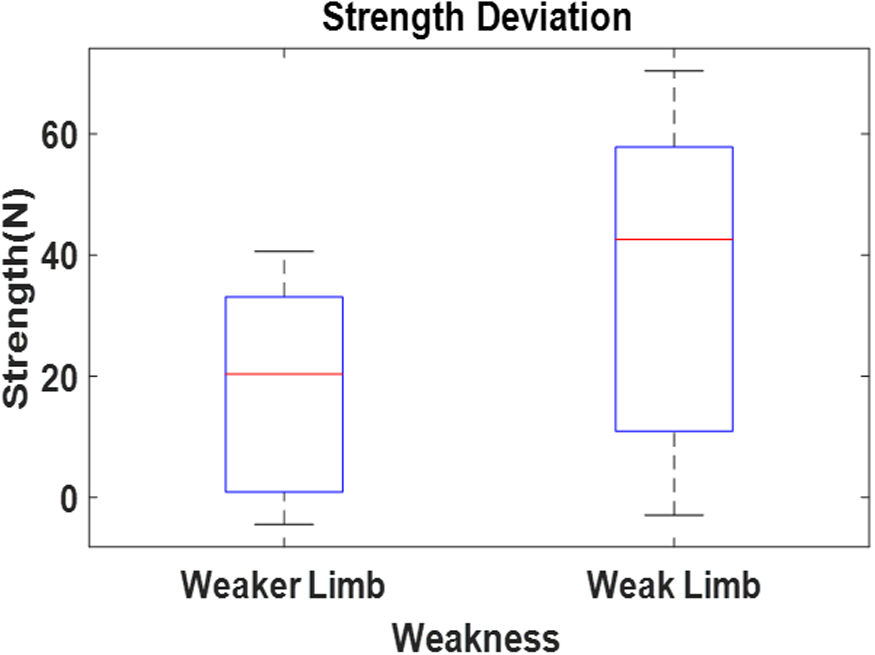
N for weaker limb. As demonstrated in Fig. 13, the model has estimated the quantitative weakening value of the affected limbs as nearly
 $40\;{\rm N}$
for weaker limb and
 $70\;{\rm N}$
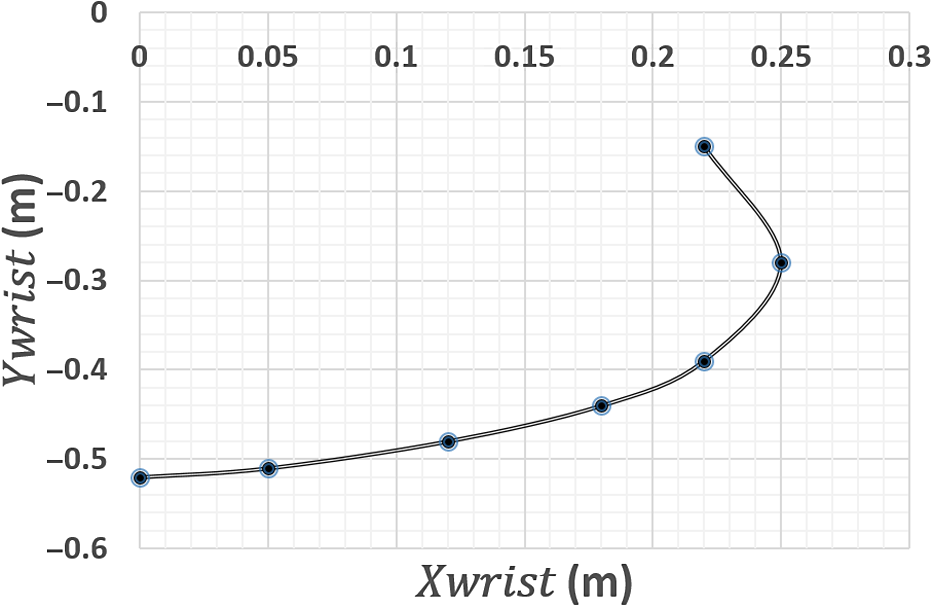
for weak limb. Motion data is collected via an Open-Sim scaled musculoskeletal model, which corresponds to anthropometric subject data and is obtained as displayed in Table IV. The corresponding clinically desired trajectory is shown in Fig. 14.
Case Study 1: Comparison of disability between both upper extremity.

3.2. Case Study 2: patient of hemiplegia (less than 3 month): trajectory-based robotic assistance
This case study briefs the methodology for utilizing the proposed framework in robot-assisted rehabilitation. Figure 15 showcases the connectivity chart where the weakness information is extracted in the first step by sensors integration with the human limb. The proposed quantitative measures, namely muscle intervention and muscle engagement, are used in the previous case. In the second step, the task is planned according to these outcomes of muscles intervention and the automatically recommended therapy. This task information, such as task type and task space locations’, is depicted in the third phase of Fig. 15. It is used to build a model that optimizes the dimensional parameters of a data-driven mechanism. The evolutionary algorithm is utilized to optimize the synthesis problem. The final step in Fig. 15 exposes the designer’s sorting criteria, such as kinematic performance index and reachability, to choose the best performing mechanism. The example concludes by demonstrating how the proposed algorithmic technique would give a general framework for task-based robotic-assisted dimensional synthesis from automated therapy selection and data collection.
Case Study 1: Collecting natural human motion data using a scaled Open-Sim musculoskeletal model that corresponds to the participant’s anthropometric data for the weaker limb.

Case Study 1: Graphical depiction of the therapeutically desirable natural human motion trajectory.

Steps being taken in the development of trajectory-oriented robotic assistance systems.

This case involves a 50-year-old female patient with hemiplegia. The patient has limited elbow flexibility in her right upper limb. Correlation coefficients are calculated to measure the present relationship strength between sensor data, indicating the action’s dependability for the targeted muscles. As demonstrated in Fig. 16, the significant relationship between the biceps brachii sEMG signals and the MyoMeter is less than 0.9 and higher than others. A better correlation between Biceps Brachhii and MyoMeter sensor indicates the accuracy of training attempts directed at the targeted muscle. The developed model provides a SSE
 $87.68$
N, R-square
 $0.99$
, and RMSE
 $0.16$
N. The model has estimated the quantitative weakness value of the affected limb is less than
 $5\;{\rm N}$
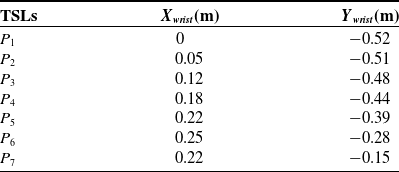
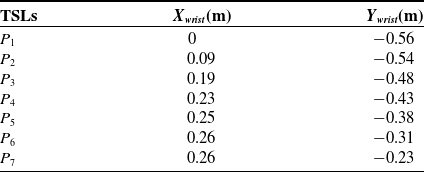
. Consequently, it is suggested to repeat the exercise to acquire the quantitative connection between biceps brachii motor functions similar to healthy ones. Therefore, the quantitative model for force prediction would aid healthcare in comparative analysis. Subject anthropometric data are utilized to create an Open-Sim scaled musculoskeletal model. The results of the data analysis of muscle weakness assessment to task planning, which turned the co-ordinate measurements of the shoulder and wrist position, with the shoulder as the local co-ordinate frame (reference frame). TSLs show the trajectory data points generated from the Open-Sim scaled musculoskeletal model. Table V represents the upper limb recommended trajectory.
Case Study 2: Illustration of Pearson Product Moment Correlation for the effected limb.

Case study 2 is expanded further to showcase the remaining two phases. This is achieved by determining the optimal dimensions for a four bar with a single bar configuration. The objective of the synthesis problem is to achieve a trajectory while optimizing kinematic performance and maintaining a high level of positional accuracy. The selection of configuration is not part of the paper. Jacobean conditioning index and reachability are being used to evaluate the best. The former ensures the mechanism’s kinematic performance at given places, while the latter provides the correctness of the end-positional point at defined trajectory points. The anthropometric data from the human upper-limb is being used to calculate link length variations and joint-angle ranges of the selected configuration. The multi-model problem is tackled using the GA, an evolutionary technique. For each candidate, link lengths (
 $L$
) and joint angles (
 $\theta$
) are utilized to derive the objective functions and constraints of the specified issue (solution).
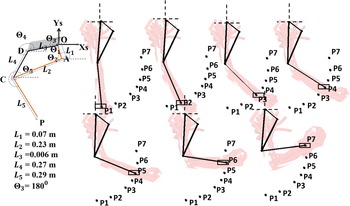
The obtained optimal link lengths for the four bar with a single-bar mechanism have been determined using dimensional synthesis as
 $L_1$
=
 $0.07$
m,
 $L_2$
=
 $0.23$
m,
 $L_3$
=
 $0.006$
m,
 $L_4$
=
 $0.27$
m, and
 $L_5$
=
 $0.29$
m. The base link has an angle of
 $\theta _3$
=
 $180^\circ$
. The reachability error is determined to be
 $0.001$
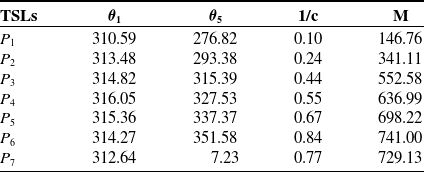
m, which falls within the tolerance level. As demonstrated in Fig. 17, the results for reachability at each TSL are provided for this four-bar structure connected with single bar. The conditioning index varies from
 $0.1$
to
 $0.84$
for the specified collection of TSLs. The best postures are observed from
 $P_3$
onwards. The contours are plotted for active angles
 $\theta _1$
from
 $0^\circ$
to
 $360^\circ$
and
 $\theta _5$
from
 $0^\circ$
to
 $360^\circ$
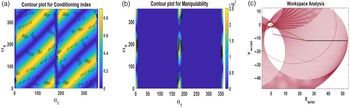
, respectively, as shown in Fig. 18(a). Corresponding manipulability plot is shown in Fig. 18(b) and workspace region is shown in Fig. 18(c). Table VI shows optimal synthesis findings for the configuration at all TSLs data points, together with active joint angles, conditioning index, and manipulability.
Case Study 2: Natural human motion data collection utilizing a scaled model of Open-Sim software that corresponded to the anthropometric data of the participant.

Case Study 2: Optimal synthesized results based upon clinical trajectory.

Case Study 2: Results of workspace computation and singularity analysis for selected four bar with single-bar configuration: (a) Contours for conditioning index, (b) Contours for manipulability, and (c) Workspace analysis.

Anthropometric subject data is being utilized to determine the amount of assistive torque required as the link weight is assumed to be negligible [Reference De Leva25]. As a percentage of total body weight, upper arm segment weight is
 $2.9$
% for women and
 $3.25$
% for men, while the lower arm segment weight is
 $1.57$
% for women and
 $1.87$
% for males [Reference Plagenhoef, Gaynor Evans and Abdelnour26]. The healthy limb’s gravitational factor is determined to be
 $25.11$
N to move the forearm in the sagittal plane, and the torque for the healthy upper limb during elbow flexion/extension is estimated to be
 $3.5$
Nm. In contrast, the torque for the afflicted (weak) limb is
 $0.68$
Nm. The exoskeleton would be designed to provide
 $2.82$
Nm of robotic assistance as a solution. Table VII takes into account the rated torque values required for both active actuators of the mechanism, which are determined to be between
 $4.56$
and
 $4.94$
Nm for actuator-1, that is almost constant, and
 $5.08$
to
 $8.29$
Nm for actuator-2. Here, a negative toque indicates clockwise rotation.
Case Study 2: Optimal synthesised results for the configurations for their corresponding active joint angles and conditioning index and manipulability at each TSLs data points.

Case Study 2: Torque requirement for elbow flexion/extension.

4. Conclusions
This paper proposed a methodology for quantifying the relationship between the metric for assessing muscle weakness and the therapeutically recommended exercise that serves as the task for the rehabilitation device. Measurable contact force and muscle correlation factors are chosen parameters for establishing a framework for detecting muscular nerve cell state and recommended appropriate limb trajectories. The study investigates a strong connection between biceps brachii sEMG signals and MyoMeter in healthy patients. The inter-correlation between biceps brachii and contact force is high enough to reduce them to a single representative variable. The Fourier curve-fitting method is used to estimate limb weakness quantitatively, and the corresponding exercise can be recommended. This targeted trajectory is extracted from a subject-specific scaled geometric Open-Sim musculoskeletal model and can be utilized for synthesizing customized robotic assistance. Two case studies are included to demonstrate how the algorithmic steps are implemented to map weakness to the task planning in the rehabilitation area.
Authors’ contributions
Sakshi Gupta designed and carried out the research and drafted the initial version of the manuscript. Anupam Agrawal and Ekta Singla reviewed and edited the manuscript.
Financial support
None.
Ethical considerations
None.
Conflicts of interest
None.