Introduction
Methane (CH4) is a powerful greenhouse gas (GHG) and globally enteric CH4 production in ruminant livestock is the single most important source of CH4 emission. Clearly, there is a need for more accurate emission inventory from this source. In accordance with Articles 4 and 12 of the United Nations Framework Convention on Climate Change (UNFCCC), countries submit national GHG inventories following the scientific guidance provided by the Intergovernmental Panel on Climate Change (IPCC). The IPCC has developed comprehensive guidelines for national GHG inventories and for livestock CH4 has suggested different levels (tiers) of estimations. A good practice method of estimation of emissions disaggregating both spatially and by sub-sources to the furthest extend possible and taking into consideration specific country characteristics has been advocated (IPCC, 2002).
Dairy water buffalo (Bubalus bubalis) farming is a traditional Italian enterprise, which has been conducted for centuries in the central-southern lowland swampy areas of the country. However, economic interest in this animal species, driven by the utilisation of its milk in the making of Mozzarella cheese, has lead to intensified farming practices and increase in population. In fact, according to the National Institute of Statistic (ISTAT, 2007) the Italian buffalo cow population has increased from 62 000 heads in 1990 to 137 000 heads in 2005.
In Italy, to date, only CH4 emissions from cattle have been estimated using country-specific emission factors, while for other livestock species the default emission factors (IPCC, 2000) are used.
This manuscript, following the Tier 2 method in accordance with the IPCC Good Practice Guidance and Uncertainty Management in National Greenhouse Gas Inventories (IPCC, 2000) and as requested by the UNFCCC (2006), describes the estimation of the country-specific enteric CH4 emission factor for the Italian Mediterranean buffalo and discusses the reliability of it. Furthermore, recommendations from the 2006 IPCC Guidelines for National Greenhouse Gas Inventories has been considered (IPCC, 2006).
Materials and methods
Models for estimating the methane emission factor
The IPCC (2006) guidelines have proposed three levels of approach (Tier 1, Tier 2 and Tier 3) for estimating enteric CH4 emissions from livestock. Tier 1 is a simplified initial estimation method and is recommended when enteric fermentation is not a ‘key category’ and the animal species is not significant in the country, whereas Tiers 2 and 3 are more advanced approaches requiring country-specific data and more detailed characterisation of livestock population and farming situations. Tier 3 applies when a country-specific methodology for enteric CH4 emission estimation has been developed. The present study followed the Tier 2 approach for estimating the enteric CH4 emission factor for the Italian Mediterranean buffalo. According to IPCC (2006), a good practice to estimate a CH4 emission factor involves: (a) collection of data that describe typical diet and performance and feeding conditions (diet quality) of the sub-categories of animal species in question, and (b) estimation of feed intake for each sub-category based on energy metabolism algorithms.
In this study, the annual statistical reports on the buffalo population produced by the ISTAT were the main source of information used for the emission factor estimation. Greco and Martino (2001) and Cóndor et al. (2005) have indicated that ISTAT statistical reports collate information both from specific agricultural surveys and from agricultural census (1990 and 2000). For convenience, the period 1990–2004 was chosen. In addition, close networking with staff of the Agriculture Service Section of ISTAT allowed the authors of this study to obtain relevant information on unpublished topics.
The ISTAT divides the buffalo population into two categories: buffalo cows and other buffaloes (0 to 3 years old). Unfortunately, the data concerning the latter category are presented in an aggregated way. Therefore, we have assumed a proportion of distribution of 1/3 for calves (<1 year old) and 2/3 for sub-adult buffaloes (1 to 3 years old).
Methane emission factor for buffalo cow
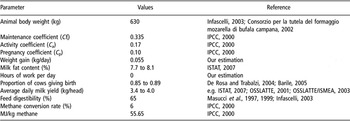
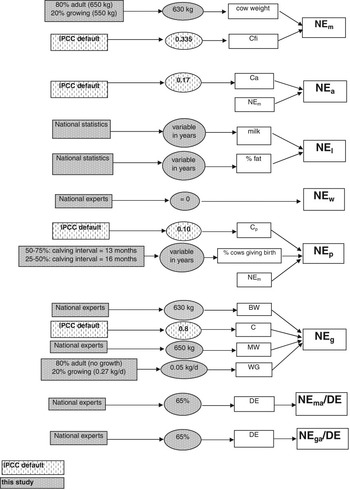
Methane is derived from feed energy and therefore the CH4 emission factor is considered proportional to the gross energy (GE) intake in feed (IPCC, 2000 and 2006). The GE intake is the amount of energy consumed by an animal in order to meet maintenance, activity, growth, lactation, pregnancy and other (e.g. thermoregulation) requirements. Equation (1) (see Annex I) shows the general equation and relationships to estimate GE intake by the buffalo cow, whereas Equation (2) (see Annex I) describes the formula for calculating the CH4 emission factor (EF). Table 1 shows the specific parameters used in the process of calculation of both GE intake (Equation (1)) and EF (Equation (2)) for the buffalo cow. In turn, Figure 1 presents a flow chart of the process of estimation.
It is obvious that GE intake and therefore EF by the buffalo cow depend on BW and milk yield. On the basis of expert judgement, we used a mean BW of 630 kg. This assumes that about 80% of the buffalo cow population constitutes mature animals weighing 650 kg and 20% of the cows are still growing with an average BW of 550 kg. The maintenance net energy requirement (NEm) was calculated by multiplying the maintenance energy required per unit of metabolic weight (i.e. Cfi) by the metabolic size. In this study, a value of 0.335 MJ for Cfi was used as suggested by IPCC (2000).
Calculation of enteric methane emission factor for buffalo cows

Flow chart used for the calculation of the gross energy intake by buffalo cows.

The net energy for activity (NEa) is the energy that the animal needs to obtain feed, water and shelter, and as such it is a function of NEm. IPCC (2000 and 2006) suggest that NEa may account for 17% and 36% of the NEm, depending on whether the cow is stall fed, pastured or grazing large areas. In this study we considered the relative proportion of grazing animals and stall-fed animals for calculating a country-specific NEa. Literature (e.g. Zicarelli, 2001) and expert consultation indicated that in the Caserta and Frosinone provinces, about 5% of the buffalo cow population is grazed; hence, a 3% grazing population has been estimated.
The net energy required for growth (NEg) was estimated as a function of the BW of the animal and the rate of weight gain. For this, it was assumed that mature animals have no net weight gain (Gibbs and Johnson, Reference Gibbs and Johnson1993; IPCC, 2006). However, for the buffalo cow category we estimated a weight gain of 0.06 kg/day under the assumption that 80% of buffalo cows are mature with no net weight gain, whereas 20% of them have a weight gain of 0.27 kg/day (i.e. an increase from 550 to 650 kg BW over a year).
The net energy for lactation (NEl) was calculated as a function of milk yield and the fat content (%) of milk. For this, the national average milk production was reconstructed based on the annual data reported by ISTAT and other national publications (OSSLATTE, 2001; OSSLATTE/ISMEA, 2003). When these national data were cross-checked with statistical databases of Food and Agricultural Organization (FAO, 2007) and Statistical Office of the European Commission (EUROSTAT, 2007), it was found that these international databases accounted for the collected milk only (85 to 92% of the total milk production). Hence, the total milk production (including collected milk, directly sold, direct consumed, fed to animals and transformed at farm) was calculated. Subsequently, the average daily milk production was calculated by dividing the total milk production by the number of animals and 365 days (IPCC, 2000 and 2006). We assumed that in Italy buffalo cows have no requirements of energy for work.
The net energy required for pregnancy (NEp) was calculated as a 10% of the NEm (IPCC, 2000 and 2006). When the NEp component of energy requirements was applied in the process of GE intake calculation, this component was weighted by the proportion of mature females that give birth in any year. Also, in this process, we took into account the changes in the reproductive management of the buffalo cow. In fact, during the last 20 years, farmers have introduced the ‘out of season’ mating with the aim to maximise the market opportunity of buffalo milk in the season of high demand for mozzarella production (Zicarelli, Reference Zicarelli1997; De Rosa and Trabalzi, Reference De Rosa and Trabalzi2004; Barile, Reference Barile2005). However, it has been reported (Zicarelli, Reference Zicarelli1997) that as a consequence of the out-of-season mating, the calving interval has increased from 12–13 months (natural calving season) to 15–16 months. For purposes of this study, we estimated that the number of farms using out-of-season mating has increased from 25% in 1990 to 50% in recent years.
Finally, to calculate the ratios of net energy for maintenance available in diet to digestible energy consumed (NEma/DE) and energy available for growth in diet to digestible energy consumed (NEga/DE) (IPCC, 2000 and 2006), data from digestion trials have been collected from the literature (Masucci et al., 1997 and 1999; Infascelli, 2003) and a single digestibility of energy of 65% was considered. The latter could be questioned because intensification in buffalo farming over the last 15 years likely resulted in changed feed digestibility and CH4 yields as the diet moved from forage-based diets to more concentrate ingredients. However, this is the best available information for estimations.
Once the GE intake by the buffalo cow was estimated, Equation (2) (see Annex I) was used to calculate the EF (kg CH4/head per year). For this, we adopted the IPCC (2000) suggestion that 6% of the GE intake is lost in CH4 energy.
Methane emission factor for other buffaloes
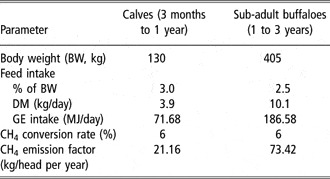
Parameters used to estimate the enteric CH4 emission factor for this buffalo category are shown in Table 2. Daily dry matter (DM) intake (kg/head) was calculated as a percentage of BW following the methodology described in APAT (2006), which was for non-dairy cattle. The other buffalo categories were subdivided into calves (3 to 12 months old) and sub-adult animals (1 to 3 years old). It was assumed that calves (40 kg birth BW) grow at 0.6/day during their first year (Cutrignelli et al., 2003); hence, a 130 kg average BW was estimated for this sub-category (calves). Similarly, for the sub-adult sub-category a 0.6 kg/day BW gain reaching 550 kg at the 3rd year of age was estimated, with an average BW of 405 kg for the sub-category. Dry matter intake by calves and sub-adult buffaloes were calculated as a proportion of their BW (3.0 and 2.5%, respectively), as suggested by Infascelli (2003). Then, the DM intakes were converted to GE intake (MJ/head) using the default conversion factor of 18.45 MJ/kg DM (IPCC, 2000 and 2006). The enteric CH4 emission factor for this buffalo category was calculated using Equation (2) as for the buffalo cows.
Estimation of enteric methane emission factors for other buffaloes

DM = dry matter; GE = gross energy.
Finally, the enteric CH4 emission factor for the Italian Mediterranean buffalo was calculated as a weighted average considering population percentage and specific emission factors for buffalo cows and other buffalo categories.
Results and discussion
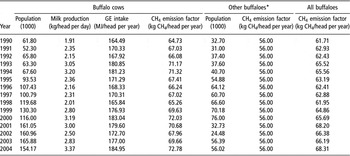
Table 3 presents the time series (1990–2004) for buffalo cow population and average values for milk yield, GE intake and enteric CH4 emission factor. In 2004, the mean daily milk yield and GE intake per cow were 3.4 kg and 185 MJ, respectively, with an enteric CH4 emission factor of 73 kg/head per year. As expected, the latter value was much lower than that estimated for dairy cows for the same year (111 kg CH4/head per year) (APAT, 2006) as dairy cows had much higher milk yield (16.8 kg/day) and therefore higher GE intake (283 MJ/day) than buffalo cows.
Population, production characteristics and estimated enteric methane emission factors for the Italian Mediterranean buffalo for the period 1990–2004

GE = gross energy.
*Other buffaloes include two sub-categories (calves and sub-adult buffaloes).
In the present study, the estimated annual average of milk production per buffalo cow for the year 2004 was 1897 kg (3.37 kg/head per day), this value being lower than that (2184 kg) reported by the Italian Animal Breeders Association (AIA, 2006) for the same year. Nevertheless, the average milk production reported by AIA (2006) applies only to elite herds on milk recording scheme (17% of the national population), whereas our estimates are for the entire national herd.
In this study the mean daily feed intake by buffalo cow, including both the lactation and non-lactation periods, was 10 kg DM (185 MJ). Bartocci et al. (Reference Bartocci, Tripaldi and Terramoccia2002) reported DM intakes of 10.1 and 16.8 kg/head for dry and lactating buffalo cows, respectively. However, the latter herd exhibited higher milk yield than the national average (2417 v. 1896 kg/year).
The GE intake for calves and sub-adults buffaloes was estimated to be 71.68 MJ/head per day and 186.58 MJ/head per day, respectively, and the CH4 emission factors were 21.16 kg CH4/head per year and 73.42 kg CH4/head per year, respectively (see Annex I, Equation (2)). In particular, we have considered that calves between 0 and 3 months do not emit CH4, as they are milk fed; therefore, we have applied a correction factor of 9/12 to the CH4 emission factor (28.21 kg CH4/head per year), which considered only the time between 3 months and 1 year. A weighted CH4 emission factor for the other buffalo categories has been estimated with emission factors from calves and sub-adult buffaloes and the number of animals. The CH4 emission factor for other buffaloes was estimated to be 56 kg CH4/head per year, corresponding to an average weight of 313 kg.
Methane emission factor for the buffalo category
In this study, a weighted enteric CH4 emission factor of 56 kg/head per year was estimated for the other buffalo category (Table 3). This value was considered to be constant throughout the period of study (1990–2004), which may not be entirely reliable as animals LW and feeding characteristics have likely increased over this period. Daily gross energy intakes of 71.7 and 186.6 MJ were estimated for calves and sub-adult sub-categories, respectively. These feed intakes resulted in enteric CH4 factors of 21.2 and 73.4 kg/head per year for calves and sub-adult buffaloes, respectively. The emission factor for calves (21.2 kg) assumes that 0 to 3-month-old calves do not emit CH4.
In this study, buffalo cows had an estimated mean enteric CH4 emission factor of 73 kg/head per year (year 2004), whereas the corresponding value for the other buffalo categories was a constant estimate of 56 kg/head per year, hence resulting in the estimated weighted value of the CH4 emission factor for the Italian Mediterranean buffalo of 68 kg/head per year (year 2004). The estimated CH4 emission factor for the other buffalo categories obtained in this study is comparable with the default value (55 kg/head per year) suggested by IPCC (2006) for animals with an average BW of 300 kg.
Assuming a CH4 yield of 7.5% of GE intake, Gibbs and Johnson (Reference Gibbs and Johnson1993) reported enteric CH4 emission factors of 54.9 to 77.1, 44.6 to 67.2 and 23.0 to 49.6 kg/year for adult male buffalo (350 to 550 kg BW), buffalo cow (250 to 450 kg BW) and young buffalo (100 to 300 kg BW), respectively. In turn, Crutzen et al. (Reference Crutzen, Aselmann and Seiler1986), by assuming a CH4 yield of 9% of GE intake by grazing buffaloes, reported a CH4 emission factor of 50 kg/year.
The enteric CH4 emission factor for buffalo based on research evidence is lacking. Hence, it is not possible to state how accurate the estimations of country-specific emission factors found in the present study are. Although our approach of considering constant BW and CH4 energy yield over the study period (1990–2004) for the buffalo categories (cows and other buffaloes) seems simplified, the CH4 emission factors for the recent years may prove reliable as recent data become more scrutinised and the default CH4 yield (% GEI) is well supported by research findings with cattle fed on mixed diets (IPCC, 2006).
Conclusions
This paper represents a first attempt to estimate a country-specific enteric CH4 emission factor for the Italian Mediterranean buffalo. Following, the Tier 2 approach of the IPCC (2000) guidelines, we have estimated emission factors for buffalo cows (73 kg CH4/head per year) and other buffalo (56 kg CH4/head per year) categories, which may be useful in preparing national emission inventories.
Specific research-based CH4 conversion factors at the predominant buffalo production system are needed in order to increase the accuracy of the emission factors.
Annex I Equations used for estimating the Gross Energy Intake for buffalo cow (IPCC, 2000)
Equation (1):

where
GE = gross energy intake (MJ/day)
NEm = net energy required by the animal for maintenance (MJ/day)
NEa = net energy for animal activity (MJ/day)
NEl = net energy for lactation (MJ/day)
NEw = net energy for work (MJ/day)
NEp = net energy required for pregnancy (MJ/day)
NEg = net energy needed for growth (MJ/day)
NEma/DE = ratio of net energy available in a diet for maintenance to digestible energy consumed
NEga/DE = ratio of net energy available for growth to digestible energy consumed
DE = digestible energy expressed as a percentage of gross energy.
Net energy required by the animal for maintenance (MJ/day):

Cfi = is the maintenance requirement per unit of metabolic size.
Net energy for animal activity (MJ/day):

C a= maintenance requirement for activity depending on the animal situation (grazing, stall, pasture).
Net energy needed for growth (MJ/day):

BW = the live body weight (BW) of the animal (kg)
C = a coefficient with a value of 0.8 for females, 1.0 for castrates and 1.2 for bulls
MW = the mature body weight of an adult animal (kg)
WG = the daily weight gain (kg/day).
Net energy for lactation (MJ/day):

Net energy required for pregnancy (MJ/day):

Net energy required for pregnancy (MJ/day):

C p= maintenance requirement for pregnancy based on the energy required for the gestation.
Ratio of net energy available in a diet for maintenance to digestible energy consumed:

Ratio of net energy available for growth in a diet digestible energy consumed:

Equation (2):

where
EF = CH4 emission factor (kg CH4/head per year)
Y m = CH4 conversion rate, which is the fraction of gross energy in feed converted to CH4 (CH4 yield).