Introduction
As advanced industrial economies emerged from the Great Recession and the ensuing sovereign debt crisis that afflicted a great number of countries in the Eurozone and beyond, the political economy of fiscal adjustment returned to the limelight of the scholarly community and popular discourse alike. Earlier episodes of fiscal adjustment in OECD countries, mostly occurring in the 1980s and early 1990s, had triggered a large body of research that sought to resolve a number of issues surrounding the political logic of austerity. One particular theme that widely resonates through these accounts is that fiscal adjustment inherently carries political risks for the main actors involved in the game. Pessimistic accounts on the political consequences of fiscal adjustment chime in well with a wide array of different literatures that implicitly share a common view on voters. Political budget cycle theory (See de Haan and Klomp for a recent review) posits that voters favor expansionary policies prompting governments to relax the purse before elections and consolidate afterwards, if necessary. Economic voting (see Lewis-Beck and Paldam, Reference McAdam, Tarrow and Tilly2000; Duch, Reference Eslava2007 for excellent reviews), in turn holds that voters’ main leverage over their elected governments is the ability to hold them accountable for the economic climate they create. If fiscal tightening dampens economic activity via its standard Keynesian channels,Footnote 1 economic voting promises little solace for governments that engage in balancing the books.
Theoretically, there are further reasons to expect fiscal adjustment to carry such electoral risks. One powerful reason has been provided by the scholarly literature on welfare states with its more narrow and fine-grained focus on the single largest item of government finances: social expenditure. Since Paul Pierson’s (Reference Rennwald and Evans1994) seminal work on our era of ‘permanent austerity’, the main theoretical premise of welfare state scholars has been an electorate that is closely wedded to the post-war welfare settlement. Both because of voters’ ideological and value-based attachments to major welfare programs (von Oorschot, Reference Weschle2000; Taylor-Gooby et al., Reference Vachudova2004; Larsen, Reference Lewis-Beck and Paldam2008) and because of the concentrated losses on large segments of welfare recipients that large fiscal adjustment efforts inevitably entail (Pierson, Reference Rennwald and Evans1994), retrenching the welfare state has been seen as an electoral minefield where only clever blame avoidance strategies can potentially prevail (Vis and Van Kersbergen, Reference von Oorschot2013).
Such scholarly consensus on the dire electoral repercussions of fiscal adjustment masks a more complex empirical reality, however. As my review of the relevant empirical literature will show below, governments have survived and occasionally benefited from adjustment policies. This article’s main contribution is a novel perspective on why this has been the case. In particular, I apply Albert Hirschman’s (Reference Illera and Mulas-Granados1970) loyalty, exit, and voice framework on a single issue-space where voters are distributed according to their fiscal preferences. Using this conceptual toolkit, I argue that the partisan color of governments is crucial to understanding the electoral consequences of austerity. Relying on the largest cross-national data set to my knowledge on political parties’ popularity ratings (96 parties in 21 OECD countries), I then empirically show that while center-right parties are in fact losing support in times of fiscal adjustment, no such empirical regularity is found for their center-left rivals.
The rest of this article proceeds as follows. Second section offers a brief review of the literature on the political economy of fiscal adjustment and presents the theoretical framework of this article. Third section discusses the data and variables that I use for this study. Fourth section outlines my empirical strategy and presents the main findings. Fifth section runs a number of robustness checks to probe the validity of the results. Sixth section concludes.
The (not so) unpopular nature of fiscal adjustment
Literature review
As a wave of fiscal adjustment efforts swept through advanced industrial economies in the 1980s and 1990s, scholarly interest in their political consequences gathered steam. The underlying premise at the time was the inherently unpopular nature of fiscal adjustment (Eslava, Reference Giavazzi and Pagano2011). As the number of politically successful fiscal adjustments increased (Alesina and Perotti, Reference Alesina, Ardagna and Trebbi1997), a more systematic empirical literature emerged that asked two different, but conceptually related questions. First, what factors are responsible for the political commitment that sustained debt reduction efforts require? Second, do governments get regularly punished for tight fiscal policies in general and fiscal adjustments in particular?
The first question prompted empirical studies to probe the determinants of the duration and persistence of fiscal adjustment efforts. Initiated by Alesina and Perotti’s (Reference Alesina, Ardagna and Trebbi1997) study, a series of contributions (Tavares, Reference Tilly and Tarrow2004; Illera and Mulas-Granados, Reference Katz and Mair2008) followed up to investigate the reasons for the rich empirical arsenal of sustained adjustment efforts. Beyond macroeconomic variables such as the size of the debt level (Mulas-Granados, Reference Page and Brody2006: 3), political variables such as government fragmentation (Illera and Mulas-Granados, Reference Katz and Mair2008) and the electoral timetable (Alesina et al., Reference Alesina and Perotti2006), the main line of argument largely converged around the notion of credibility. Since the main goal of fiscal adjustment is to signal commitment to financial markets, investors, and consumers, duration can be understood as a commitment device: ‘the success of a fiscal adjustment depends crucially on its credibility, i.e., how permanent the initial change in the deficit is perceived to be’ (Tavares, Reference Tilly and Tarrow2004: 249). Accordingly, Tavares (Reference Tilly and Tarrow2004) has shown that when left-wing governments cut expenditure and right-wing governments increase taxes – which presumably run contrary to their political preferences – adjustments tend to last longer. Moreover, Alesina et al. (Reference Alesina, Carloni and Lecce1998, Reference Alesina, Perotti and Tavares2011) and von Hagen et al. (Reference Weber2002) argue that for adjustments to be credible and hence durable, they have to concentrate on the expenditures that are ‘politically most sensitive such as transfers, subsidies and wage expenditures’ (von Hagen et al., Reference Weber2002: 513).
These episodes of sustained fiscal consolidation are all the more striking given the weak empirical evidence on their alleged beneficial impact on the economy in the short- and medium run [see Giavazzi and Pagano (Reference Giavazzi and Pagano1990) and Alesina et al. (Reference Alesina, Carloni and Lecce1998) on the (in)famous expansionary austerity thesis as well as Devries et al. (Reference Dewan and Shepsle2011) for a prominent critique]. In other words, if fiscal consolidation does not deliver any immediate economic benefits, the direct burden of austerity on society is politically compounded by the detrimental effects via retrospective economic voting. These considerations have led scholars to turn toward the second important question on the political economy of austerity: do governments get systematically punished by their electorates when they balance the books?
Empirical studies on the electoral consequences of fiscal adjustment, however, have failed to confirm the widely expected punishment effect. The landmark study of Alesina et al. (Reference Alesina, Carloni and Lecce1998) finds no negative effects of adjustment periods on various measures of government termination. Blochliger et al. (Reference Blochliger, Song and Sutherland2012) find in their sample of OECD countries that more than half of the governments that implemented adjustment were re-elected and some have continued their adjustment efforts thereafter. Alesina et al. (Reference Alesina, Perotti and Tavares2011) present similar findings and refute the very plausible objection on the grounds of reverse causality: perhaps, strong governments that have little to fear systematically initiate more adjustment episodes. By taking into account ‘government strength’ in their empirical models, the authors show that this is not the case. Studies using the overall fiscal stance, rather than fiscal adjustment periods only as the main independent variable [see Brender and Drazen (Reference Brender and Drazen2008) for a cross-country analysis as well as Brender (Reference Brender2003), Drazen and Eslava (Reference Duch2010), and Peltzman (Reference Pierson1992) for country-specific studies] arrive at similar results. Finally, when zooming in the arguably most politically charged items in the public budget, welfare expenditure, the electoral consequences appear likewise inconclusive at best (Armingeon and Giger, Reference Armingeon and Giger2008; Giger, Reference Giger and Nelson2012). In a nutshell, therefore, voters do not seem to reward expansionary policies nor do they seem to inflict systematic punishment on governments that engage in balancing the books even if these efforts involve social policy retrenchment.
With a few notable exceptions (Giger and Nelson, Reference Grittersova, Indridason, Gregory and Crespo2011; Schumacher et al., Reference Stegmaier and Lewis-Beck2013), a crucial variable that has received scant attention in the retrenchment literature is the partisan identity of government parties. We thus bring in the role of partisan government from a somewhat counterintuitive angle rooted in the notions of electoral credibility and issue ownership. This intuition has been put forward by Cukierman and Tommasi (Reference Cukierman and Tommasi1998) who formally model a policy-making context where credibility advantage on a given issue domain translates into a policy-position contrary to where the party traditionally stood. Such ‘Nixon-goes-to-China’ policy dynamics are echoed by the contributions of Levy (Reference Lewis-Beck and Nadeau1999), Ross (Reference Schumacher, Vis and van Kersbergen2000), and Kitschelt (Reference Korpi2001) who show that in contemporary welfare reforms, it was often progressive left-wing governments who found it electorally more palatable to cut popular programs.
This article contends that such ‘Nixon-in-China’ patterns of policy-making are key to bridge the gap between the inconsistencies and often contradictory empirical findings of different literatures highlighted by this brief review above. In particular, for a more fine-grained theorization of the micro-logic that guides electoral choice, I turn to Albert Hirschman’s exit, voice, and loyalty (EVL) framework.
Theory: EVL
Electoral choice, inspired by the Hotelling–Downs model on party competition in a two-party system (Downs, Reference Drazen and Eslava1957), is conventionally understood in spatial terms: voters choose parties whose platforms lie closest to voters’ ideal points in the relevant dimensions of party competition (see Dewan and Shepsle, Reference Dowding, John, Mergoupis and Van Vugt2011 for a comprehensive review). The problem with this approach beyond the questionable plausibility of some of the assumptions, such as rational and fully informed voters with single-peaked preferences, is that it restricts parties to mere instruments of policy offerings, turning a blind eye to their historical role of community building and social identity formation. A more holistic, and arguably realistic account of electoral choice thus moves beyond voter positioning as the sole driver of electoral choice.
Albert Hirschman’s (Reference Illera and Mulas-Granados1970) classic work on the behavior of the individuals facing a decline in product quality offers a promising alternative in this regard. In the simplest formulation of the Hirschmanian framework, a consumer dissatisfied with a product has three choices: (1) exit, that is, abandon the product for one that is perceived as superior; (2) signal her dissatisfaction to the producer by voicing discontent; (3) remain loyal and hope for change. In political settings, as Dowding et al.’s (Reference Downs2000) review on the relevant literature argues, these options are not always straightforward to interpret. In repressive regimes, for instance, voice can be interpreted as collective action in demonstrations as the vast body of literature on contentious politics documents (McAdam et al., Reference Mulas-Granados2001; Tilly and Tarrow, Reference van Biezen and Poguntke2015), or trying to change the regime from within by participating in its formal institutions, provided collection action problems are overcome (Olson, Reference Pardos-Prado1965). Exit, in turn, in its milder form could mean withdrawal from public life and in the extreme, emigration (‘voting with one’s feet’).
When restricting the analysis to the electoral arena, voters’ choices are considerably more limited, however. In a recent formulation of the EVL model, Weber (Reference Zaslove2011) argues that protest voting in second-order elections is a form of voice; the voter is not ready to abandon her preferred party, but signals discontent by choosing a different party in an electoral context that is perceived to be of secondary importance.Footnote 2 In contemporary parliamentary democracies, more direct forms of voice, however, are extremely hard to express. With the ‘cartelization’ of parties (Katz and Mair, Reference Kitschelt2009) and dwindling memberships (van Biezen and Poguntke, Reference Vis and Van Kersbergen2014), an individual’s access to decision-making in political parties is extremely limited. Electoral exit is comparatively straightforward. Voting abstention is one obvious form of exit. It can result from alienation whereby a voter feels that parties have too little to offer to make it worthwhile for her to vote, or indifference whereby her preferred policy is equidistant from the competing parties’ electoral platforms (Page and Brody, Reference Peltzman1972). Alternatively, a more radical form of exit from one’s preferred party is vote switching: a voter chooses a different party from the one she has traditionally (or most recently) voted for.
Finally, the concept of loyalty is crucial to understanding electoral stability over time. Dowding et al. (Reference Downs2000) conceptualizes loyalty as a value-based attachment to and identification with a group. In electoral terms, the importance of party identification was put forward as early as Campbell et al.’s (Reference Camia and Caramani1966) path-breaking work , which has later become known as the Michigan model.Footnote 3 Party identification serves as an important conceptual chain separating the preferences of an individual from her ultimate vote choice. In other words, for a party’s policy shift to change an individual’s party choice, it has to be large enough for the individual to be willing to pay the psychological ‘exit tax’ (Dowding et al., Reference Downs2000; Weber, Reference Zaslove2011) that a changing party identification involves.
Fiscal adjustment, the subject of this article, is a paradigmatic example of a policy shift on a single issue-space ranging from economic orthodoxy (right) to economic activism/interventionism (left) (see Cusack, Reference Cusack1999; Boix, Reference Boix2000 for two prominent formulations of partisan theory vis-à-vis fiscal preferences of parties). Importantly, parties are perceived to be located on certain points on the issue-space before the policy shift. Parties that tend to constitute governments in OECD countries range from center-left to center-right on this policy space. Center-left parties include social democratic and labor parties, whereas center-right parties belong to Christian Democratic, Liberal, and Conservative party families. Camia and Caramani (Reference Campbell, Converse, Miller and Stokes2012) have recently demonstrated that the latter three parties in western party systems occupy very similar positions on the economic dimension, clearly separating them from their social democratic counterparts. For the purposes of the fiscal adjustment debate, I thus consider them collectively as center-right parties.
Beyond these mainstream choices, most party systems offer voters a choice to vote for more extreme alternatives. Extreme-left and green parties tend to occupy a position left of the mainstream governing alternatives, whereas radical right parties often mix economic nationalism, welfare chauvinism and neo-liberal ideas in their rhetoric (Kriesi et al., Reference Levy2006; Rennwald and Evans, Reference Ross2014) making their left-right position on the economic domain harder to identify. What unites these ‘new right’ parties, however, is a frequent display of economic populism (Zaslove, Reference Devries, Guajardo, Leigh and Pescatori2008) and extreme positions on a number of non-economic issues, such as EU membership (Halikiopoulou et al., Reference Hellwig and Samuels2012), and immigration. Moreover, both extreme-left and extreme-right parties tend to be perennial opposition parties with little governing experience.
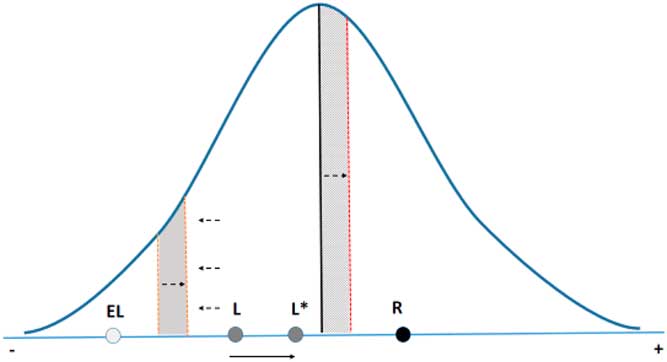
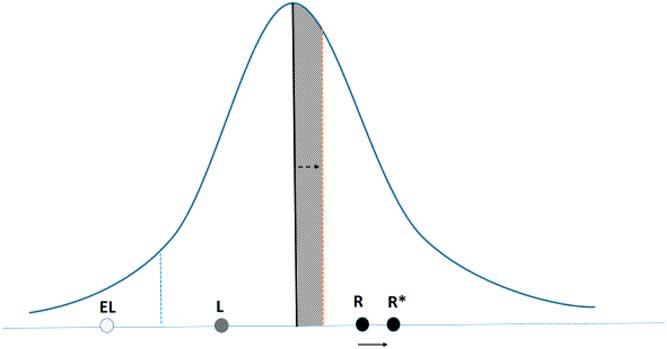
To anticipate the electoral fate of different party types upon fiscal adjustment, it is crucial to keep in mind their relative position on the one-dimensional policy space. Figures 1 and 2 offer such a stylized depiction of a one-dimensional policy space, lining up parties with preferences for looser (left) to tighter (right) fiscal policies on the x-axis and the preference distribution of voters on the y-axis. For the initial discussion, it is helpful to simplify the analysis to two mainstream parties (left and right labeled ‘L’ and ‘R’, respectively) and one party with extreme-left fiscal preferences, labeled ‘EL’. Since most parties belonging to the extreme-left and green party families all satisfy this criterion and many of the radical right-wing parties tend to be vocal critics of fiscal adjustment programs, this stylized illustration is a plausible reference point for the analysis to follow. I also assume that the electorates’ fiscal preferences are single-peaked and normally distributed: the electorate’s density distribution peaks at the middle of the policy space. In other words, most voters are centrist and only a relatively small subset of the electorate holds extreme preferences for extremely tight and loose fiscal policy.Footnote 4
Electoral consequences of fiscal adjustment by the center-left. L* denotes the new location of L.

Electoral consequences of fiscal adjustment by the center-right. R* denotes the new location of R.

The following analysis incorporates the EVL framework in the logic of spatial votingFootnote 5 in the context of economic policy: voters vote for parties that are closest to their ideal points in terms of their fiscal preferences with some important caveats elaborated below.
Figure 1 captures the electoral consequences of fiscal adjustment undertaken by the left. Implementing a policy contrary to its (and its constituents’) fiscal preferences amounts to a relatively large right-ward shift on the policy space, indicated by a move toward L*. This has potentially important consequences for left-wing voters. On the one hand, the left is vulnerable to losing support toward the left-end of its electoral coalition as either existing left-libertarian rivals or new entrants opposing fiscal austerity mount an electoral challenge (Kitschelt, Reference Kittel and Winner1994: 4). Following the EVL logic, lacking effective voice strategiesFootnote 6 to implement policy change these voters could exit via abstention or via voting for a more extreme-left-wing alternative.
However, a number of considerations suggest that mass exit is likely to be limited. Most importantly, a large part of voters remain loyal despite the austerity shock because they find the ‘exit tax’ discussed above prohibitively expensive. Those sufficiently alienated by the adjustment policy to desert the party find voting for the extreme-left alternative difficult. First, they may perceive these extremes to hold views on non-economic issues contrary to their own (the position taken on the post-material left-libertarian/right-authoritarian axis being a prominent case in point (Inglehart, Reference Kitschelt1977; Benoit and Laver, Reference Benoit and Laver2006; Kriesi et al., Reference Levy2006). Second, extreme parties’ lack of governing experience and mainstream parties’ regular efforts to portray them as lacking competence to manage the economy in challenging times may increase the ‘exit tax’ in the psyche of voters (Grittersova et al., Reference Haan and Klomp2016).
Third, although new political entrepreneurs could potentially enter the left-side of the issue-space, they will be constrained to do so by a number of institutional and historical factors: electoral thresholds, lack of access to public finance and media, and generally speaking, limited brand recognition and awareness by the public at large.
Therefore, the aforementioned forces – indicated by the dashed arrows pointing leftwards – limit the electoral space that the left loses to its more extreme rivals. Admittedly, electoral exit can also occur via abstention rather than vote switching (Weschle, Reference Zohlnhöfer2014; Dassonneville et al., Reference Dassonneville, Blais and Dejaghere2015). However, in simple numerical terms, when a group of voters deserts their party in order to abstain, it implies a more limited dent in the party’s electoral support (relative to its rivals) compared to vote switching.
Moreover, electoral losses among its anti-austerity constituencies can be counterbalanced by new voters entering the left-wing coalition. Voters around the center of the issue-space, in particular, may find the left-wing party more appealing once they demonstrate the political resolve to implement economies policies that they perceive as ‘sound and responsible’. Once the left converges to the middle of the issue-space by the implementation of fiscal adjustment, some of these centrist voters may therefore switch sides. Although such switching will also be limited by loyalty considerations on the right, the other sources of electoral stability discussed above play no major role. To the extent that the electorate’s density distribution is fundamentally centrist, such electoral gains could even result in net gains for the left-wing electoral coalition despite the losses they suffer on the margins.
Turning to Figure 2 depicting a fiscal adjustment undertaken by the right, the expected electoral consequences are fundamentally different. Since the right is perceived to have a greater attachment to economic orthodoxy than the left, the fiscal adjustment results in a smaller shift to the right on the economic issue-space. Crucially, however, this shift takes place away from the center of the space – indicated by the dashed arrow pointing right-wards – leaving an important segment of the centrist bloc up for grabs for the left. Again, although electoral exit will be limited by loyalty considerations, the reasoning provided before still holds: disaffected centrist voters willing to pay the ‘exit tax’ now have a convenient alternative to turn to: the mainstream-left with a credible anti-austerity agenda. Moreover, unlike the left capitalizing on its ability to sway voters at the center when implementing adjustment, the right is unable to mitigate its losses by searching for new voters at the right tail of the voter distribution. On the economic domain, mainstream right parties are unlikely to capture new voters, since it had few rivals with a more orthodox economic platform to begin with.
The right’s electoral difficulties are further compounded by the nature of many multi-party systems in the democratic world. Whereas the left shares the left space of the economic domain with rivals widely perceived to be inexperienced and extreme (see discussion above), the right side of the issue-space is often divided up by multiple parties belonging to center-right party families. Whenever at least one of these is in opposition during fiscal adjustment implemented by the right, disaffected voters have further alternatives to turn to at low exit costs.
Beyond these considerations, arguably the most important differentiating factor between the center-left and center-right is their strategic flexibility to undertake blame avoidance strategies and change their platform while they are in government and opposition, respectively. As documented by the blame avoidance literature (Zohlnhöfer, Reference Hayo and Neumeier2007, but see also Levy, Reference Lewis-Beck and Nadeau1999; Ross, Reference Schumacher, Vis and van Kersbergen2000), while left-wing parties can often successfully resort to ‘TINA (There Is No Alternative)’ strategies and diffuse pain for painful policies, such as social policy retrenchment, the right faces a tighter credibility constraint when attempting to sell the very same policies on the grounds of external pressure rather than ideological motivation.Footnote 7 As a recent example, in the externally imposed austerity programmes of the sovereign debt crisis in the Eurozone periphery of 2010–13, the involvement of the Troika served as a convenient object of blame avoidance; yet the ruling center-right parties in the afflicted countries (New Democracy in Greece, FG in Ireland, and Partido Social Democrata in Portugal) all lost from their previous vote shares in the subsequent elections in 2015, 2016, and 2015, respectively. Only the Irish ruling party managed to stay in power, arguably due to the economy’s relatively rapid recovery.
As a flip-side of this argument, the left is in a superior position to oppose fiscal adjustment when in opposition. For a credible attack on austerity policies, it can simply rely on its existing platform and argue against fiscal adjustment while remaining consistent with its default policy position. For the right, on the other hand, opposition to fiscal adjustment implies policy moderation and a strategic change in its position on the electoral map. In contrast to opportunities to criticize governments on issues that the right owns, such as crime (Seeberg, Reference Stix2013) or immigration (Pardos-Prado, Reference Pardos-Prado2015), policy moderation in economic policy is an electorally more difficult endeavor as empirically shown by the party competition literature (Adams and Somer-Topcu, Reference Adams and Somer-Topcu2009; Bouteca and Devos, Reference Bouteca and Devos2016).
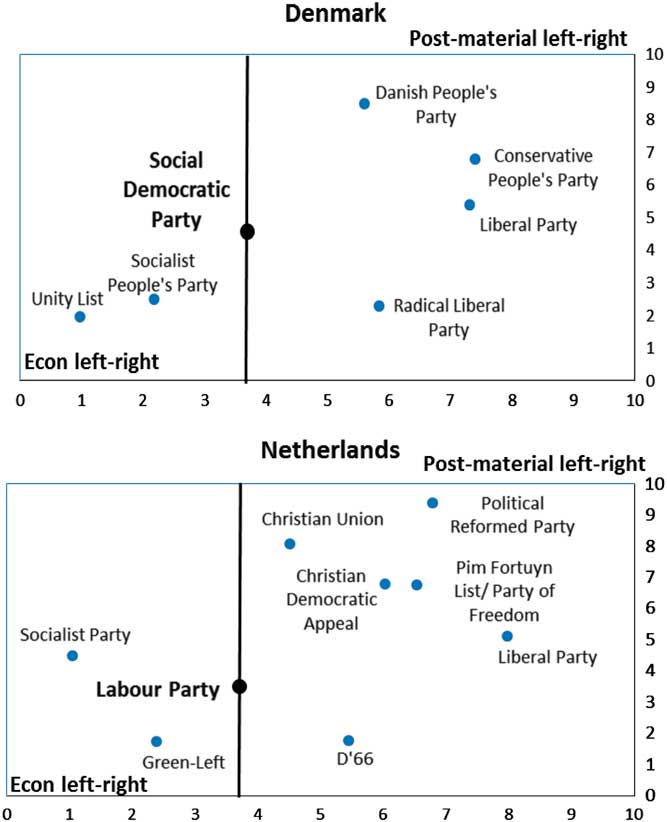
Some of these abstract and general considerations are illustrated below by two multi-party systems in Europe: Denmark and the Netherlands. I placed parties based on Chapel Hill expert surveys (Bakker et al., Reference Bakker, Edwards, Hooghe, Jolly, Koedam, Kostalka, Marks, Polk, Rovny, Schumacher, Steenbergen, Vachudova and Zilovic2015) on two salient dimensions: the economic domain under discussion (x-axis) and the cultural cleavage (y-axis) consisting of such post-material issues as immigration, multiculturalism, and gender roles, among others. Party positions are numerical averages across five waves of surveys conducted in the two countries on the respective dimensions. On both dimensions, lower scores correspond to more left-wing/libertarian positions (Figure 3).
The position of Danish and Dutch political parties on a two-dimensional policy space.

The positions of the seven major Danish political parties illustrate reasonably well the preceding discussion. The Danish center-left represented by the Social Democrats (SD) has two competitors on the economic-left: the Socialist People’s Party (SF), and the Unity List (EL). To the extent that vote losses to these left-wing competitors are contained by the considerations above, the SD, when in government, can implement austerity relatively safely by moving to the center of the issue-space in the process. This policy, however, seems considerably riskier for the three center-right parties in Denmark: the Radical Liberals (RV), the Liberals (V), and the Conservative People’s Party (KF). By moving to the right, not only do they leave open the center of the policy space to the center-left, they may also lose votes to their center-right rivals as well as to the populist right (DF), due to their proximity on the economic or the post-material dimension (or both).
Similar considerations apply to the main center-left party in the Netherlands, the Dutch Labor Party (PVDA). As in Denmark, it has two competitors on the (far)-left, the green-left (GL), and the Socialist Party (SP), both of which face significant headwinds in stealing voters from PVDA for reasons elaborated above. The PVDA, by contrast, has plenty of opportunities to gain new voters in the crowded center (and by the same logic, its main center-right rivals have plenty of voters to lose when moving further to the right).
These tentative illustrations of two country cases thus suggest that fiscal adjustment undertaken by the right, is electorally riskier than that undertaken by the left. The first formal hypothesis that I will test in the empirical sections below can thus be formulated as follows:
Hypothesis 1 The center-left in government is electorally immune to fiscal adjustment; center-right governing parties, by contrast, are electorally vulnerable to a significant amount of vote loss during fiscal adjustment episodes.
Having tested the main hypothesis, I proceed to investigate whether the party-political dynamics referring to opposition parties postulated above are in fact borne out by the data. In particular, I test whether the electoral advantage of the left indeed results from the limited exodus of voters to extremes on the one hand, and potential gains in the center, on the other. As a corollary to the first hypothesis, therefore, the second hypothesis speaks to the electoral fate of opposition parties when the leading government party responsible for an adjustment-episode belongs to center-left party families.
Hypothesis 2 Fiscal adjustment undertaken by the center-left results in no electoral rewards for extreme opposition parties and weakens the electoral support of the center-right opposition.
Data and measurement: operationalizing electoral strength, fiscal adjustment, and partisanship
Though the main argument of the article derives from a set of micro-level considerations outlined above, it is ultimately a macro-phenomenon on the party system level that we are attempting to explain. Therefore, I opted to conduct the empirical analysis on the aggregate level. If our theoretical expectations are to be confirmed empirically, the aggregated impact of individual-level vote switching and turnout decisions should show up in the changing electoral strength of political parties. Contrary to some of the economic voting literature that uses election outcomes (Powell and Whitten, Reference Rodrik1993; Hellwig and Samuels, Reference Hirschman2007) as the dependent variable, I focused on the popularity aspect of the so-called Vote-Popularity Function (Lewis-Beck and Paldam, Reference McAdam, Tarrow and Tilly2000, but see Bellucci and Lewis-Beck, Reference Bellucci and Lewis-Beck2011; Stegmaier and Lewis-Beck, Reference Tavares2011 for other applications). This choice allowed me to trace the evolution of electoral strength in a continuous fashion at equal intervals, increasing the number of observations in the analysis. This is especially important when one is interested in the electoral impact of political events that are temporally distributed in a non-random fashion vis-à-vis the electoral cycle. There are serious grounds to suspect, that in our case, this is a valid concern, as empirically verified by the political budget cycle literature (Haan and Klomp, Reference Halikiopoulou, Nanou and Vasilopoulou2013) on the one hand and related findings in the fiscal adjustment debate on the other (Alesina et al., Reference Alesina and Perotti2006).
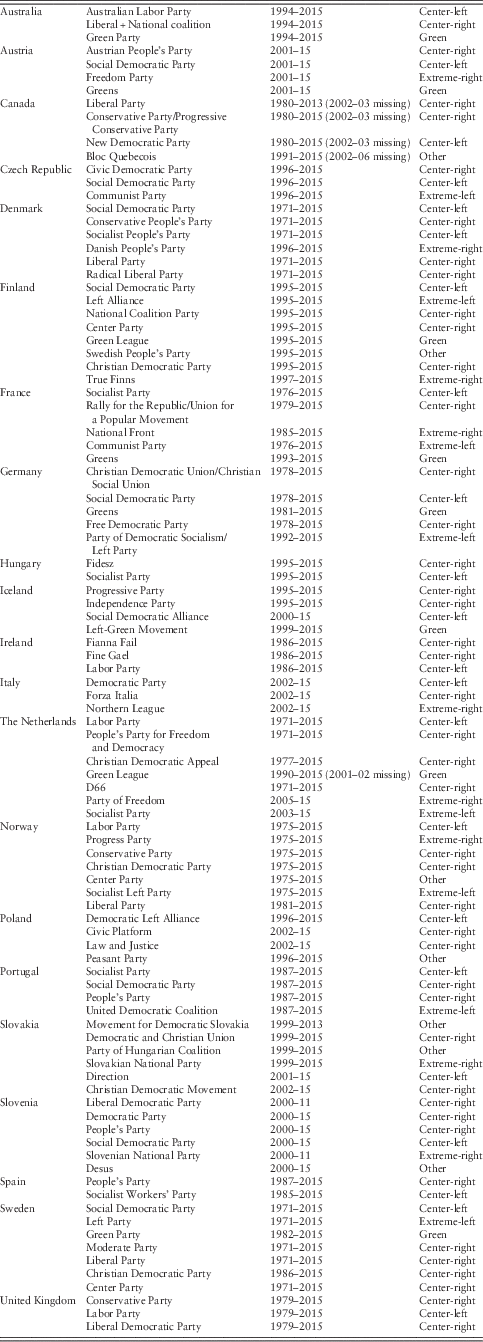
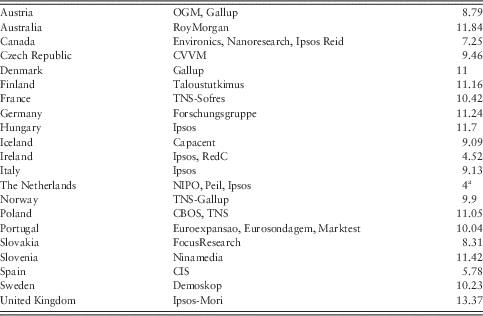
The vote intention panel structure that my choice fell upon is thus constructed as follows. I collected polling data from publicly available sources and consulted polling agencies – see Table A2 in the Appendix for details – for additional material when necessary. Overall, I was able to build a vote intention data setFootnote 8 consisting of 96 political parties nested in 21 parliamentary democracies. The overall country sample is largely based on data availability, though I made sure that it is sufficiently heterogeneous (old vs. new democracies, European vs. non-European democracies, effective number of parties, different electoral systems,Footnote 9 etc.) so that it represents a broader universe of parliamentary democracies. I included parties only with sizeable support (2+ % of respondents) and constant parliamentary representation throughout an extended part of the study period (1970–2015). Further details of the sample characteristics are in Table A1 in the Appendix.
Although the vote intention indicator is typically measured on a monthly (in a few cases quarterly) basis, using annual units in the empirical analysis is preferable as fiscal adjustment is measured on an annual basis. I thus took a numerical average of all the monthly/quarterly measures for a given year and used that as the dependent variable for the analysis. Moreover, to ward off concerns about selection bias identified by the literature (Alesina et al., Reference Alesina, Perotti and Tavares2011) emanating from the fact that strong/popular governments may be more likely to undertake adjustment, I used the first difference of the vote intention variable. Governments may systematically undertake fiscal adjustment only when their popularity is above their country-specific mean, leading one to erroneously find a positive relationship between adjustment periods and popularity. Estimating annual changes are less likely to be tainted by this source of self-selection bias as governments are unable to time fiscal adjustment according to the vote loss/gains these adjustments may entail which is a priori unknown.
Operationalizing adjustment episodes, the main explanatory variable of the study, also poses a number of difficulties. Following Alesina et al.’s (Reference Alesina, Carloni and Lecce1998) landmark paper on the political economy of fiscal adjustment, a lively debate has ensued on the merits of the authors’ coding scheme. They define years of fiscal adjustment when the cyclically adjusted primary balance improves by at least 1.5% of (potential) GDP (Alesina et al., Reference Alesina, Carloni and Lecce1998: 201). The most prominent criticism of this measurement strategy can be traced to the seminal contribution of Devries et al. (Reference Dewan and Shepsle2011) who argue that cyclical adjustment is a highly imperfect measure that fails to take into account such windfall revenues as property taxes during a housing boom. Therefore, the authors propose to shift the focus from fiscal outcomes to the underlying policy change (budgetary acts) to define adjustment episodes.
Despite the merits of these arguments, I am uneasy about using their data set for the purposes of this article. First, the adjustment years that the authors focus on pay little attention to implementation; it is not all that clear whether adjustment budgets voted upon in parliament actually resulted in the intended fiscal changes. Second, their data set is limited both temporally and geographically, significantly reducing our empirical leverage (by the exclusion of Eastern European countries for instance). Third, to the extent that those windfall revenues that the authors identify are positively correlated with the business cycle (Barrios and Rizza, Reference Barrios and Rizza2010: 11), cyclical adjustment at least partly corrects for the temporary nature of those revenue items. For these reasons, this article follows the outcome-based approach and uses the 1.5% benchmark as the starting point. In our robustness checks, acknowledging the arbitrary nature of the threshold, we modify the threshold to see if the results are robust to a broader definition of adjustment years.Footnote 10
Regarding the conditioning impact of partisan politics to measure the impact of austerity on government popularity, I follow the conventional logic of the power-resource theory (Korpi, Reference Larsen2006), according to which party families reflect long-standing ideologies and allegiance to different socioeconomic groups that largely determine the macroeconomic policies that different parties pursue when in government (Hibbs, Reference Hix and Marsh1977; Cusack, Reference Cusack2001). In this vein, the partisan variable identifies (center)-left parties that belong to the Social Democratic party family and (center)-right parties that belong to Christian Democratic, Conservative and Liberal party families.Footnote 11 Parties belonging to agrarian, green, extreme-right, extreme-left and other (e.g. regional or ethnic parties) were coded separately. To validate this coding scheme, I checked all parties’ location on the left-right scale as coded by country experts from the Chapel Hill surveys (Bakker et al., Reference Bakker, Edwards, Hooghe, Jolly, Koedam, Kostalka, Marks, Polk, Rovny, Schumacher, Steenbergen, Vachudova and Zilovic2015) and Benoit and Laver’s (Reference Benoit and Laver2006) expert surveys. The scores reveal that parties coded center-left tend to cluster together (mean=3.45, std. dev.=0.46) and parties belonging to the three center-right families also display a similar clustering, albeit with a somewhat larger dispersion around the mean (mean=6.58, std. dev.=1.09).
Finally, it is important to control for a number of variables that may correlate with our key independent variables of interest possibly biasing the estimates. First, following the economic voting literature, I control for GDP growth, unemployment rate (both changes and levels), and inflation (both changes and levels) to filter out the electoral effect of adjustment which occurs through its immediate economic impact. While GDP growth is theoretically speaking a change variable itself, it is a priori less clear whether voters prioritize changes or levels of unemployment and inflation when attributing responsibility. For these two variables, therefore, I follow a ‘let the data speak’ approach and include both levels and changes in the models.
Estimation, model set-up, and results
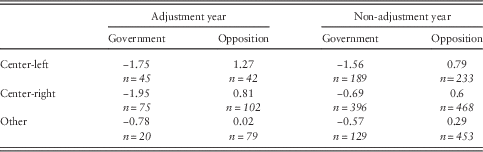
As a first step in the empirical investigation, it is helpful to provide a broad descriptive summary of the dependent variable (annual change in vote intention) in different fiscal periods (adjustment vs. non-adjustment years) for different party types (center-left vs. center-right). As Table 1 demonstrates, the impact of fiscal adjustment year indeed seems considerably greater for center-right parties. Whereas the average change in vote intention for governing center-left parties are roughly identical across the two types of fiscal periods (−1.75% vs. −1.56%), governing center-right parties lose a significantly greater share of their supporters (−1.95%) in years of fiscal adjustment compared to other periods (−0.69%).
Mean change in popularity of political partiesFootnote a (% of vote intentions)

a Number of party-years in italic.
To add empirical rigor to these descriptive patterns, it is of course important to estimate the impact of adjustment years in an econometric framework. I thus estimate two sets of cross-section–time-series models, for center-left and center-right parties, respectively, of the following general form:
 $$\Delta VI_{{{\rm pt}}} \,{\equals}\,\beta _{0} {\plus}\beta _{i} \left( {A{\times}G} \right){\plus}\beta _{j} \left( {C\,{\times}G} \right){\plus}\alpha _{{p{\plus}}} \mu _{t} {\plus}{\varepsilon}_{{{\rm pt}}} ,$$
where ΔVI pt is the annual change in the vote intention share of party p at time t, β 0 a regression intercept, β i a vector of coefficients that estimate the interaction effect between the fiscal adjustment dummy (A) a dummy variable for government status (G)Footnote 12 as well as its constituent terms, β j a vector of coefficients estimating the interaction effect between the government status dummy (G) and a set of control variables (C) as well as its constituent terms, α p+ μ t are p−1 and t−1 party-, and time-dummies, respectively, and ε the error term.
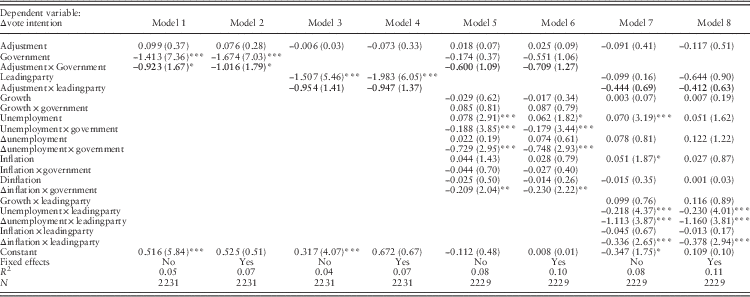
Because the data structure (temporally sequential observations clustered in parties that are in turn clustered in countries) is likely to violate the independent and identically distributed assumption of the errors, pooled ordinary least square (OLS) regressions are likely to introduce bias in the estimates and/or in their standard errors (Beck and Katz, Reference Beck and Katz1995; Kittel and Winner, Reference Kriesi, Grande, Lachat, Dolezal, Bornschier and Frey2005). Serial correlation, a common concern in time-series–cross-section designs is a relatively minor problem for us because of the first-difference specification of the dependent variable. There is no theoretical reason to expect changes in popularity in year t to be systematically correlated with the change in year t+1. That said, as a part of the robustness checks, I present Prais–Winsten panel regressions to address possible autocorrelation issues. Panel heteroskedasticity and cross-sectional dependence on the other hand, are more serious concernsFootnote 13 as evidenced by a series of statistical tests. I thus proceeded to follow the ‘Beck and Katz standard’ (Beck and Katz, Reference Beck and Katz1995; Beck, Reference Beck2001) and ran OLS regressions with panel-corrected standard errors both with and without (party-specific) fixed effects.Footnote 14 The first set of baseline empirical models – results shown in Table 2 – are presented as follows. All models are estimated for the entire sample of parties regardless of their partisan orientation. Models 1 and 2 (with and without fixed effects, respectively) only include the fiscal adjustment dummy in interaction with the government dummy (value 1 when the party is in government, 0 otherwise). Models 3 and 4 do the same but instead of the previous government dummy, it is now a dummy for leading parties (senior parties in coalition governments) only. Models 5–8 proceed with the same logic but add the macroeconomic controls (GDP growth, levels, and changes in unemployment and inflation) to the specification.
Regression output table from baseline modelsFootnote a

*P<0.1, **P<0.05, ***P<0.01.
a Ordinary least square regressions with panel-corrected standard errors.
Bold values indicate estimate is not significant.
The results from Table 2 reveal a relatively simple story. While the state of the economy clearly carries electoral risks for incumbents – government parties are punished for high levels of unemployment, rising unemployment and rising inflation – there is no comparable evidence for fiscal consolidation episodes: although the estimated impact of an adjustment year on popularity change is negative in all models, the interaction term between the adjustment dummy and the government status dummy is only marginally significant in Models 1 and 2 and non-significant for all subsequent models. In particular, when the economic controls are added to the specification (Models 5–8), the interaction term is substantially smaller and very far from significance at conventional levels.
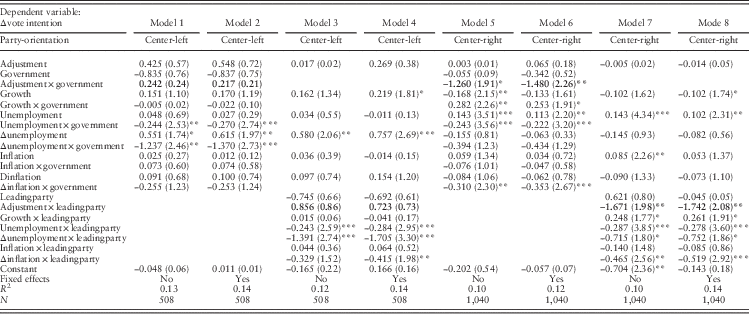
Table 3 builds on this last, fully specified model and displays results from separate estimations for center-left (Models 1–4) and center-right (Models 5–8) parties. Similar to the previous procedure, all models show results with and without fixed effects as well as for the two different government status dummies: one for all government parties, one for leading parties only. Before proceeding to the discussion of the adjustment variable, it is interesting to note that the partisan electoral response to the macroeconomy is largely in line with partisan theory: whereas the electoral punishment for rising unemployment is considerably larger for center-left parties, the opposite is the case for rising inflation. As for the estimates for the interaction between the adjustment dummy and the government status dummies, the differential effect of partisan orientation emerges clearly from the results. Whereas the interaction is positive, albeit non-significant, for center-left parties, the same interaction is negative and significant (for both government status dummies as well as with and without fixed effects) for center-right parties.
Regression output table from the partisan modelsFootnote a

*P<0.1, **P<0.05, ***P<0.01.
a Ordinary least square regressions with panel-corrected standard errors.
Bold values indicate estimate is not significant.
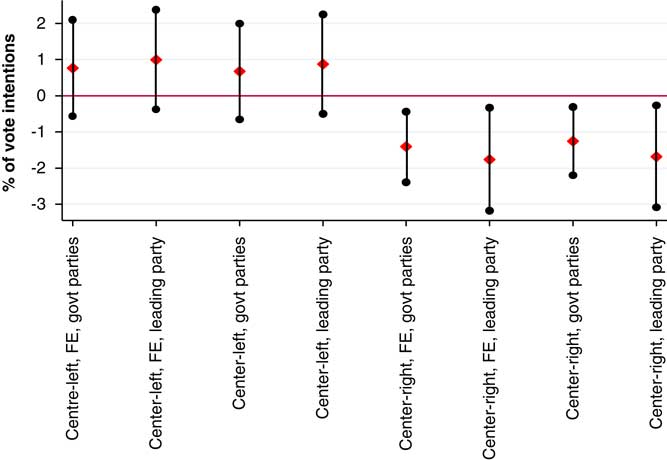
To get a sense of the magnitude of the marginal impact of adjustment years on electoral fortunes, I follow Brambor et al. (Reference Brambor, Clark and Golder2006) and show marginal effects for all the eight models estimated above on Figure 4. All marginal effects for center-left parties are positive and non-significant (with the point estimates ranging between 0.6% and 1%), whereas the estimated marginal impact of adjustment years on the electoral fortune of center-right parties range between −1.25% and −1.76% (expressed in % of vote intentions), all significant at the 5% level or less. In essence, in years of fiscal adjustment, center-right parties can expect to suffer around 1.5% loss in their overall electoral support relative to non-adjustment years.
Marginal effects plot with point estimates and 95% confidence intervals for center-left and center-right parties. Marginal effects are calculated from results presented in Table 3. FE=fixed effects.

The magnitude of these estimated effects is substantively large. For small parties, it can imply falling short of the parliamentary threshold; for large parties, it can result in losing ground to its main center-left rival in the electoral race. The bottom-line, however, is that these findings present a sharp contrast to the relative electoral resilience of the center-left in periods of fiscal stress.
Proceeding to testing the second, complimentary hypothesis, a slight modification of the empirical specification is in order. A model based on the interaction between adjustment periods and the government status dummy is now not appropriate because we want to test the electoral impact on parties as a function of who implements austerity rather than whether the party itself is in government or opposition. I thus introduce a dummy variable taking on the value 1 when the leading government party is center-left and estimate the model separately for various party families: center-right, green, far-left, and far-right. Formally put:
 $$\Delta VI_{{{\rm pt}}} \,{\equals}\,\beta _{0} {\plus}\beta _{i} \left( {A{\times}L} \right){\plus}\beta _{j} \left( {C{\times}L} \right){\plus}\alpha _{{p{\plus}}} \mu _{t} {\plus}{\varepsilon}_{{{\rm pt}}} ,$$
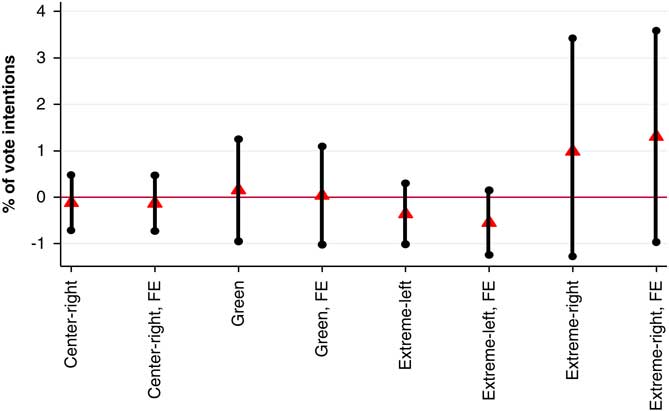
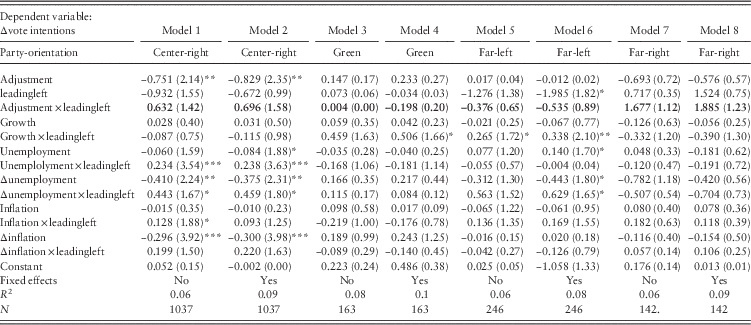
where the previous government dummy (G) is now replaced with L, corresponding to periods when the leading government party is center-left. Following the previous estimation procedure, I provide estimates separately with and without fixed effects. Table 4 shows the estimated coefficients and Figure 5 depicts the point estimates for the marginal impact of fiscal adjustment undertaken by the left on different party families.
Marginal effects plot with point estimates and 95% confidence intervals for different party families under fiscal adjustment undertaken by the center-left. FE=fixed effects.

Regression output table for extension to party families during fiscal adjustment undertaken by the center-leftFootnote a

*P<0.1, **P<0.05, ***P<0.01.
a Ordinary least square regressions with panel-corrected standard errors.
Bold values indicate estimate is not significant.
The results are especially noteworthy because of the lack of significant results for any of the party families. In conformity with the proposed electoral mechanism, center-left parties’ rivals do not seem to benefit from fiscal adjustment undertaken by governments led by center-left parties. The point estimates are even negative, albeit still non-significant, for center-right parties – as predicted by the second hypothesis – and provide no statistical evidence for significant gains for either of the ‘non-mainstream’ challengers: green, extreme-left, and extreme-right parties. Only for this latter group, the far-right, are the point estimates substantively large (around 1% of vote intentions) but the large variation and limited subsample of this party family (142 country-years) do not allow for reliable statistical inference. Overall, therefore, the electoral advantage of the center-left previously found indeed goes hand in hand with the lack of systematic electoral gains by its rivals.
Robustness checks
Returning to the original models predicting the electoral impact on government parties implementing fiscal adjustment, there are four broad lines of possible objections that I seek to address in this penultimate section. First, in the partisan models I used a fairly parsimonious set of controls derived from the economic voting literature; other political variables may have an important impact on the evolution of the electoral strength of parties with a potentially different impact on left-wing and right-wing parties. Therefore, as a first part of my robustness checks (Models 1 and 2 in Table 5), I added a set of dummies (for pre-election years, election years, mid-cycle years with post-election year as the reference category) to control for the effect of the electoral cycle on incumbent popularity (see Veiga and Veiga, Reference von Hagen, Hallett and Strauch2004 for an application). Second, I include an additive index of institutional constraints in reflection on the clarity of responsibility hypothesis in economic voting (Powell and Whitten, Reference Rodrik1993): in contexts of blurred institutional responsibility, the impact of the economy on the assessment of incumbents is weaker. The additive index is augmented by a score of 1 for each of the following four institutional constraints: coalition governments, minority governments, strong bicameralism, and federalism.
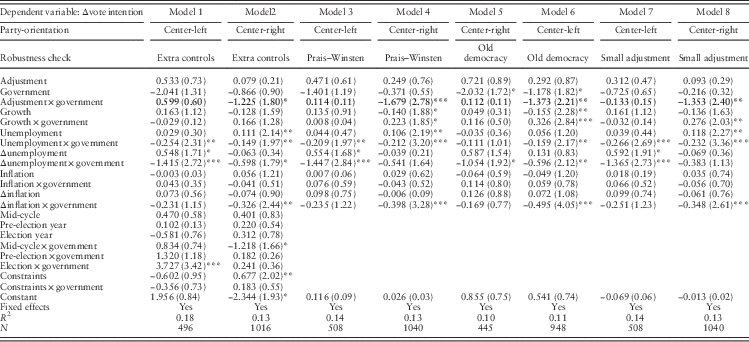
Regression output table from robustness checksFootnote a

*P<0.1, **P<0.05, ***P<0.01.
a Ordinary least square regressions with panel-corrected standard errors.
Bold values indicate estimate is not significant.
My second robustness check (Models 3 and 4 in Table 5) deals with possible autocorrelation issues; though, as argued above, the annual change of popularity rating is much less likely to exhibit serial dependence than the vote intention series in level form,Footnote 15 there is still a distinct possibility of extended trends in the evolution of incumbent popularity introducing autocorrelation in the residuals even in the differenced form of the dependent variable. I thus rerun the models with the Prais–Winsten transformation of the dependent variable.
My third robustness check (Models 5 and 6 in Table 5) seeks to address the heterogeneity in the country sample that raises the possibility that ‘center-left’ and ‘center-right’ may mean very different kinds of parties in different party systems. This could be a particular concern for post-communist democracies where the left-right cleavage tends to be more dominant in issues relating to the role of nationhood, minorities, religion, traditional values, and more generally speaking, in issues rooted in different understandings of public morality (Kitschelt, Reference Kitschelt1992; Vachudova, Reference Veiga and Veiga2008; Rovny, Reference Seeberg2014). Under this robustness check, I thus restricted my empirical sample to established democracies where conceptualizing the left-right cleavage in socioeconomic terms is less problematic.
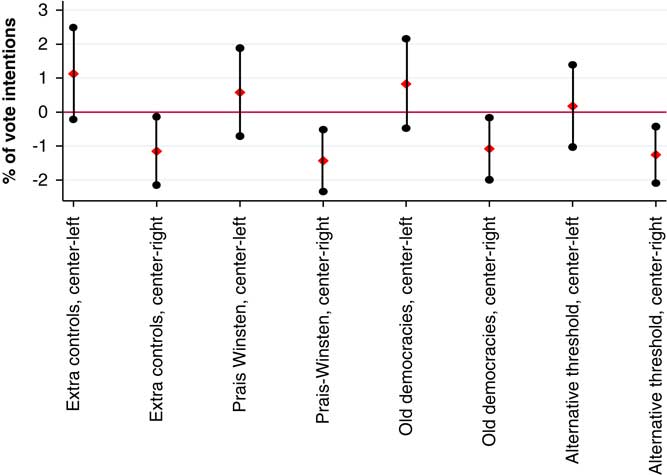
Finally, I check for the stability of the findings under an alternative threshold for identifying fiscal adjustment years. In particular, as a final round of robustness checks (Models 7 and 8 in Table 5), I lower the threshold to a 1% improvement in the cyclically adjusted primary balance; with this new threshold, 24% of all country-years in the sample are now coded as fiscal adjustment compared to the original 17%. Table 5 and Figure 6 display the estimates and the calculated marginal effects for center-left and center-right parties, separately.
Marginal effects plot with point estimates and 95% confidence intervals for center-left and center-right parties. Marginal effects are calculated from results presented in Table 4.

As the results from Table 5 – with the corresponding marginal effects visualized on Figure 6 – reveal, the main estimates are robust across all eight models. Only with the inclusion of the extra controls does the interaction term between the adjustment dummy and the government status dummy become somewhat smaller in magnitude (1.23%) and weaker in significance (0.1>P>0.05) for center-right parties, though the calculated marginal effect of the adjustment dummy is still significant.
Conclusion
The negative relationship between fiscal adjustment and incumbents’ popularity is arguably as close as it gets to a conventional wisdom in political science. The problem with many pieces of conventional wisdom of course is that they are insufficiently subjected to proper empirical scrutiny and critical theorization. This one is no exception.
This article sought to bridge this gap by building on the Hirschmanian framework of EVL. I posited that the degree to which the electorate punishes incumbent governments crucially depends on the available partisan alternatives. If these alternatives are perceived to lie further to the right on the policy dimension of economic orthodoxy, disaffected voters have fewer reasons to switch their votes in their favor. If alternatives are seen as too extreme on other salient political dimensions or lacking governing experience and competence to shield the electorate from the burdens of adjustment, they are equally unlikely to sway a decisive share of disaffected voters. Conversely, when there are available partisan alternatives as more credible defenders of existing government programs, the electoral threat is considerably greater. Combining these considerations led to a simple hypothesis that this article set out to test: the center-left is in an electorally superior position to implement fiscal adjustment compared to the center-right.
Building on a novel and the largest data set to date on close to 100 parties’ popularity ratings from 21 democracies, this hypothesis has been largely confirmed by the data. The partial effect of fiscal adjustment on vote intention shares on government parties (either as leading party, or junior coalition members) is negative and significant only when the parties in question belong to center-right party families. This pattern holds under an alternative country sample restricted to old democracies, different thresholds for identifying fiscal adjustment periods, inclusion of a number of economic and political controls, with and without fixed effects and Prais–Winsten correction of regression residuals. The estimated marginal effects of fiscal adjustment for center-left parties, by contrast, have been found to be positive, albeit non-significant. Moreover, this electoral advantage of the left during episodes of fiscal adjustment has been shown to go hand in hand with no significant electoral gains for its rivals neither in the center (center-right parties) nor in the fringes (green, extreme-left, and extreme-right parties).
A concluding thought that arises from these results is their implication for partisan politics. If the center-left can consistently get away with fiscal adjustment without ever being punished for it, it should be only a matter of time before the very notion of the political left hollows out, ending partisan politics as we knew it in line with the ‘new politics of the welfare state’ thesis (Pierson, Reference Rennwald and Evans1994). Alternatively, it is only a matter of time before new policy entrepreneurs fill the policy space left wide open by the center-left. Recent breakthroughs of radical right and radical left parties in the EU and beyond (Rodrik, Reference Rovny2016), may indicate that the long-term empirical patterns found in this article need to be treated with caution when applied to more recent episodes of fiscal adjustment in the context of the sovereign debt crisis afflicting the Eurozone in 2010 and beyond.
Acknowledgements
This paper has greatly benefited from the input of Hanspeter Kriesi, Waltraud Schelkle and four anonymous reviewers.
Appendix
Political parties in the sample

Sources of polling data (country, polling firm, average number of annual observations)

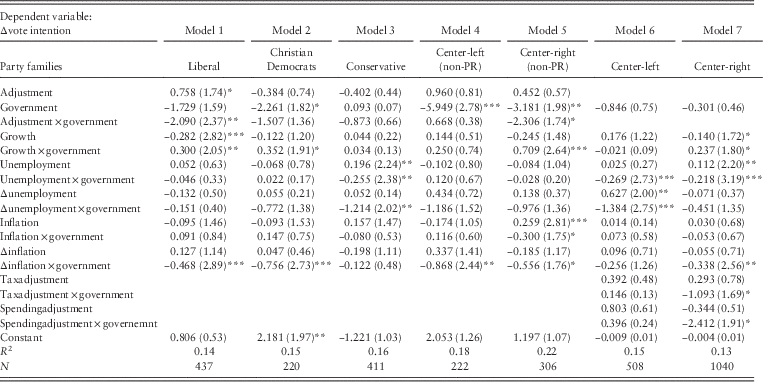
Regression output table for separate center-right party families, non-PR systems and different compositions of fiscal adjustment