Introduction
Antarctic lakes are largely microbial dominated ecosystems (Laybourn-Parry et al. Reference Laybourn-Parry, Ellis-Evans and Butler1996, Priscu et al. Reference Priscu, Wolf, Takacs, Fritsen, Laybourn-Parry, Roberts and Berry Lyons1999). The constituents of these microbial assemblages are viruses, bacteria, protists, and a few zooplankton species. Despite the polar climate, the growth of these organisms may significantly vary under different trophic conditions (Pace & Cole Reference Pace and Cole1994). Several ecological features depend on the trophic status of water bodies. One of them is the interplay of autotrophic and heterotrophic processes. When inorganic nutrients are not limiting production, the release of dissolved organic carbon (DOC) by phytoplankton may account for the bacterial demand. However, extreme oligotrophy may result in heterotrophic biomass exceeding that of autotrophs. Under these circumstances, the carbon requirements of bacteria can be met by allochthonous inputs coming from the lake's catchment. A number of studies indicate that Antarctic lakes are commonly net heterotrophic systems, as carbon consumption exceeds its production (Priscu et al. Reference Priscu, Wolf, Takacs, Fritsen, Laybourn-Parry, Roberts and Berry Lyons1999, Säwström et al. Reference Säwström, Lisle, Anesio, Priscu and Laybourn-Parry2008). Under these circumstances, heterotrophic metabolism can be strongly controlled by the supply of inorganic nutrients (Fisher et al. Reference Fisher, Klug, Lauster, Newton and Triplett2000). This situation involves a more complex regulation of the lake's metabolism (Teubner et al. Reference Teubner, Crosbie, Donabaum, Kabas, Kirschner, Pfister, Salbrechter and Dokulil2003), since bacterioplankton may compete with algae for inorganic resources. At low productive conditions, the microbial food web provides mechanisms to retain nutrients (Wehr et al. Reference Wehr, Le and Campbell1994), both by reducing the losses produced by sinking of organic matter and/or by increasing nutrient regeneration through predation. Bacteriovorus protists can efficiently consume a large fraction of the bacterial production. The protozooplankton is food for metazoan grazers, an important difference from the continental region, in lakes from the Maritime Antarctic (Camacho Reference Camacho2006) and particularly in Byers Peninsula (Rochera et al. Reference Rochera, Justel, Fernández-Valiente, Bañón, Rico, Toro, Camacho and Quesada2010) can be important components of the food web. By this recycling, nutrients are made available to primary producers. However, in the opposite scenario, an increase of nutrient inputs allows a higher contribution of microplankters (Agawin et al. Reference Agawin, Duarte and Agustí2000, Bell & Kalff Reference Bell and Kalff2001), thus enhancing the nutrient burial as a consequence of the production of large and frequently ungrazed phytoplankton and their subsequent sedimentation.
It is thought that the glacial retreat on Byers Peninsula started about 8300 years bp (Toro et al. Reference Toro, Granados, Pla, Giralt, Antoniades, Galán, Martínez Cortizas, Lim and Appleby2013) and the eastern part of the region became free of ice only 500 years ago (Björck et al. Reference Björck, Håkansson, Olsson, Barnekow and Janssens1993, Reference Björck, Hjort, Ingólfsson, Zale and Ising1996). This deglaciation resulted in a chronosequence of water bodies at different stages of evolution. Therefore, lakes sited in the westernmost peninsula are older compared to those located near the glacier front. Actually, ages of only 400–500 years were established for these lakes (Björck et al. Reference Björck, Hjort, Ingólfsson, Zale and Ising1996). Hypothetically, biological productivity might increase as the lake age increases because of natural eutrophication. On the other hand, there are also local factors that can affect the lake's productivity, which are related to the hydrological setting (i.e. Engstrom et al. Reference Engstrom, Fritz, Almendinger and Juggins2000).
In Antarctic ice-free areas such as Byers Peninsula, the functioning of aquatic ecosystems is linked to the surrounding landscape. Landscape-lake interactions are much restricted during winter by the presence of ice and frozen ground but, when snowmelt occurs, these interactions become more intense, at the same time that the biological activity increases (Rochera et al. Reference Rochera, Justel, Fernández-Valiente, Bañón, Rico, Toro, Camacho and Quesada2010). Some aspects, such as the weathering or the nutrient inputs into lakes, largely depend on catchment properties such as size, topography, and/or vegetation coverage. Lakes on Byers Peninsula also vary in relation to the benthic communities that they support. For instance, there are lakes that have a well developed benthic carpet of mosses (Drepanocladus longifolius (Mitt) Broth. ex Paris) such as Lake Limnopolar, Midge Lake and Lake Chester (Toro et al. Reference Toro, Camacho, Rochera, Rico, Bañón, Fernández-Valiente, Marco, Justel, Avendaño, Ariosa, Vincent and Quesada2007). By contrast, in other lakes, such as Escondido and Aså (unofficial names), the moss patches are smaller and occur only close to the shore. On the other hand, shallower lakes are in some cases only overlaid by thin microbial mats and/or by less coherent biofilms (Fernández-Valiente et al. Reference Fernández-Valiente, Camacho, Rochera, Rico, Vincent and Quesada2007).
Our aim was to provide a description of the nutrient content and biological characteristics of some representative lakes of Byers Peninsula. This is of interest because this region exhibits water bodies distributed from inland to coastal areas that might contrast in their trophic status (Toro et al. Reference Toro, Camacho, Rochera, Rico, Bañón, Fernández-Valiente, Marco, Justel, Avendaño, Ariosa, Vincent and Quesada2007). In our study we have explored factors affecting these trophic variations as well the structure of the associated microbial population of picoplankters, both heterotrophic and autotrophic. We hypothesize that the relative importance of resource availability structures these pelagic populations regardless of the role of climatic stressors. Whilst, organism abundance does not exclusively give an overall description of the energetic mechanism taking place, we have attempted to interpret our results also on the basis of energetic balances and nutrient fluxes.
Material and methods
Sampling survey
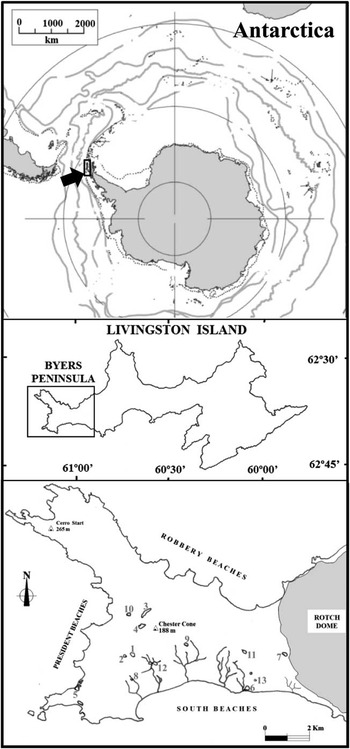
The survey was conducted from middle December to early February 2001–02. Twelve lakes and a pond were chosen to represent the diversity of water bodies occurring on Byers Peninsula (Livingston Island, South Shetland Islands, Maritime Antarctica). Selection was based on their geographical location (Fig. 1), bathymetric characteristics (Table I), and perceptible trophic status. All water bodies were sampled at least once during this period (see sampling schedule in Table II). Sampling was performed at the deepest point of the lake. Water samples were obtained with a 5 l Kemmerer-like sampler. Samples for the analyses of inorganic soluble nutrients (nitrate plus nitrite: NOx, ammonium: NH4, soluble reactive phosphorus: SRP and soluble reactive silicate: SRSi) were filtered immediately through GF/F glass fibre filters (Whatman®). The samples were stored frozen at -20°C in acid-washed bottles until analysis. For the analysis of total phosphorus (TP) and total nitrogen (TN) the same type of bottles were filled directly without filtration and stored at -20°C. For picoplankters counts (both heterotrophic and autotrophic), samples were fixed with buffered formalin (2% final concentration) and kept refrigerated (4°C) in the dark until slide preparation. For the analysis of photosynthetic pigments (chlorophyll a (chl a) and taxon-specific carotenoids), a known volume of water was filtered through GF/F filters, and the filters were stored frozen at -20°C in the dark until analysis.
Location of Byers Peninsula (Livingston Island, South Shetland Islands) in the Antarctic continent. The lower map shows the location of the water bodies studied on Byers Peninsula. Limnopolar (1), Somero (2), Midge Lake (3), Lake Chester (4), Maderos (5), Refugio (6), Domo (7), Chica (8), Escondido (9), Aså (10), Las Palmas (11), Turbio (12), Pond (13).

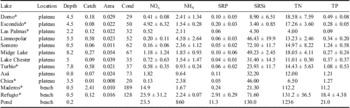
Environmental variables measured in water bodies from Byers Peninsula during ice-free period (some of data are shown as ranges in Toro et al. Reference Toro, Camacho, Rochera, Rico, Bañón, Fernández-Valiente, Marco, Justel, Avendaño, Ariosa, Vincent and Quesada2007). The months in which lakes were sampled are indicated in Table II. Data are discrete measures or mean ± standard deviation of n replicates (see Table II). Standard deviation is shown where at least three replicates were obtained. Nutrient concentrations are expressed in μM. Conductivity (Cond) is expressed in μS cm-1. Catchment size (Catch) and lake surface (Area) are approximate measures expressed in km2. All samples were collected from mid- or surface depths (0.5–2 m), except for Midge Lake and Lake Chester, which also include samples from 8 and 4 m respectively. SRP = soluble reactive phosphorus, SRSi = soluble reactive silicate, TN = total nitrogen, TP = total phosphorus.
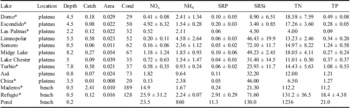
*Unofficial names but frequently used in the literature.
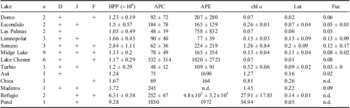
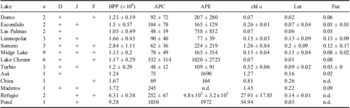
Microbial abundances and pigment concentrations measured in some water bodies from Byers Peninsula during ice-free period (some of data are shown as ranges in Toro et al. Reference Toro, Camacho, Rochera, Rico, Bañón, Fernández-Valiente, Marco, Justel, Avendaño, Ariosa, Vincent and Quesada2007). The months in which lakes were sampled are indicated (D = December, J = January, F = February). Data are discrete measures or mean ± standard deviation of n replicates. Microbial abundances are expressed as cells ml-1. Pigments are expressed as (μg l-1) for chlorophyll a (chl a) and relative amounts (μg μg chl a -1) for predominant taxa-specific carotenoids (Lut = lutein, Fuc = fucoxanthin). HPP = heterotrophic picoplankton, APC = picocyanobacteria, and APE = autotrophic picoeukaryotes. All samples were collected from mid- or surface depths (0.5–2 m), except for Midge Lake and Lake Chester, which also include samples from 8 and 4 m respectively.
Chemical and biological analyses
Soluble inorganic nutrients (nitrate, ammonia, phosphorus and silicate) were analysed on filtered samples following the methods summarized in Toro et al. (Reference Toro, Camacho, Rochera, Rico, Bañón, Fernández-Valiente, Marco, Justel, Avendaño, Ariosa, Vincent and Quesada2007) and Rochera et al. (Reference Rochera, Justel, Fernández-Valiente, Bañón, Rico, Toro, Camacho and Quesada2010). Total nitrogen was quantified as nitrate from non-filtered samples after oxidation using an alkaline persulphatic digestion (NaOH 6 g l-1 and K2S2O8 6 g l-1 final concentration) at 150°C for two hours. Total phosphorus was quantified from the same samples after an acid digestion with sulphuric acid and potassium persulphate (0.072 N and 12 g l-1 final concentrations, respectively) at 150°C for two hours. Particulate nitrogen (Np) and phosphorus (Pp) were calculated by subtracting dissolved inorganic nitrogen (DIN) and SRP to the totals respectively.
The preparation of slides for picoplankton counts was performed one to two days after sample collection, after which they were kept frozen in the dark until microscopic analyses. Bacterioplankton abundances were obtained by epifluorescence microscopy on DAPI (40,6-diamidino-2-phenylindole)-stained samples concentrated (3–5 ml) on black polycarbonate filters (0.2 μm). During filtration, a 0.8-μm-pore cellulose acetate backing filter was used to obtain a uniform distribution of cells. For the determination of autotrophic picoplankton, a volume of up to 20 ml was filtered similarly, but filters were prepared without stain. In both cases, filters were mounted on a slide using non-fluorescent immersion oil. All counts were performed with a Zeiss-III epifluorescence microscope. For bacterioplankton counts, filters were excited with ultraviolet light and observed through a blue/cyan filter. In the case of the autotrophic picoplankton, the cells were visualized by means of green light excitation (BPλ546 nm, FTλ580 nm, LPλ590 nm). The photosynthetic pigments analyses were performed by high-performance liquid chromatography (HPLC) (Rochera et al. Reference Rochera, Justel, Fernández-Valiente, Bañón, Rico, Toro, Camacho and Quesada2010). The identities of peaks observed in chromatograms were determined by comparing retention times and spectra with pure standards (DHI®), or with chromatograms from pure cultures. The amount of pigment was quantified against the curves obtained with standards by integration of the area under the cross-section at 440 nm. Fucoxanthin was used as a marker of diatoms and chrysophytes, and lutein was used as marker of chlorophytes.
Statistical analyses
Linear regressions with log-transformed data were used to identify relationships among variables. Correlations were considered to be significant when the probabilities of a Spearman rank correlation were < 0.05. Because the data were non-normally distributed, a Mann-Whitney's test was carried out to test variable differences among lakes using the same level of significance. In order to explore trends of variability among lakes, a principal components analysis (PCA) was performed on the limnological data. The variables used for the analysis, which were the basin area, Na+, Mg+2, Cl-, conductivity, alkalinity and lakes’ distance to the sea were previously published in Toro et al. (Reference Toro, Camacho, Rochera, Rico, Bañón, Fernández-Valiente, Marco, Justel, Avendaño, Ariosa, Vincent and Quesada2007). Data used for the multivariate analysis represent the mean values of surface samples obtained along the entire sampling period from each lake. For PCA analysis, variables were log-transformed to linearize the relationships and avoid the influence of magnitude. According to Kaiser-Guttman criterion (Jackson Reference Jackson1993), PCA axes were selected with the condition that they displayed eigenvalues higher than 1. All statistical analyses were computed using SPSS for Windows Version 15.0.
Results
Nutrients concentrations
The bathymetric characteristics and the concentrations of major inorganic nutrients measured during the sampling period in lakes and in the pond are summarized in Table I. Most of these water bodies ranged from ultra-oligotrophic to oligotrophic, except some that were located close to the coast, such as lake Refugio (unofficial name) and the pond, in which marine animals (i.e. elephant seals) supplied high amounts of nutrients. In the lakes on the plateau, the range of the SRP concentrations was quite narrow, varying from levels below detection (< 0.03 μM, Lake Chester) to 0.2 μM in lake Escondido. In the coastal lagoons, SRP concentrations were noticeably higher in lake Refugio (2.9 μM), but lake Maderos (unofficial name) showed similar amounts to those observed in lakes from the plateau. The highest SRP concentrations (11.3–14.6 μM) were measured in the pond located next to colonies of elephant seals. Also differences were observed in the concentration of oxidized nitrogen compounds. Nitrate plus nitrite (NOx) ranged 0.13–1.81 μM and 14.9–25.9 μM in lakes from upland and coastal sites, respectively, being significantly lower in the former (P < 0.001). By contrast, NH4 concentrations in the coastal sites were similar to those observed in upland lakes, except in the pond located near the colonies of sea fauna, where concentrations were particularly high (800 μM). In the lakes from the plateau NH4 concentrations ranged from 0.64–4.57 μM. Silica concentrations (SRSi) also varied among sites. Lakes located in the central part of the plateau (lake Domo, lake Las Palmas (unofficial names) and lake Escondido) displayed significantly lower concentrations (range: 3.4–8.9 μM; P = 0.03), whereas in the rest (including coastal lagoons) the concentrations varied in a higher range between 21.3 and 130 μM, being the highest measured in the shallower water bodies (Somero (unofficial name), Refugio and in the pond).
With the exception of the pond, whose values were approximately 100-fold higher compared to the more oligotrophic water bodies, TN and TP in lakes ranged from 4.00–171.18 μM and 0.09–21.05, respectively (Table I). The three coastal sites (Refugio, Maderos and the pond) showed significantly higher concentrations of TN (P = 0.02) and TP (P < 0.001), respectively, compared to upland lakes. Thus, the concentrations in lakes in the plateau were approximately one order of magnitude lower, having values below 25 μM and 2 μM TN and TP, respectively. The TN/TP molar ratio also varied between lakes, from relatively the Redfield ratio (i.e. Refugio, Turbio (unofficial name), Somero, Aså, and Maderos) to those displaying a notable P-deficiency, as observed in lake Escondido and more notably in Lake Chester and Midge Lake.
Photosynthetic pigments
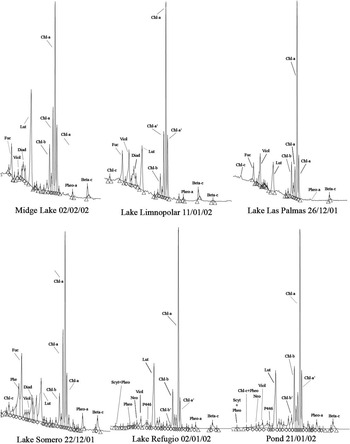
The mean chl a concentrations are shown in Table II. In the lakes located on the plateau, the concentrations were significantly lower compared to coastal sites (P = 0.003). In the former, concentrations varied from 0.06–2.22 μg l-1 and the lower (< 0.1 μg l-1) were usually recorded in December in the surface waters of lakes located in the easternmost part of the peninsula (Las Palmas and Domo), and also in the surface of Lake Chester and at 4 m in Midge Lake. In the other lakes located in the central part of the plateau, concentrations differed depending on lake depth. Thus, in mid-shallow lakes (e.g. Limnopolar, Turbio and Escondido) concentrations ranged around 0.1–0.5 μg l-1, whereas in shallower lakes (e.g. Somero, Chica (unofficial name) and Aså), concentrations were somewhat higher, varying between 0.7 and 2.22 μg l-1. On the other hand, in some of the coastal sites, the chl a concentrations were at least tenfold higher. In lake Refugio for example, concentrations ranged between 17.0 and 40.5 μg l-1. A discrete sample in the pond showed a concentration as high as 54.9 μg l-1. By contrast, the chl a concentration measured in lake Maderos was slightly higher than observed in the upland lakes. The HPLC chromatograms extracted at 440 nm from some of the lakes are shown in Fig. 2, demonstrating the elution order of the different photosynthetic pigments. Chromatograms showed a major presence of specific carotenoids of chlorophytes (lutein, violaxanthin, neoxanthin, clorophyll b), and both chrysophytes and diatoms (fucoxanthin, diadinoxanthin, clorophyll c). Trends in phytoplankton community structure can be partially derived from the relative concentrations (i.e. relative to chl a) of the predominant taxa-specific carotenoids observed in these chromatograms. In particular, we focused on lutein and fucoxanthin, for which we calculated concentrations by using pure standards (Table II). The amounts of lutein relative to chl a, a characteristic carotenoid of chlorophytes, ranged from 0.01–0.30 in all lakes. As a rule, they increased with time, with the lowest values (< 0.07) observed in December in the eastern part of the Peninsula and in some from the central part (i.e. Lake Chester). In the other lakes from the plateau, values were between 0.08 and 0.30, with the lowest values also occurring at the beginning of summer. The relative concentrations of lutein in coastal sites were similar (range 0.52–0.26) to that observed in the shallowest lakes of the platform (i.e. Somero or Aså). For the fucoxanthin, which is specific of diatoms and chrysophytes, there was not a clear seasonal trend. The range of variation among lakes was 0.01–0.31. In general, the relative concentrations of fucoxanthin were consistently below 0.1, although higher values were observed in Lake Somero in December (0.31) and in Lake Limnopolar at the end of January (0.17).
Some of the high-performance liquid chromatography chromatograms extracted at 440 nm showing the photosynthetic pigment composition of some of the lakes studied on Byers Peninsula. Fuc = fucoxanthin, Viol = violaxanthin, Diad = diadinoxanthin, Lute = lutein, Chl-b = chlorophyll b, Chl-b’ = chlorophyll b allomer, Chl-c = chlorophyll c, Chl-a’ = chlorophyll a allomer, Chl-a = chlorophyll a, Pheo-a = Phaeophytin a, Beta-c = β-caroten. The chromatograms are normalized to the same size based on the largest peak (chl a).

Microbial abundances
The abundances of heterotrophic picoplankton (HPP) varied broadly in the lakes from 0.5–6.5 x 10⁶ cell ml-1 (Table II). Heterotrophic picoplankton numbers in lakes from the plateau were usually below 1.5 x 10⁶ cell ml-1, except in December, just after the complete ice thaw. At this time some of them displayed higher abundances of around 2 x 10⁶ cell ml-1 (e.g. Limnopolar, Escondido). Among these lakes, lake Somero showed on average the highest bacterial numbers (2.84 x 10⁶ cell ml-1). Abundances in coastal water bodies were significantly higher (P = 0.014), being between 3.7 x 10⁶ cell ml-1 and 6.6 x 10⁶ cell ml-1 in the lagoons (Maderos and Refugio respectively) and even higher (9.3 x 10⁶ cell ml-1) in the pond.
Autotrophic picoplankters were present in all lakes and were composed of both picocyanobacteria (APC) and small (2–5 μm) unclassified autotrophic eukaryotes (APE) with a cell morphology that resembled a prasinophyte. In relative terms, eukaryotic forms usually dominated and APC commonly occurred at low densities (Table II). Among lakes located in the plateau, the highest values of APC abundances were recorded in Lake Chester. Their vertical distribution in this lake changed seasonally with the higher numbers in surface waters in December and in deep waters in February. Among the coastal sites, a low abundance was observed in all lagoons (> 200 cells ml-1), while in the pond, densities of up to 1.85 x 10³ cells ml-1 were recorded. The abundances of APE were higher and more variable among lakes. They ranged broadly from 9–711 x 103 cells ml-1 in the studied lakes, being significantly higher (P = 0.015) in the coastal sites. The densities in the upland lakes were always below 6 x 10³ cells ml-1. In the latter, abundances peaked normally in surface layers, such as in the case of Midge Lake.
Multivariate analyses
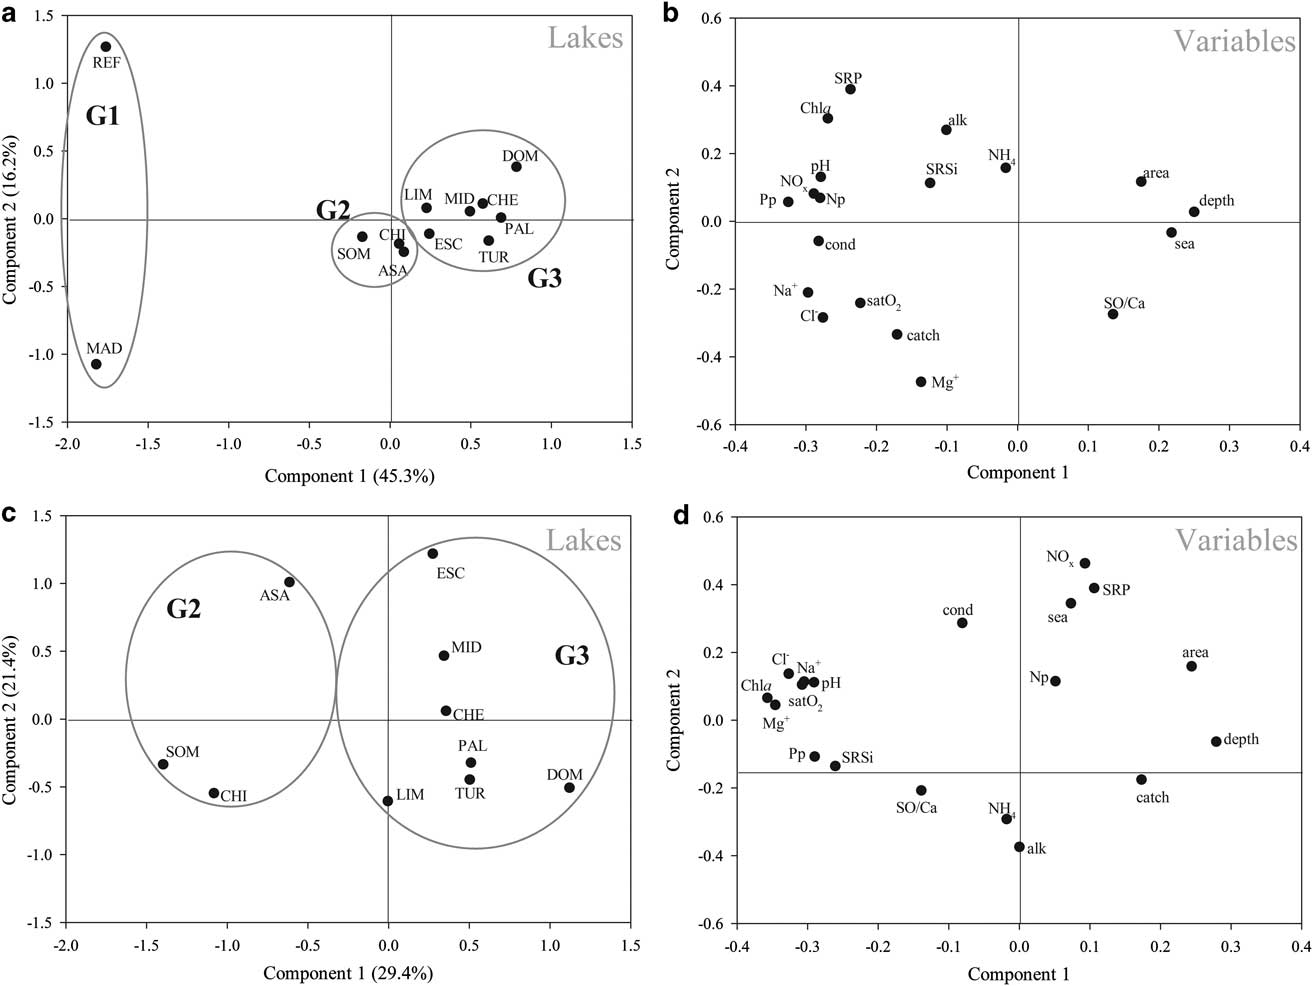
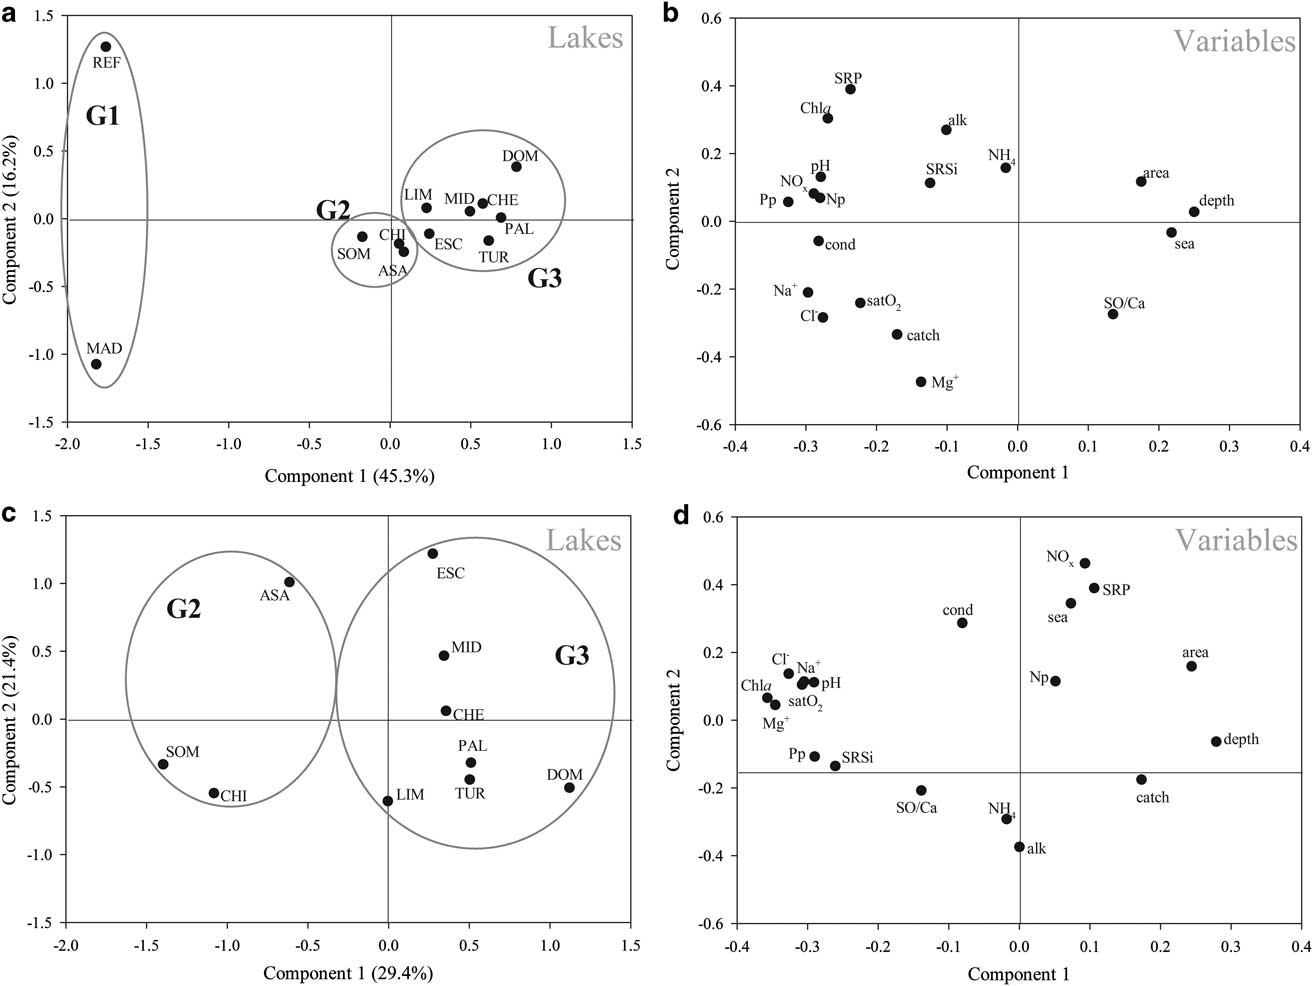
A PCA was performed to explore the occurrence of patterns influencing lake characteristics. For the analysis we used only those lakes for which we had a more detailed dataset, namely, lakes Limnopolar, Somero, Chester, Midge, Domo, Escondido, Chica, Turbio, Las Palmas, Aså, Refugio, and Maderos. Two different PCAs were run with a different set of cases in order to better evaluate the latent trends. One of them (PCA-1; Fig. 3a & b) included data from all the above mentioned lakes, whereas the second (PCA-2; Fig. 3c & d) was performed on all lakes except Maderos and Refugio. In the PCA-1, the first and second axes jointly explained 61.5% of variance. The analysis clearly differentiated lakes located in the plateau from those closest to sea (i.e. Maderos and Refugio). The first axis accounted for 45.3% of the explained variance. The factors that contributed most positively to this axis were those related to the lake morphometry (area and depth) and the distance to sea, while the variables that contributed most negatively were those associated with a higher salt content (e.g. conductivity, Na+, Cl-) and trophic status (e.g. chl a concentrations, particulate nutrients). The second axis explained only 16.2% of variability observed. In this component, the catchment area (Catch) was related to the ionic composition of waters, and clearly discriminated lake Maderos from the rest. On the other hand, by excluding coastal sites (Refugio and Maderos) in PCA-2, it was possible to observe clearer differences between the upland lakes. In this case, the first and second axes accounted for 29.4% and 21.4% of the variance observed, respectively. The first component in PCA-2 discriminated lakes showing a higher trophic status (i.e. Aså, Chica and Somero) from those that were more oligotrophic, and those having a higher surface and depth. The second component separated lakes in function of distance to the sea, which also correlated positively with the concentrations of some dissolved nutrients (i.e. NOx and SRP).
Principal component analysis (PCA) of the environmental characteristics of the studied water bodies. The lakes in PCA-1 (a. & b.) are: lake Aså (ASA), Lake Chester (CHE), lake Chica (CHI), lake Domo (DOM), lake Escondido (ESC), Lake Limnopolar (LIM), lake Maderos (MAD), Midge Lake (MIL), lake Las Palmas (PAL), Lake Refugio (REF), Lake Somero (SOM), and lake Turbio (TUR). The PCA-2 (c. & d.) includes the same lakes except Maderos and Refugio (see text for details). The labels of variables are: satO2 (oxygen saturation), alk (alkalinity), catch (catchment area), Chla (chlorophyll a), Cl- (chloride), cond (conductivity), sea (distance to sea), Mg+ (magnesium), Na+ (sodium), pH, Si (silicates), SO/Ca (sulfate/calcium molar ratio), Np (particulate nitrogen), Pp (particulate phosphorus), NOx (nitrite+nitrate), NH4 (ammonium), SRP (soluble reactive phosphorus), SRSi (soluble reactive silicate). The lakes included in the G1 and G2 envelopes lack mosses and some of them show cyanobacterial mats. By contrast, lakes enveloped in G3 show well developed or patched mosses populations on their bottoms.
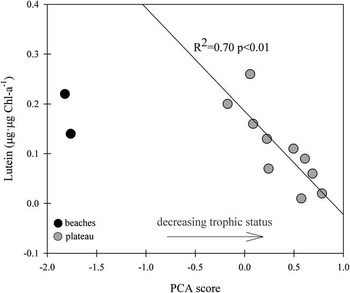
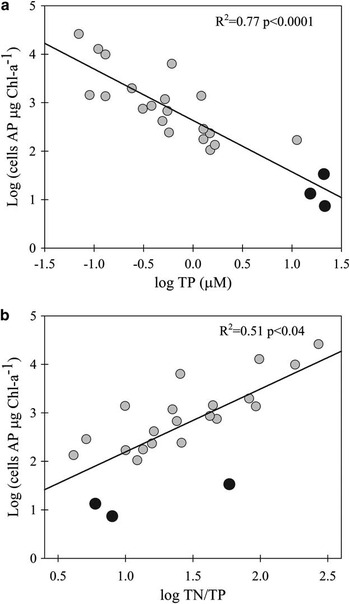
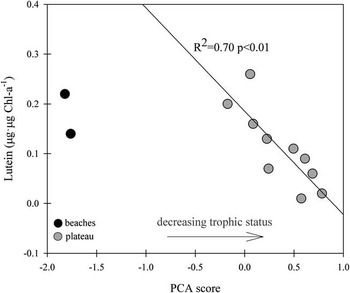
The relationships between some of the variables were also examined. The Pearson correlation of log transformed data demonstrated a positive relationship between TP and chl a concentrations (r 2 = 0.83, P < 0.0001, n = 23), but somewhat weaker with TN (r 2 = 0.62, P < 0.0001, n = 23). By contrast, no significant correlation was observed between chl a and TN/TP atomic ratios (r 2 = 0.25, P = 0.06, n = 23). Heterotrophic picoplankton abundances were positively correlated with trophic variables such as chl a (r 2 = 0.69, P < 0.0001, n = 24), TN (r 2 = 0.62, P < 0.0001, n = 24) and TP (r 2 = 0.63, P < 0.0001, n = 24). However, a different relationship between algal biomass and bacteria arose depending on trophic status. Thus, HPP numbers relative to chl a decreased significantly (r 2 = 0.75, P < 0.0001, n = 23) with the increase of TP concentrations. The structure of the phytoplankton community was also affected by the lake's trophic status. Thus, in the complete range of the studied water bodies both fucoxanthin and mainly lutein were unimodally related to chl a (fucoxanthin: r 2 = 0.64, P < 0.001, n = 23; lutein: r 2 = 0.94, P < 0.0001, n = 23). Also in this sense, a significant correlation (r 2 = 0.7, P < 0.01, n = 10) was observed between the mean seasonal amounts of lutein and the scores of the first component of PCA-1 (Fig. 4), which was strongly related to the trophic status. However, this significant correlation was only observed for the lakes located on the plateau. On the other hand, an increase of lutein relative to fucoxanthin was observed as chl a concentrations increased, although it was not statistically significant (r 2 = 0.20, P = 0.06, n = 23). Some correlations emerged with autotrophic picoplankters (APC+APE) when considering their relative contribution to the total algal biomass (Fig. 5). The abundance of autotrophic picoplankton relative to the chl a concentrations were positively and negatively correlated, respectively, with TP (r 2 = 0.77, P < 0.0001, n = 23) and TN/TP (r 2 = 0.51, P = 0.04, n = 23). The weakness in the negative correlation with the N/P molar ratio was mainly provoked by the eutrophic water bodies (Refugio and the pond) which are indicated by black circles in the plots (Fig. 5).
Relationship between the mean concentration of lutein (expressed relative to chl a concentration) and the scores obtained for the same sample in the first component of PCA-1. This component was strongly related with the trophic status of lakes (see text and Fig. 3 for details). Correlation was only statistically significant for the lakes located on the plateau.
Relative contribution of autotrophic picoplankton to the total phytoplankton depending on the trophic status. a. Logarithm of the abundances of picoplankters per chlorophyll a (chl a) amounts as function of the logarithm of total phosphorus concentrations. b. Logarithm of the abundances of autotrophic picoplankters per chl a amounts as function of the logarithm of total nitrogen/total phosphorus molar ratio.

Discussion
In this study we have characterized a diverse set of water bodies from Byers Peninsula, which comprise a broad range of morphological, chemical and trophic conditions. This study is a development from the general limnological characterization of Byers Peninsula provided in Toro et al. (Reference Toro, Camacho, Rochera, Rico, Bañón, Fernández-Valiente, Marco, Justel, Avendaño, Ariosa, Vincent and Quesada2007). Here we demonstrate the occurrence of natural eutrophication processes in Antarctic ecosystems, which produce the existence of freshwater ecosystems ranging from ultra-oligotrophic to eutrophic. There have been previous studies describing the occurrence of natural eutrophication in Antarctic ecosystems (Laybourn-Parry et al. Reference Laybourn-Parry, Ellis-Evans and Butler1996, Butler Reference Butler1999, Izaguirre et al. Reference Izaguirre, Mataloni, Allende and Vinocur2001). For multivariate analysis, we averaged variables with time thus reducing them to only one datum. We assume that this may eliminate the seasonal variation from the analysis. In our analysis, most of the variability displayed in PCAs originates from conservative variables such as morphometry, geographical location or water chemistry, or the trophic status, which do not change significantly through the summer period in any of the studied lakes. From the results obtained in the PCA analysis, two main geographic limnological regions are observed: a central plateau having many medium-depth and shallow lakes with small watersheds and ultra-oligotrophic conditions, and the coastal area that includes the south and western beaches, where shallow water bodies commonly have high nutrient concentrations. Our survey was limited to southern and western beaches although similar conditions are expected for the lakes located in the northern beaches. In the former, the ultra-oligotrophy is caused by the nutrient poor bedrocks and soils of the site. However, some differences in these plateau lakes are observed depending of the morphometry of the lake's basin and the vegetation coverage of the catchment (i.e. microbial mats, mosses, lichens).
Both particulate nutrients and chl a concentrations underlie the productivity gradient that occurs from inland to littoral water bodies, which is defined in the first component of the PCA-1. In some trends, our findings are similar to the previous study performed by Jones et al. (Reference Jones, Juggins and Ellis-Evans1993) in the region, which also included lakes from Signy Island. In the Jones et al. analysis the water bodies from Byers Peninsula also segregated with respect to their trophic status and marine influence. We distinguish at least three different lake groups. The first group includes the coastal lagoons, which are positively associated with trophic indicators. These water bodies experience heavy nutrient inputs because of the activity of fauna in their vicinities (mammals and birds), principally southern elephant seals (Mirounga leonine (L.)). They have, in addition, a higher exposure to sea-spray, which probably provides an additional supplement of nutrients. A second group is composed of mid-depth and shallow (0.5–3 m) lakes located more inland (i.e. Somero, Aså and Chica), in which a strong sediment-water interaction probably occurs. In these lakes, the wave-induced re-suspension of sediments is favoured by the shallowness of lakes. This sediment re-suspension enhances the input of nutrients to the water column. This process also occurs in the coastal lagoons, but it should be more important in relative terms in these shallow and more upland lakes such as in Lake Somero, where external sources are of less importance compared to internal loads. The sediment movement that occurs in these lakes is reflected, for instance, in the higher amounts of pheopigments relative to chl a (Fig. 2), reflecting re-suspension of previously settled algae with pigments showing a higher degree of degradation. The burrowing activity of benthic invertebrates, principally Branchinecta gainii Daday, which are quite abundant in shallow lakes on the plateau (Toro et al. Reference Toro, Camacho, Rochera, Rico, Bañón, Fernández-Valiente, Marco, Justel, Avendaño, Ariosa, Vincent and Quesada2007), also probably contributes to this. Finally, the third group includes the deepest lakes (5–9 m) located furthest from the coast, which receive limited inputs of nutrients rendering them oligotrophic. Our results agree with those reported by Villaescusa et al. (Reference Villaescusa, Casamayor, Rochera, Velázquez, Chicote, Quesada and Camacho2010) that showed that factors other than low temperatures may determine the biological structure of these lakes.
Our observations indicate that the moss coverage in lakes could also be an attribute affecting variability among lakes. Thus, the first and second groups of lakes discriminated in the PCA (G1 and G2 envelopes in Fig. 3, respectively) lack benthic mosses, although some of them show cyanobacterial dominated mats on their shores. By contrast, most of the lakes of the third group (G3 envelope in Fig. 3) show well developed or patchy moss populations in the benthos. This supports the idea that both depth and sediment stability are desirable conditions for the development of these benthic communities. On the other hand, in lakes lacking mosses the microbial mats show a restricted distribution (Toro et al. Reference Toro, Camacho, Rochera, Rico, Bañón, Fernández-Valiente, Marco, Justel, Avendaño, Ariosa, Vincent and Quesada2007, Fernández-Valiente et al. Reference Fernández-Valiente, Camacho, Rochera, Rico, Vincent and Quesada2007), forming a ring along the lake (i.e. lake Somero). It appears that the slow accretion of mats requires minimal disruption for the development of a significant coverage. Therefore, the development of these mats in the shallower lakes probably is impeded by the instability that the wind induces. Although they dominate in other habitats from Byers Peninsula (Fernández-Valiente et al. Reference Fernández-Valiente, Camacho, Rochera, Rico, Vincent and Quesada2007, Velázquez et al. Reference Velázquez, Rochera, Camacho and Quesada2011), it seems that there are several stressors preventing the colonization of the bottom of lakes by the mats.
The relative dominance of algal groups in the lakes can be deduced from trends of taxa-specific carotenoids. Although the relationship is somewhat weak, the increase of trophic status seems to favour a progressive dominance of chlorophytes over other algal groups (chrysophytes and/or diatoms). However, most of these diatoms have a benthic origin (Toro et al. Reference Toro, Camacho, Rochera, Rico, Bañón, Fernández-Valiente, Marco, Justel, Avendaño, Ariosa, Vincent and Quesada2007, Rochera et al. Reference Rochera, Justel, Fernández-Valiente, Bañón, Rico, Toro, Camacho and Quesada2010) and so their abundances are not always a direct response to trophic status, but are mainly related to external inputs via runoff. Whilst chrysophytes have been regularly associated with oligotrophic waters in high latitudes (Izaguirre et al. Reference Izaguirre, Allende and Marinone2003, Forsström et al. Reference Forsström, Sorvari, Korhola and Rautio2005), it has been noted that in nutrient-impacted sites some chlorophytes (i.e. flagellates and/or coccoid unicells) can be an important component of phytoplankton assemblages (Sigee Reference Sigee2005).
The nutrient status of lakes from Byers Peninsula also appears to affect the relative role of autotrophic picoplankton in these lakes. As noted in the Spearman correlations, both TP concentration and TN/TP ratios are good predictors of the relative dominance of autotrophic picoplankters in the entire phytoplankton assemblage. Thus, a clear trend in the reduction of their relative abundances is observed as trophic status increase, in such a way that relationships with TP and TN/TP are negative and positive, respectively. The occurrence of low TN/TP ratios associated with increasing trophic status is a regular trend in inland waters (Wehr Reference Wehr2008), even in Antarctica (Borghini et al. Reference Borghini, Colacevich, Caruso and Bargagli2008). This apparently occurs on Byers Peninsula as well and, tentatively, determines the prevalence of a nitrogen limitation when phosphorus is in excess. This is observed at least up to TP levels of 2 μM. The linear relation that exists between the TP concentration and the TN/TP ratio saturates when the former is higher than this threshold concentration (i.e. 2 μM). An increase of the relative role of photosynthetic picoplankters at low nutrient levels has been previously reported, in both field (Vörös Reference Vörös1991, Agawin et al. Reference Agawin, Duarte and Agustí2000, Camacho et al. Reference Camacho, Picazo, Miracle and Vicente2003) and experimental studies (Wehr et al. Reference Wehr, Le and Campbell1994, Lagus et al. Reference Lagus, Suomela, Weithoff, Heikkila, Helminen and Sipura2004). This has been partly explained by the competitive advantage for nutrient assimilation that the smaller autotrophic picoplankters have over larger cells (Bell & Kalff Reference Bell and Kalff2001) because autotrophic picoplankters have a larger cell surface/volume ratio. However, in our case, the contribution of autotrophic picoplankters to the total algal biomass was generally low.
Special attention should be paid to the peaks of autotrophic picoeukaryotes observed occasionally in the surface of deepest lakes. This may be due to their higher photosynthetic and growth efficiencies at low light levels compared to larger phytoplankton (Raven Reference Raven1998). Forms similar to picoprasinophytes composed these populations. These shade-adapted organisms are known to occur in polar seas (Lovejoy et al. Reference Lovejoy, Vincent, Bonilla, Roy, Martineau, Terrado, Potvin, Massana and Pedrós-Alió2007) and also in Antarctic lakes (Bell & Laybourn-Parry Reference Bell and Laybourn-Parry1999, Reference Bell and Laybourn-Parry2003). As opposed to other algal groups, these picoeukaryotes persist just beneath the ice cap during late winter despite the reduced light availability. This is a time when the light penetration in the water column increases due to the progressive reduction of the ice cover. Although they are probably common in other lakes from Byers Peninsula, we only observed them in lakes where the ice thaw occurred later in the melt season. However, it must be noted that the earliest sampling in these lakes were when the ice break-up had started. In spite of these sub-surface peaks, small autotrophs were not observed in our study at depth during the ice-free period. Following the idea of Camacho et al. (Reference Camacho, Picazo, Miracle and Vicente2003), the low vertical stability demonstrated by these lakes from Byers Peninsula that occurs after the ice melting, combined with their relatively shallowness, probably represents unfavourable conditions for the formation of these high productive sub-surface layers.
In summary, we demonstrate the occurrence of a relatively large productivity gradient that extends from the lakes located upland, which are characterized by small watersheds and ultra-oligotrophic conditions, to the coastal water bodies located close to the sea, which show higher salt and nutrient concentrations. The morphometry of lakes also accounts for differences observed, in such a way that the shallowness favours the internal inputs of nutrients. However, in the lakes located in coastal areas, which are also shallow, the internal loading is overwhelmed by the occurrence of external sources. We have shown some aspects of the biotic structure of these water bodies, in particular those related with the abundances of picoplankters and the phytoplankton community structure, that depend on this increasing trophic status. Thus, it appears that the nutritional status of lakes clearly plays a significant role in structuring the pelagic communities despite climatic constraints, but the existence in some cases of a top-down control must not be forgotten as other studies have found (Camacho Reference Camacho2006, Rochera at al. 2010).
Acknowledgements
Fieldwork was supported by grant REN2000-0435-ANT from the Science and Technology Ministry (Spain) to AQ. Sample processing was supported by grant CGL2005-06549-C02-02/ANT from the Spanish Ministry of Education and Science to AC, which was co-financed by European FEDER funds. We are in debt to the UTM (Maritime Technology Unit, CSIC) and Las Palmas crew (Spanish Navy) who provided us with the logistical support to make possible this expedition. We especially thank the valuable input provided by Prof Warwick F. Vincent with his ideas and expertise during the fieldwork. The authors gratefully acknowledge the comments of Prof Berry Lyons during manuscript preparation. The constructive comments of the reviewers are also gratefully acknowledged.