The way governments in the advanced democracies intervene in the economy has changed dramatically since the heyday of the Keynesian welfare – and interventionist – state of the post-war ‘Golden Age’. During the ‘Trente Glorieuses’ of the post-war period, governments in almost all the Organisation for Economic Co-operation and Development (OECD) countries tried to tame capitalism by a number of economic policy instruments. To be sure, countries differed substantially in the use of these instruments (and differences tended to grow during the post-war decades), but at least as stylized facts we can characterize the interventionist state of the Golden Age as follows: important enterprises in public service provision, but also in the banking sector and heavy industry, were state-owned in many countries, which among other things allowed the control of strategic investment decisions and made labour hoarding possible. Product (and labour) markets were heavily regulated to prevent market failures. Subsidies were paid to a number of sectors for many reasons, including the cushioning of structural change and the establishment of domestic enterprises in sectors that were expected to be strategically important. Corporate tax rates were high in order to co-fund the growing welfare state, but generous exemptions also allowed governments to encourage investment in certain sectors or regions. The welfare state grew remarkably as ever larger parts of the population were covered by ever more generous programmes. Finally, welfare state growth, as well as governments’ attempts at mitigating the business cycle, led to a stark increase in government expenditure relative to gross domestic product (GDP).
With the end of the Trente Glorieuses, the interventionist state also came under pressure, as liberalization (which we use as a synonym for the retreat of economic intervention) became a key concept, first among economists and later increasingly also among policy makers. In this Review Article, we take stock of the development of the interventionist state since 1980 and what the academic literature has to say about it. We first provide evidence on how the interventionist state has developed. In the next step, we summarize 130 quantitative studies on five economic policy instruments and show that there is only limited agreement on the determinants of policies in the literature. Therefore, in the third step, we discuss the reasons for the disagreement and, in the final step, suggest ways forward.
We understand state intervention as a bundle of different policies that interfere with market processes or re-allocate financial resources and that are often, but by no means necessarily, meant to correct market outcomes and improve a country’s economic situation. Which policy instruments should be subsumed under this definition? The most general indicator of economic intervention is certainly total government expenditure as a percentage of GDP. We also include its main components, social spending and what Castles has called ‘core spending’ (i.e. overall spending minus social spending),Footnote 1 which allows us to control for varying spending dynamics in these different blocs.Footnote 2 Furthermore, governments intervene in the economy by regulating (product and labour) markets and by subsidizing enterprises, but they can also use state-owned enterprises for their economic policy goals. Finally, business taxation was often used to encourage and target investmentFootnote 3 and thus has to be considered as part of the interventionist toolkit, too.
While the literature usually discusses separately the various policy instruments that together constitute the interventionist state, we look at them concurrently, in order to understand better whether the retreat of government intervention is a general pattern or a sectoral phenomenon and to find out whether the same developments drive liberalization in these sectors or whether the dynamics of policy instruments differ.
Our contribution to the literature is twofold: first, we provide a comprehensive overview of the existing quantitative research on the retreat of the interventionist state in established OECD countries. By taking a broad approach which covers a variety of different policy instruments, we are able to look beyond individual economic policy indicators and assess what we know about the overall process of liberalization in the advanced democracies – an endeavour that, to our knowledge, has not yet been undertaken in the literature. Secondly, we identify the main challenges for further research and suggest ways forward to arrive at more robust and nuanced knowledge about the reasons for the retreat of the interventionist state. Thus, we call for more sophisticated theoretical models that not only allow for the deduction of hypotheses on direct effects, but that also consider conditional effects. Furthermore, we suggest making use of the variety of indicators that are currently employed to measure the same policy instrument by discussing why different indicators could be driven by different dynamics. Moreover, authors should reflect more why their results differ from those of other contributions and discuss the effects of differences in samples, periods of observation, indicators, and control variables on their results more explicitly. Finally, we propose to complement quantitative research with comparative case studies.
THE RETREAT OF THE INTERVENTIONIST STATE
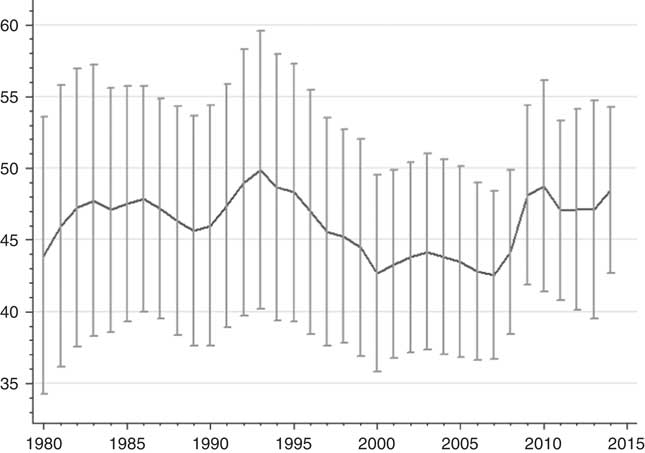
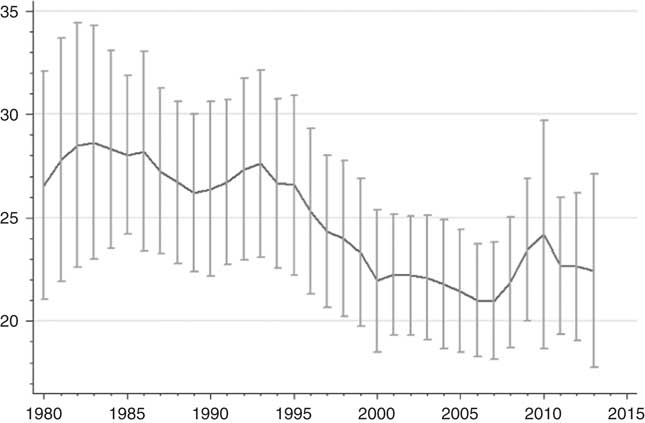
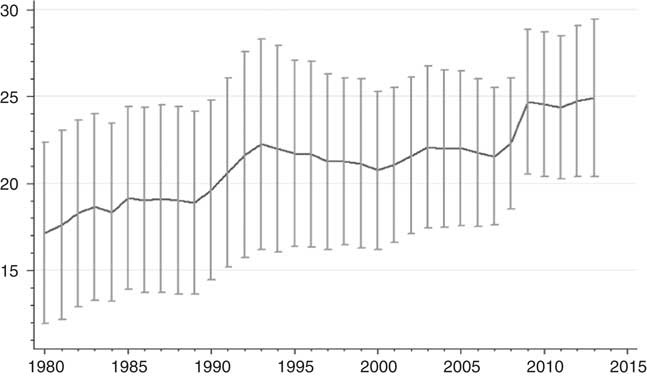
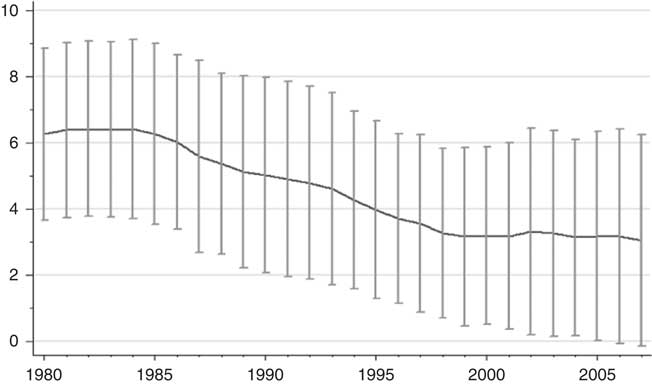
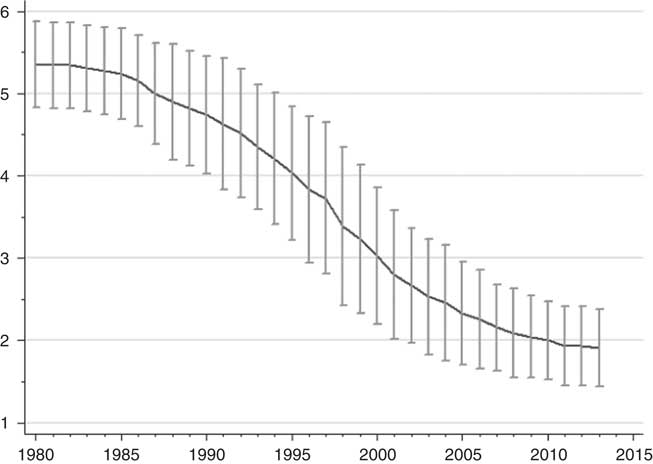
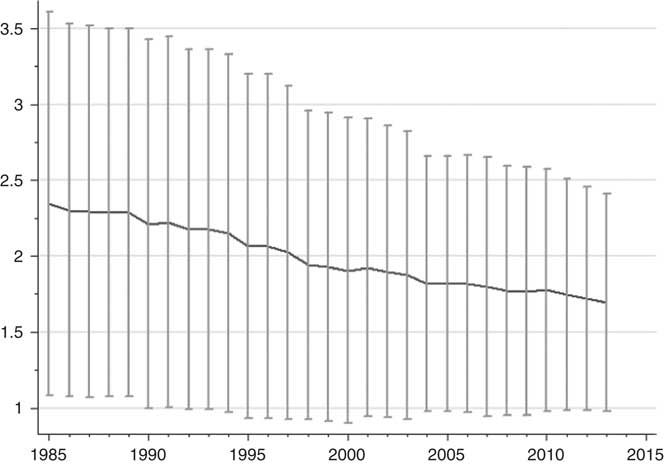
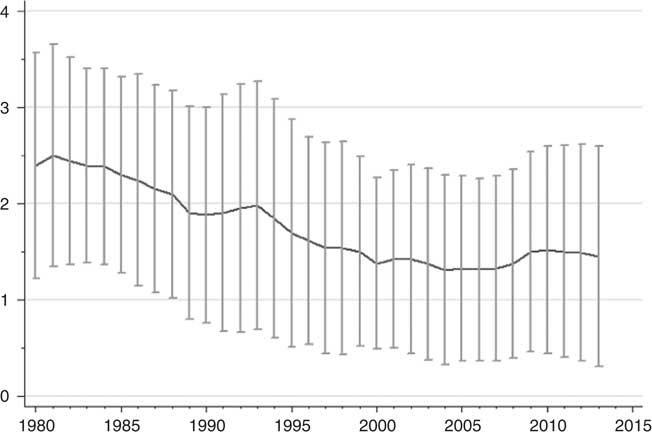
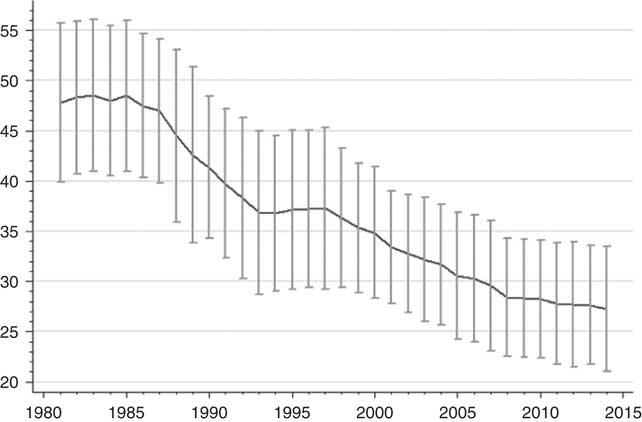
In the following, we take stock of the retreat of the interventionist state in twenty-one established OECD countries since 1980 by looking at a variety of indicators for our five policy instruments, namely government spending (total, core and social spending), state-ownership, regulation (of product and labour markets), subsidies, and business taxation.Footnote 4 In Figures 1 to 8, the bold lines show the mean value of the established OECD countries, whereas the development of the standard deviation is represented by the grey bars.
Total government expenditures (in % of GDP), OECD-21, 1980–2014 Data source: OECD Economic Outlook, No. 91.

Core government expenditures (in % of GDP), OECD-21, 1980–2013 Data source: OECD Economic Outlook, No. 91 and OECD Social Expenditure Database.

Social expenditures (in % of GDP), OECD-21, 1980–2013 Data source: OECD Social Expenditure Database.

Index of public entrepreneurship (in % of GDP), OECD-20, 1980–2007 Data source: Obinger, Schmitt and Zohlnhöfer (Reference Obinger, Schmitt and Zohlnhöfer2014).

Product market regulation, OECD-21, 1980–2013 Data source: OECD Indicators of Product Market Regulation (Conway and Nicoletti, Reference Conway and Nicoletti2006). Note: Data for the United States are largely missing.

Employment protection legislation, OECD-21, 1985–2013 Data source: OECD Indicators of Employment Protection (OECD 2015), average of regular and temporary employment.

Subsidies (in % of GDP), OECD-21, 1980–2013 Data source: OECD Economic Outlook, Nos. 84 and 90.

Corporate income tax rates, OECD-21, 1981–2014 Data source: OECD Tax Database.

We start by looking at total government expenditures as a share of GDP – the most general indicator of government intervention. As Figure 1 makes clear, the percentage of average expenditure declined for some time after the beginning of the 1990s, from 49.9 per cent of GDP in 1993 to 42.5 per cent in 2007. This trend seems to have been reversed since the global financial crisis, however, as total outlays were back at 48.5 per cent in 2014.Footnote 5 Moreover, the trend is not universal. While some countries, notably Ireland, the Netherlands, New Zealand and Sweden, experienced substantial declines, other countries remained comparatively stable over time or even increased public spending.
The trend towards liberalization is more pronounced when looking at ‘core’ spending, i.e. government spending excluding social spending (Figure 2). Peaking at 28.6 per cent of GDP in 1983, core government expenditures fell to about 21.0 per cent in 2007. Things look very differently for social expenditure which has increased almost continuously from 17.8 per cent of GDP in 1980 to 25.0 per cent in 2014 (Figure 3).Footnote 6 Only the Netherlands records a (slight) decrease of their social spending in that period. These diverging spending trends can be interpreted in two ways: either along a ‘new politics of the welfare state’ logic as a conscious decision of policy makers to focus cuts on non-welfare spending as the politically easier target; or as a reflection of the more pronounced increase in demand for social spending relative to the demand for core spending items like government investment or defence.
The retreat of the interventionist state is very obvious again regarding privatization and the importance of state-owned enterprises: using Obinger, Schmitt and Zohlnhöfer’s index of public entrepreneurship which essentially measures the economic importance of state-owned enterprises via their turnover as a percentage of GDP,Footnote 7 government intervention decreased continuously from the middle of the 1980s until 2000 and remained stable afterwards (Figure 4).Footnote 8 Interestingly, the relevance of public enterprises decreased in almost every country after 1980.
Using the OECD index of product market regulation,Footnote 9 we can identify a strong and steady decline of regulatory provisions over time (Figure 5). This trend was particularly pronounced in the 1980s and 1990s. Although it has slowed down recently, it has not yet come to a halt. Interestingly, the decrease of product market regulation is present in every individual country – with the exception of the United States, which was already at a particularly low level in 1980. The dramatic dimension of this change is underlined by looking at the mean of the OECD regulation index that ranges from 0 to 6: while the OECD-21 countries averaged at 5.3 in 1980, their mean fell to 1.9 in 2013.
In contrast, the strictness of employment protection legislation generally decreased only slightly between 1985 and 2013 (Figure 6). Only some of those countries with particularly strict levels of protection during the post-war period recorded a stronger decline. The overall picture is more clear-cut, though, when solely considering temporary employment with a decline of regulation intensity.
As another indicator of state intervention in the market process, subsidy spending also declined continuously since 1980, from 2.4 per cent of GDP in 1980 to 1.4 per cent in 2013 (Figure 7). In some countries with comparatively low levels in 1980, state aid expenditures remained stable, but for most of the countries, we can identify a reduction. We again observe a slight increase in subsidy spending after 2007 which is likely to be driven mainly by a decline of GDP.
Finally, regarding corporate tax rates, we also find evidence for a retreat of the interventionist state (Figure 8). The mean rate for the OECD-21 fell from 47.8 per cent in 1981 to 27.2 per cent in 2014. At the same time, these tax rate cuts have been accompanied by substantial base-broadening.Footnote 10 While this strategy has helped governments to defend their business tax revenues, in the process policy makers had to give up tax allowances that were meant originally to encourage investment or target investment to particular sectors or regions.
To sum up the analysis of the different indicators, we find strong evidence for a substantial reduction of government intervention in the economy after 1980. This finding of a less interventionist state holds for almost all OECD countries and all sectors of economic policy with the exception of social spending.Footnote 11 Moreover, in the aftermath of the financial crisis, other spending categories also fail to indicate a continuation of the liberalization trend, while the general trend towards less government intervention holds even in times of the economic crisis for taxation and regulation.
EXPLAINING THE TRANSFORMATION OF THE INTERVENTIONIST STATE
What accounts for the retreat of the interventionist state in the OECD? In order to answer this question, we took stock of the empirical literature on the five economic policy instruments under review here. We aimed at selecting all relevant quantitative studies that analysed one (or occasionally more than one) economic policy instrument in OECD countries and that were published in an English language journal from the year 2000 onwards. For policy instruments that are analysed comparatively rarely (e.g. regulation and subsidies), we also looked at book chapters. Furthermore, we occasionally added non-English language literature if we felt that the respective contributions added significant new insights. In sum, we included 130 studies (for the complete list see Online Appendix 1).
While we believe that we thus provide a broad overview over an important literature, we should also be explicit about the limitations of our review. First, we focus on the advanced democracies of the Western world. Although some of the studies covered here also include developing countries, we focus on the OECD members. Therefore, we remain silent about the development of the interventionist state in the developing world and its determinants. Secondly, we have coded only quantitative large-N studies because these studies aim at discovering general patterns among most or all advanced democracies. For this reason, we had to ignore case studies for the most part.
The studies were coded systematically. The main elements of the coding scheme (which is available in Online Appendix 2) were the operationalization of the dependent variable, the independent and control variables (concept, measurement and effect), the sample, the period of observation, and the method used. Moreover, we coded whether interaction effects were tested (and if so which ones), in which kind of journal a paper was published (political science, economics or other), and whether the study focused on the effect of a particular independent variable or aimed at explaining as much variance as possible.
In our review, we focus on five main explanatory variables which have turned out to be particularly prominent in the literature, namely globalization, Europeanization, learning and emulation, socio-economic problems and the partisan composition of governments.Footnote 12 The first three of these variables could be summarized under the label of diffusion, as globalization can be understood as diffusion via competition and Europeanization can be seen as diffusion via coercion (or conditionality).Footnote 13 Although these different mechanisms are sometimes difficult to disentangle empirically,Footnote 14 we think it wise to discuss them separately for two reasons. First, which diffusion mechanism is at work is interesting in itself, and so they need to be distinguished. Secondly, parts of the literature, while interested in the same phenomena, discuss globalization and Europeanization without any reference to diffusion. In order to discuss these substantively related literatures together, we distinguish between globalization, Europeanization, and learning and emulation.
For the sake of clarity, we do not provide detailed references in the text in this section. Instead, they can be found in Online Appendix 3 in tabular form.
Globalization
Since the 1990s, a tremendous amount of research has tried to assess the impact of globalization on government intervention. At least two schools of thought can be distinguished (apart from the null hypothesis that globalization does not have any effect at all). Compensation theorists argue that globalization will induce an increase in government intervention. The reason is that internationalization, even if it were beneficial for the economy at large, would hurt some groups of the population that, in turn, would ask for compensation in the form of government intervention in the economy. Efficiency theorists, in contrast, hold that globalization, by offering capital owners an exit-option, leads to a retreat of government intervention.
Regarding the empirical conceptualization of globalization, Leibrecht and Hochgatterer have suggested a distinction between two generations of studies testing the effects of globalization on economic policy instruments:Footnote 15 the first generation of studies investigates whether an indicator of globalization – e.g. trade, capital openness, or aggregate measures like the KOF indexFootnote 16 – exerts an effect on the policy instrument under study. Second generation studies move a step further and model the strategic interaction of governments under conditions of globalization. In the following, we take advantage of this distinction.
The effect of globalization has been tested most extensively with regard to corporate and capital taxation.Footnote 17 Significant negative effects of various indicators of globalization or positive signs of a country’s size are found by 73 per cent of first generation studies,Footnote 18 while only 7 per cent of the studies find a compensation effect. Similarly, second generation studies on corporate taxation unanimously demonstrate that countries respond to tax policy changes in other countries in a competitive manner. Thus, recent empirical evidence strongly suggests that globalization has indeed induced the retreat of government intervention in corporate and capital taxation.
Things are less clear-cut regarding other policy instruments. While 31 per cent of the studies analysing the effect of economic openness on total outlays of government corroborate the efficiency hypothesis, a slightly smaller number reports a significant positive globalization effect (25 per cent).Footnote 19 Moreover, slightly more studies (44 per cent) fail to find significant globalization effects on public expenditure at all. Findings are similarly inconsistent for social expenditure,Footnote 20 as studies report positive (23 per cent), negative (32 per cent), or no (45 per cent) effects of globalization. Second generation globalization studies find results that corroborate the efficiency hypothesis.
Similarly, half of the (first generation) privatization studies controlling for globalization find that internationalization triggers the disposition of state-owned enterprises, while the other half of the relevant studies does not find significant effects.Footnote 21 Although these finding are thus not conclusive, at least we do not find studies that claim a compensation effect of globalization on state-ownership. The few studies that can be regarded as second generation globalization analyses on privatization also corroborate the efficiency hypothesis, since domestic privatizations are positively affected by privatizations in countries that are closely related economically.
Regarding subsidies and regulation things are even fuzzier.Footnote 22 Here, the plurality of studies report insignificant results for globalization indicators (47 per cent each). Moreover, among the scholars who do find significant results, more point towards efficiency effects (29 and 37 per cent, respectively) than towards compensation effects (24 and 16 per cent, respectively).
Additionally, a number of studies suggest that globalization effects are conditional upon other variables, i.e. globalization only exerts an impact on domestic policies under certain conditions. A wide variety of suggestions has been put forward regarding the conditioning variables, which are, however, rarely tested in more than one contribution. Some authors argue that the institutional setting matters. Thus, Ha finds a globalization-induced compensation effect on social expenditure only in countries with few veto players;Footnote 23 similarly, Hays reports that consensus democracies reduce capital taxes less than Westminster democracies in response to globalization.Footnote 24 Other authors emphasize that the co-ordination of the political economy or the welfare state regime conditions globalization. For example, Swank and Jensen argue (for taxation and transfer spending, respectively) that globalization primarily makes itself felt in liberal market economies.Footnote 25 Similarly, Kim and Zurlo, Leibrecht, Klien and Onaran, and Onaran, Boesch and Leibrecht show (for social expenditure and taxation, respectively) that welfare state regimes condition globalization.Footnote 26 Furthermore, scholars identify interaction effects between globalization and deindustrialization on social benefits.Footnote 27 Finally, Swank argues that the partisan composition of government filters the effects of globalization on tax policies.Footnote 28
Europeanization
Europeanization might also be an important factor in explaining the retreat of the interventionist state, at least in those countries that are members of the European Union (EU). EU membership may have induced liberalization in a number of ways. First, for product markets, the single market programme could be of prime importance as the European Commission has pushed for liberalizations in a number of important markets, from telecommunications to transport and electricity. The relevant directives essentially forced member states to liberalize the respective markets, even in cases in which the member states had originally been opposed to the deregulation.Footnote 29 Secondly, the European Commission operates a formally rather strict regime of state aid control (Article 107.1 TFEU (formerly 87.1 TEC)), particularly after Regulation 659/1999 came into force.Footnote 30 This could have led to substantial reductions in subsidies in member states. Thirdly, the Maastricht deficit criteria and their follow-up in the Stability and Growth Pact may have limited governments’ financial room to manœuvre. Although the Maastricht criteria did not demand any precise fiscal policy measures, they put pressure on many governments to reduce their deficits (and debt). This may have led EU members to cut certain spending items more than other countries or it may have induced a search for new revenues, not least privatization proceeds. In contrast, corporate and capital taxes are unlikely to be increased because the internal market intensified the competitive pressure already discussed under the heading of globalization.Footnote 31 These pressures, in turn, may have led to an even more pronounced downward pressure among EU countries.
Surprisingly, then, the effects of Europeanization are tested comparatively rarely in large-N studies. In particular, studies that look at capital taxation or employment protection hardly ever control for EU membership.Footnote 32 Similarly, only a minority of the studies on total or social expenditures include EU or Maastricht indicators.Footnote 33 Worse still, the findings are ambiguous: some authors report no effect of EU or EMU (European Monetary Union) membership (50 and 63 per cent, respectively), while others report a negative effect (50 and 38 per cent, respectively). To the best of our knowledge, no study finds a positive effect of EU/EMU membership on public or social spending.
In contrast to analyses of taxation and spending, the majority of studies looking at privatization, subsidies, and product market regulation do test whether the EU has an effect on the respective dependent variable.Footnote 34 These studies tend to find that membership of the EU or EMU induces more privatization, less subsidies, and more liberalizations of product markets (59, 75 and 43 per cent of studies, respectively). Furthermore, a number of studies on privatization suggest that the effects of the EU may be more nuanced than is often assumed. Fink and Schmitt find diverging effects of the EU, depending on the sector being analysed: according to these results, privatizations in telecommunications and electricity are triggered by EU membership, while in the railways sector EU members privatize less.Footnote 35
Learning and Emulation
Learning or emulation might be additional factors that can explain the retreat of the interventionist state. For example, policy makers might observe that liberalizations succeed elsewhere (either in terms of policy consequences or political effects)Footnote 36 and might thus decide to adopt the same policies domestically, i.e. they might learn. Alternatively, they might simply emulate policies more or less regardless of their success simply in order to conform to their peers in other countries or international epistemic communities.Footnote 37
Surprisingly, only comparatively few quantitative studies have discussed diffusion via learning or emulation as an explanation for the retreat of the interventionist state.Footnote 38 To the best of our knowledge, there are no quantitative papers that deal with diffusion processes in the areas of employment protection legislation and subsidies, for example. Moreover, the relationship between diffusion and social expenditures is largely unexplored, too.Footnote 39 Learning has received slightly more attention as a mechanism of policy diffusion in studies on taxation. Jensen and Lindstädt, for example, argue that governments in one country respond to corporate tax cuts adopted by left (but not by right) parties in other countries.Footnote 40 The reason is that governments assume that left parties in other countries would not cut taxes unless they possessed some private information about the beneficial impacts of tax cuts – from which the other governments then also want to benefit. Cao, in a study on capital taxation, finds that membership in intergovernmental organizations triggers policy diffusion.Footnote 41 As these effects are particularly strong for minimalist organizations in the field of economic policy, he concludes that learning is the main driver of these diffusion processes. Similarly, Meseguer finds that learning can explain the adoption of privatizations, as countries are more likely to divest state-owned enterprises when they observe that this policy has been successful elsewhere.Footnote 42 Similarly, Levi-Faur finds that ‘European states were receptive to learning, voluntary and complex patterns in the transfer of liberalization’.Footnote 43
Nonetheless, Meseguer also identifies emulation as a relevant trigger, since the likelihood of domestic privatizations increases with the number of other countries that have privatized already. Fink, in his analysis of privatizations in the telecommunications sector, makes a very similar argument because he, too, argues that with every further privatization, the policy gained legitimacy and became a ‘natural’ response to certain economic pressures regardless of partisan orientation.Footnote 44 Relatedly, Kogut and Macpherson find ‘an important impact of American-trained, and especially University of Chicago-trained, economists on adoption’ of privatizations.Footnote 45 This means that economic ideas have diffused from the United States to many other countries via epistemic networks. Similarly, Jordana, Levi-Faur and Fernández i Marín point out, in a study on the diffusion of regulatory agencies, ‘the increasing importance of social networks of professionals, regulocrats, and epistemic communities’.Footnote 46
Some other studies find that more than one diffusion mechanism seems to be at work. For example, Henisz, Zelner and Guillén report that market-friendly reforms in the areas of telecommunications and electricity were diffused via coercion by international organizations, emulation and ‘competitive mimicry’.Footnote 47 The authors emphasize, however, that the various channels affect individual elements of reforms differently. Similarly, Pitlik reports strong diffusion effects in the area of regulation along various channels like learning and competition.Footnote 48
Finally, a few studies also look at variables that condition diffusion processes. Schmitt, for example, finds that the diffusion of privatization is more likely in open economies and less likely under left governments (at least in the telecommunications sector).Footnote 49
Socio-Economic Problems
Socio-economic problems (such as slow growth, high unemployment, or a high level of public debt) could also have triggered a retreat of the interventionist state. In accordance with much academic economic thinking since the 1980s, governments may have believed that liberalization is the best response to these challenges that might either have been produced by the changes in the international political economy discussed above or by changes in the structure of domestic political economies, particularly deindustrialization.Footnote 50
The evidence of existing studies is once again mixed, however, for most policy areas.Footnote 51 While some studies find a liberalization-triggering effect of slow growth and unemployment, other studies find that countries with few problems are more likely to liberalize. A substantial share of studies fails to find statistically significant results at all. Product market regulation results are the only ones that are uniform, as no study that tests for unemployment or growth finds significant coefficients.Footnote 52
Things are slightly more intricate with regard to public and social spending, because there is a near-automatic relationship between certain problem indicators, particularly unemployment, the elderly population, and economic growth and the development of expenditures.Footnote 53 Therefore, it is no surprise that 82 per cent of the studies on total expenditures that include economic growth and 63 per cent of these studies that control for unemployment find that slow growth and high unemployment cause an expansion of spending (76 and 62 per cent for the studies on social spending). Around half of the relevant studies also corroborate the expectation that old age dependency ratios, or a state’s demography more generally, drive up spending – and capital tax rates. Nonetheless, although the number of studies that find the opposite effect is rather small, a substantial part of the literature does not find any significant effect of demographic variables at all.
As far as studies test for deindustrialization, which is only the case for analyses on total or social spending, results are similarly inconsistent.Footnote 54 Following Iversen and Cusack’s seminal article,Footnote 55 more than half of the studies on public or social expenditures identify deindustrialization as a driving force of spending (67 and 46 per cent respectively). The other studies, however, find no or even negative effects.
The state of public sector finances also can be hypothesized to play a role in the politics of liberalization. It is important to keep in mind, however, that not all policies will be affected by high deficits and debt in the same way. While it is plausible that fiscal problems will trigger privatizations and reductions in public spending, things are different when it comes to taxation. As tax reforms usually go along with revenue shortfalls, it may well be that tax cuts become more likely as government finances improve. Product market regulation, in contrast, could be unaffected by the state of the public purse. Empirically, these hypotheses are by and large corroborated for taxation.Footnote 56 With only one exception, all studies on corporate and capital taxation that control for public debt find significant coefficients (86 per cent). Accordingly, high public debt is associated with higher tax rates on capital and corporate income. The findings on subsidies are also relatively clear, as all studies that control for the state of public finances find that they drive subsidy expenditure in the hypothesized direction.Footnote 57
The results for privatization are less clear cut. While 35 per cent of the studies find that high deficits or debt induce privatizations, the majority of studies do not find significant coefficients.Footnote 58 Surprisingly, maybe, deregulation also seems to be a response to high deficits or debt, according to 38 per cent of the studies. Others, however, report insignificant results (38 per cent) or even find an increasing probability of deregulating reforms in countries with higher budget surpluses.Footnote 59
Most studies on total or social expenditure do not include indicators for the state of public finances at all, not least due to a substantial problem of endogeneity. From those that do, some authors state that higher deficits are associated with decreasing expenditure (63 and 33 per cent, respectively), whereas others yield positive effects of public debt (38 and 40 per cent, respectively).
Political Parties
Partisan differences are a prominent variable in most studies on the interventionist state. That is not surprising given that economic policy is at the core of the left–right divide and the distributive conflict is still the most important cleavage in most party systems in the advanced democracies. The obvious expectation is that social democrats and other parties of the left favour more state intervention while liberal or conservative parties promote liberalization. Centre parties and Christian democrats should position themselves somewhere in the middle. Therefore, according to partisan theory, a retreat of the state from intervening in the economy should be the result of a substantial shift to the right in the composition of governments of advanced democracies since the 1970s. Intuitively, this argument seems to have some plausibility as some of the major proponents of a retreat of the interventionist state came from conservative parties, in particular Margaret Thatcher in Britain and Ronald Reagan in the United States. Moreover, in one of the few studies focusing on the timing of reforms, Bortolotti and Pinotti show that privatizations are more likely to start earlier under governments of the right.Footnote 60 Nevertheless, there is no trend of rising power of right or declining power of left parties since the 1970s. So it seems that the trend towards liberalization was at least not reversed (and may even have continued) when social democrats took over power.
This fact might have to do with the programmatic revision that took place in many left parties. As is well known, at the turn of the century many social democratic parties, most notably ‘New’ Labour in Britain, overhauled their economic policy positions in order to make them fit in with the new realities of globalization (and other challenges).Footnote 61 Nevertheless, the literature that looks into the question of whether programmatic revisions of parties reflect globalization essentially argues that social democrats responded less to globalization than their competitors and, if they did so, they behaved in a more welfare-friendly way.Footnote 62 Therefore, partisan differences may have remained relevant.
Indeed, a number of studies still find that parties make a difference when it comes to intervention in the economy. Again, these effects are not as clear cut as one might wish. With regard to core economic policy issues like privatization and regulation, slightly less than half of the studies do find either a liberalization enhancing effect of right parties or an impeding effect of left parties (45 and 41 per cent of the respective studies).Footnote 63 Other studies do not find partisan differences, however, while a third group of papers finds that parties made a difference in the 1970s and 1980s, but have not done so since the 1990s – an interpretation that would fit with the above argument that right parties may have spearheaded the liberalization trend but that left parties have followed suit with some time lag. This argument is incompatible, however, with the results of studies that find partisan effects until recently,Footnote 64 or that do not find partisan effects despite a period of observation that goes back into the early 1980s.Footnote 65
A similar picture emerges for studies investigating capital and corporate taxation:Footnote 66 55 per cent of the respective studies report that right parties (in contrast to left parties) tend to cut these taxes more or respond earlier to changes in tax rates elsewhere, while other studies find no statistically significant partisan effects.
Most studies on total public expenditure find no significant effect of right or left governing parties (68 per cent), although there are some notable exceptions.Footnote 67 In contrast, notwithstanding their small number, studies analysing core expenditures consistently report partisan effects. Findings on social spending are by no means uniform again;Footnote 68 while 61 per cent of the studies do not find partisan differences in times of austerity, 26 per cent still report partisan effects.
Finally, subsidies seem to be a special case.Footnote 69 While the majority of studies do find that parties made a difference at least at some point, most of these studies (and 44 per cent of all relevant studies) find that left parties reduce subsidies more than right parties. One reason for this remarkable result could be that subsidies are transfers to a core constituency of right parties, namely business.Footnote 70
Moreover, some studies discuss partisan effects as conditional upon other factors: Kwon and Pontusson as well as Potrafke find (for social spending) that parties become more relevant under conditions of globalization, while Obinger, Schmitt and Zohlnhöfer show that globalization does at least not confine governing parties’ room for manœuvre when it comes to state ownership.Footnote 71 Furthermore, the latter authors also find that partisan differences were accentuated during the run-up to the Maastricht criteria while they are reduced by the European Union’s single market programme. Kwon and Pontusson provide evidence that left incumbency matters more for welfare spending when the left government can rely on strong societal supporters, an argument resembling the work of Alvarez, Garrett and Lange, and later Garrett alone.Footnote 72 Additionally, a pro-welfare opposition hinders right parties from implementing their social policy preferences.Footnote 73 Some authors also find that institutional pluralism limits the ability of governing parties to implement their policy preferences, while others fail to find this effect.Footnote 74
Summary
What does this overview of the academic literature tell us about the determinants of liberalization? It is not easy to deduce general patterns. There is some evidence that globalization could be responsible for the overall trend of liberalization. Although in all sectors except for capital taxation evidence is somewhat mixed, we can at least say that the majority of papers since 2000 do not find compensation effects. Similarly, Europeanization does seem to be a relevant driver of liberalization. That is particularly true in the fields of privatization, product market regulation and subsidies; but also total public spending could be negatively affected by membership in the EU according to a substantial number of studies. Although the variable is rarely tested in studies on capital taxation, where it is, the effect is similar. The effects of socio-economic problems are somewhat unclear but seem to vary according to the policy instrument under investigation and the problem indicator employed. Debt, for example, seems to reduce tax cuts and trigger the curbing of subsidies while effects on other policy instruments are ambiguous. In contrast, unemployment drives spending upwards (as does an ageing population) but does not seem to have an effect on product market regulation (neither does growth) while its impact on other instruments is controversial. With regard to the effect of the partisan composition of government, it is difficult to come to definitive conclusions. There are still numerous papers that report partisan effects, particularly in studies on capital taxation, privatization and product market regulation, but a significant number of other studies fail to find that parties still matter. Finally, it is hard to deduce more general patterns from the diffusion literature once studies testing the competition mechanism are subsumed under globalization. The reason is that the number of quantitative studies focusing on learning or emulation is still comparatively small.
In sum, while we can draw some conclusions on the determinants of liberalization, disagreement is the prevailing pattern. Surprisingly, however, with the exception of the effects of socio-economic problems (and parties with regard to subsidies), patterns do not differ particularly strongly between the various policy instruments – especially given the substantial disagreements we find in the literature on the individual policy instruments. Therefore, it does seem to make sense to look for common determinants for the retreat of government intervention in the economy.
WHERE DO THE DIFFERENCES COME FROM?
The previous section has demonstrated that with some exceptions there is hardly much agreement in the scholarly literature on the reasons for the retreat of the interventionist state – not even when the same policy instrument is analysed. So we cannot be sure whether globalization drives privatization, whether partisan differences still matter in the setting of corporate tax rates, or whether unemployment and sluggish growth drive subsidies up, down, or not at all. This is certainly an unfortunate state. We think that the first step to improve this situation is to understand potential reasons for the disagreement in the literature.
A first reason for the different results even among studies analysing the same policy instrument may be the choice of different dependent variables. In the welfare state literature, the dependent variable problem is widely discussed and it is understood that the choice of a particular dependent variable can drive results.Footnote 75 Similarly, scholars have discussed the best way to measure capital or corporate taxation – by statutory, average effective, or marginal effective tax rates.Footnote 76 The problem is particularly evident in studies on privatization. The dependent variables used to measure privatization in the studies covered here include (but are not restricted to) the following: privatization proceeds,Footnote 77 privatization incidence,Footnote 78 number of privatization transactions,Footnote 79 percentage of stock sold,Footnote 80 level of state ownership in the dominant provider of infrastructure services in certain sectors,Footnote 81 year of certain privatizations,Footnote 82 change of an index of economic relevance of state-owned enterprises,Footnote 83 and the number of employees in public enterprises (weighted by public influence over the enterprise) relative to total employment.Footnote 84 As the individual operationalizations vary even further and as sometimes only an individual sector, sometimes a number of sectors and, in other contributions, the whole economy is analysed, it may be less surprising that the results of these studies diverge.
While these problems may be less significant in other areas, they cannot be neglected there either. For example, the definition of what constitutes subsidies or state aid differs between the Organisation for Economic Co-operation and Development (OECD) and the EU as the two most important suppliers of the respective data and some authors look at subsidy spending relative to GDP,Footnote 85 while others investigate the share of subsidies in the overall budget.Footnote 86 Even with regard to product market regulation, where the majority of studies rely on data provided by the OECD, these problems prevail. This is because, on the one hand, the OECD data have been repeatedly revised while, on the other hand, some scholars have used the Fraser Institute’s Economic-Freedom-of-the-World-Index.Footnote 87
Secondly, it may also be the case that the operationalization of the independent variables causes differences. For example, Adam, Kammas and Lagou report that the findings of studies on capital taxation and globalization tend to depend on the globalization indicator used.Footnote 88 Similarly, analyses of public and social expenditure using the KOF index or FDI quite robustly fail to report significant effects of economic integration,Footnote 89 whereas the effects for trade openness are highly inconsistentFootnote 90 – with the implication that we cannot rule out globalization effects on the basis of these studies. Furthermore, effects might depend on whether the globalization indicator is included in the statistical models in levels or changes over time.Footnote 91
Thirdly, the samples as well as the periods of observation tend to diverge. While most authors focus on the advanced democracies of the OECD and the EU, some analyse developing and advanced countries at the same time.Footnote 92 Moreover, the papers focusing on advanced democracies rarely use the complete sample of OECD or EU countries or at least the complete sample of the long-established and larger members of these institutions (EU-14; OECD-18; OECD-21) – for reasons that are not always made explicit. Given that none of these studies approximate a random sample and given the small number of cases, it is indeed possible that the inclusion or exclusion of a country may alter the results significantly.
The period of observation may also be relevant because the effects of certain variables may change over time. This is particularly the case with regard to globalization which may have only started in earnest after 1990 with the end of the Cold War. If that were true, the relevant effect should only materialize after 1990. Thus, earlier studies may have found no efficiency effects of globalization simply because the effects only unfolded after their period of observation ended. Indeed, while studies on social spending that go back into the 1960s or the 1970s often find positive effects of economic openness,Footnote 93 studies focusing on more recent periods more often than not find efficiency effects.Footnote 94 Likewise, Adam, Kammas and Lagou, in their meta-review on capital taxation, report that studies tend to find larger efficiency effects the more recent is the final year of their period of observation.Footnote 95 Similarly, a number of studies on privatization, regulation, social spending and subsidies argue that partisan differences existed until the 1980s but disappeared in the 1990s.Footnote 96 Finally, Brady and Lee, in their study on public expenditure, also find remarkably varying patterns over time.Footnote 97
The financial crisis of 2007–09 could mark a further break in the development of the interventionist state, as governments responded to that crisis and the recession that followed it with substantial spending increases (see Figure 1 above) and even occasional nationalizations. It is unlikely, however, that the diverging results reported above are to any substantial degree driven by the inclusion or exclusion of the years after 2007. As discussed above, at least in the short and medium term, the response to the crisis only seems to have affected the spending indicators while the trends in regulation and corporate taxation have not yet changed significantly (cf. Figures 5, 6 and 8).Footnote 98 If we focus on spending indicators, there are not more than a handful of studies that include years after 2007.Footnote 99 The findings of these studies do not diverge systematically from results of papers that exclude the years after 2007.
Fourthly, divergent findings may result from divergent methods and specifications. The variety of methods used in the papers reviewed here is tremendous, ranging from event history analyses and fuzzy set Quantitative Comparative Analyses (fsQCAs) to panel regressions with or without spatial lags or fixed effects – to name just a few. Given that even minor variations in model specifications can lead to significantly different substantive results,Footnote 100 the diverging results do not come as a surprise either. The findings of Busemeyer, Bradbury and Crain, Liberati, and Rodden support this suspicion:Footnote 101 whereas cross-section models yield positive effects of trade openness on public expenditure, the effect is reversed (or at least disappears) for most of the models applying time-series cross-section specifications.
Fifthly, differing control variables may also be a factor in explaining the divergent results. For example, Adam, Kammas and Lagou report that studies on tax competition that include government spending as a control typically find an efficiency effect of globalization, while studies that fail to control for spending do not.Footnote 102 Likewise, in the study of Hicks and Zorn, including fiscal controls in a model uncovers a (previously insignificant) positive effect of left parties on the occurrence of social expenditure cuts.Footnote 103
Looking at the 130 studies analysed here, it turns out that almost all studies control for globalization and the partisan composition of government (although they do not necessarily do so with the same data). Similarly, almost all studies control for some indicator of problem pressure; nevertheless, a divergence already starts to appear according to which problem indicators are used. To take the example of capital taxation, some studies control for unemployment or employment,Footnote 104 others for inflation,Footnote 105 some for the ratio of certain age groups (elderly, young, both) to the overall population,Footnote 106 others for growth or GDP per capita,Footnote 107 but no study controls for all of these variables nor is there a single variable that is controlled for in all studies. Looking at studies analysing the other policy instruments yields similar results. Moreover, control variables like the power of trade unions, institutions, EU membership, or diffusion are far less regularly included in the relevant studies, let alone variables controlling for the respective variety of capitalism or the position of the median voter or the party system’s centre of gravity which are hardly ever included.
Finally, the differences may be due to diverging underlying developments in the varying sectors. As argued above, EU membership seems to have a differing impact on privatizations depending on the sectors analysed. Similarly, individual social policy programmes have been shown to follow completely different logics regarding the impact of political parties and economic globalization.Footnote 108 As a consequence, we should not necessarily expect to find the same results if we take a disaggregated view on a policy field or analyse different sectors.
WHERE SHOULD WE GO FROM HERE?
The previous section has shown that there are a number of different reasons for the lack of agreement on the determinants of the retreat of the interventionist state. Therefore, in our view, future research should consider four main points which might make it easier to come to more consistent and at the same time more nuanced conclusions. These points refer to the theoretical models upon which empirical studies are based, the choice of the dependent variable, the empirical approaches these studies apply, and the combination of quantitative large-N studies with comparative case studies.
First, more sophisticated theoretical models should be applied. Currently, most authors only discuss and empirically test direct effects of their independent variable of interest. But, to take just one example, the causal chain from globalization to changes in economic policy instruments is comparatively long. It thus seems highly plausible that globalization effects will be modified at the domestic level, as some studies have already suggested.Footnote 109 Similarly, the occurrence of diffusion processes, interesting as it is in itself, does not tell us much about the conditions under which governments learn or feel that they should emulate others. Again, the studies by SchmittFootnote 110 and others suggest that domestic factors seem to matter in this regard. Therefore, scholars should think more about which factors may condition the effects of globalization, Europeanization, learning and emulation, and even socio-economic problems on the interventionist state.
Moreover, these conditioning variables should not be chosen in an ad hoc manner but should rather be deduced systematically. A model of political decision making might be useful in this regard.Footnote 111 One could start from the observation that the relevant policy changes – tax cuts, privatizations, spending cuts, liberalization of markets etc. – need to be adopted by veto players.Footnote 112 Thus, the institutional set-up of a policy might make a difference and could be a first candidate as a conditioning variable: the more veto players exist and the lower their congruence, the less likely globalization and other factors will induce liberalizations.
Veto player theory does not theorize where veto players’ policy preferences come from and how they change. However, this is the decisive factor if we want to understand the transformation of the interventionist state. As most veto players are political parties in the advanced democracies, the literature on the goals of political parties can be used to endogenize veto players’ preferences and explain when parties will adopt liberalizations. Parties are expected to adopt policies according to their programmatic stance but at the same time they want to secure re-election.Footnote 113 The policy-seeking motivations of parties suggest that left parties will be more reluctant to roll back the interventionist state than bourgeois parties. Thus, it makes sense to investigate whether the partisan composition of the government conditions the effects of globalization, Europeanization, learning and emulation, and socio-economic problems.
Nonetheless, parties also want to win elections and, therefore, electoral competition can mediate the impact of the triggers of liberalizations, too. For example, Ward, Ezrow and Dorussen argue that the effect of globalization on parties’ economic policy positions is moderated by the position of the median voter.Footnote 114 If the median voter is comparatively right-leaning, social democratic parties will have to adopt more business-friendly policy positions even in the absence of globalization in order to be able to win elections. As a consequence, globalization does not induce a rightward shift of social democratic (and in turn also bourgeois) parties’ policy positions in these constellations because the parties have already shifted their positions in that direction in response to the median voter. If the median voter is left-leaning, however, globalization will induce a rightward shift of social democratic parties because the policy positions they would have taken in the absence of global markets are no longer credible under conditions of globalization. This argument can easily be applied to study the effect of globalization (and other triggers of liberalization) on interventionist policies.
Electoral competition could also exert another conditional effect.Footnote 115 Generally, governing parties can be assumed to be risk-averse under conditions of intense electoral competition. This means that they will normally shy away from more far-reaching liberalizations because the success of these reforms is uncertain and policy failures are potentially costly in terms of votes. If, however, re-election is threatened, parties are likely to become risk-seeking. Therefore, if the failure to adapt to globalization or Europeanization induces economic problems that endanger the government’s re-election, the governing parties might become willing to adopt extensive liberalizations in order to improve the economic situation. Similarly, parties might be more willing to learn or emulate policies from abroad if the economic situation makes re-election doubtful. Thus, the effects of globalization, Europeanization, and learning or emulation might be conditional on the severity of problems a government faces.
One could continue to deduce factors that may moderate the effects of globalization, Europeanization, learning and emulation, and socio-economic problems on the interventionist state, but even this brief discussion shows that we can plausibly expect not only to find interaction effects, but we can also systematically derive them from theoretical models of political decision making. While a few studies actually have tested some of these interactions, we should include them much more systematically in future research.
Secondly, we should be more alert that the choice of the dependent variable plays an important role – and we should take advantage of this fact theoretically. As shown above, in many cases a variety of indicators is used to measure the same policy instrument – which is one of the reasons for diverging results in the literature. In many cases these differences go way beyond technical details about the quality of data. Therefore, rather than simply assuming that the various dependent variables measure the same thing and debating which indicator is the most reliable, scholars should discuss whether and why different indicators could be driven by different determinants. To give an example: while both the determinants of privatization proceeds and of the incidence of privatization may teach us something, it may not necessarily be the same thing: for instance, privatization proceeds may be driven by the development of stock markets – when stock markets boom privatizations will produce higher revenues – while this is not necessarily the case for privatization incidence. Similarly, at least theoretically, it is more likely that privatization proceeds are driven by government deficits or debt than privatization incidence because if governments seek to improve public finances by selling off state-owned enterprises they will try to maximize proceeds. This may lead them to dispose of many state-owned enterprises, but it may also induce a focus on only a few, lucrative ones. In the latter case, we would find the expected effect of a government’s financial situation only for proceeds, but not for incidence. Similar arguments could be made for other economic policy instruments. Therefore, rather than assuming that the different dependent variables measure the same thing, we should discuss more explicitly if and why different indicators could be driven by different determinants – and should in turn test these arguments empirically.
A similar logic applies when we think about the dependent variables’ different levels of aggregation. The welfare state literature and studies on privatization that have analysed sectors separately have shown that different programmes and sectors tend to exhibit different dynamics. Thus, it is probably fruitful to look into these sectoral dynamics to understand better what drives these diverging developments: What makes privatization in telecommunications different from railways or postal services? Does the liberalization of the railway sector display different patterns compared with the liberalization of telecommunications? Questions like these deserve more attention.
However, we should not restrict ourselves to ever more disaggregated analyses only. As we have seen above, the retreat of the interventionist state is a phenomenon that is evident in a number of policy instruments and affects all advanced democracies. So we also should ask what drives this overall development. A careful aggregation of policy instruments, as for example suggested by Höpner et al.,Footnote 116 should therefore also be considered. While following this approach will probably lead to a loss of some nuance, it may provide us with a clearer overall picture of the retreat of the interventionist state. One reason for this is that interventionist policy instruments could to some extent be substitutes for each other. For example, if a government heavily regulates a sector, it may not need to subsidize or nationalize enterprises in that same sector and vice versa. If this were the case, we could observe differing sectoral patterns although the underlying process of liberalization of the economy as a whole is the same. We know next to nothing about these relations so far, so research would be very welcome here.
At the same time, it is of utmost importance to proceed carefully when aggregating indicators of government intervention. If the dynamics of different indicators follow significantly different trajectories, aggregation does not seem feasible. Thus, it is questionable whether it is wise to include social policy and economic policy indicators into one aggregate indicator as social spending does not seem to follow a trajectory that is similar to that of most economic policy indicators. In this case, it may be more interesting to understand the reasons for the dissimilar development.
In order systematically to understand similarities and varying dynamics in different sectors (or different dependent variables in the same sector), it would also be necessary to analyse different dependent variables with an identical set of independent variables,Footnote 117 the same sample and time period using the same estimation strategy.Footnote 118 This procedure would help establish a better understanding of whether the retreat of the interventionist state is driven by sector-specific dynamics or by one (or more) broad developments that affect all sectors. In order to analyse whether patterns change over time, a similar approach should be used, i.e., using the same dataset and estimation procedure and only modifying the period of observation.
Moreover, a further dependent variable that may be worth analysing more is the timing of reforms. Only a very few studies have looked at when liberalization takes place – and the ones that exist have usually restricted themselves to one policy instrument. If we subscribe to the view that changes in economic policy instruments are related to one another, it might also be interesting to find out whether the retreat of the interventionist state exhibits a particular pattern according to which most countries start liberalization in a specific sector, then move on to specific other areas while avoiding liberalization in a third group of sectors.Footnote 119
Thirdly, authors should reflect more on why their results differ from those of other contributions and discuss the effects of differences in samples, periods of observation, indicators, and control variables on their results more explicitly. Thus, we should do whatever possible to clarify where differences between our findings and previous research come from. If we introduce a new way of measuring (an aspect of) the interventionist state, for example, and our findings diverge from previous findings, we should also run our models with already established indicators. If our sample includes countries or time periods that other studies were unable to include, we should check whether the inclusion of these additional observations drives our results. We should also consider the possibility that the inclusion of control variables may impact overall findings. By implication, we should make sure to include as many controls that have been found to be important in previous research as possible; similarly, if we introduce a control variable that has not (regularly) been employed in other relevant studies, we should report whether or not the inclusion of this new control variable affects the results. Moreover, given that even small differences in model specification can have a tremendous impact on the final results,Footnote 120 authors should test (and report) specifications that have been used in previous publications in addition to the specification they deem most appropriate for their specific research question. Even if authors deem specifications used in previous articles inappropriate, reporting them will make it easier for the scientific community to detect how different findings can be explained.Footnote 121
Finally, it will be indispensable to complement the quantitative studies that we have focused on in this contribution by comparative case studies. Process tracing of liberalization policies in selected instances ‘is a key technique for capturing causal mechanisms in action’.Footnote 122 Ideally, a single research project would combine macro-quantitative methods with in-depth process tracing which would allow the establishment of a clear nexus between the quantitative and case study parts of the research. For example, a regression analysis could identify typical cases which could then be chosen as cases for process tracing. The case studies would then investigate whether the presumed causal processes actually were in place. Alternatively, deviant cases can be subjected to process tracing in order to explain why they do not fit the general pattern. Despite a number of pitfalls that need to be taken seriously,Footnote 123 this kind of mixed-methods research promises to help solve a number of the problems we have outlined in this article.
CONCLUSION
In this Review Article, we have shown that the advanced democracies have scaled back government intervention in the economy substantially over the past thirty years. This trend comprises all economic policy instruments but does not seem to have affected social expenditure to a similar extent. In the economic policy domain, however, almost all states have witnessed liberalization in all areas under study here.
In the existing quantitative literature that seeks to explain the retreat of economic intervention disagreement prevails. There is some evidence that globalization and Europeanization are important drivers of liberalization policies; in contrast, the picture regarding learning and emulation, socio-economic problems, and political parties is mixed. Nonetheless, the results for most of our central explanatory variables do not differ significantly regarding the respective indicator of state intervention, so a broader perspective on liberalization as a whole seems to be fruitful.
The reasons for the disagreement can be found in varying country samples, periods of observations, model specifications, and control variables. We also point to the problem of wildly diverging dependent variables that are nonetheless expected to proxy the same developments and at the relevance of different levels of aggregation of the dependent variable (e.g., sectoral regulation/privatization vs. economy-wide regulation/privatization). Therefore, we suggest that future research needs to discuss much more explicitly the effects specific decisions concerning the choice of dependent and independent variables, country sample, period of observation, etc., have on the results to allow the scientific community to assess where varying results come from. Moreover, differing results for different dependent variables should not only be discussed in terms of the validity and reliability of the respective indicators; rather, scholars should consider whether the respective indicators capture specific dynamics other indicators do not capture – which would allow a substantive interpretation of deviant results for different indicators. Likewise, research will probably benefit from the use of slightly more elaborate theoretical models. It seems likely that domestic variables condition the effects of globalization, Europeanization, learning and emulation, and even socio-economic problems on national policy making. These interaction effects should be modelled more systematically than has so far been the case. Finally, a combination of quantitative methods and process-tracing seems particularly promising. If these suggestions were to be taken up by many researchers, we are confident that in the future we would know much more about what drives the retreat of the interventionist state.