INTRODUCTION
Crabs are conspicuous inhabitants of intertidal areas and, sometimes, form dense populations which play important ecological roles. Many species, belonging to different families have a set of physiological and behavioural traits that allow them to cope with the changing environmental conditions of such habitats. Particularly important among these traits is the usage of refuges. The quality and quantity of refuges (burrows in muddy or sandy shores, cobbles or crevices in rocky shores) are important factors regulating populations and may restrict the abundance of a specific size-class or ontogenetic stage, thus creating a shelter limitation bottleneck (Caddy, Reference Caddy1986).
The varunids (Varunidae) are an example of crabs that live both in soft and hard intertidals. The south-western Atlantic temperate shores are dominated by three species of varunids: Neohelice granulata (formerly known as Chasmagnathus granulatus) is an estuarine crab that burrows in soft sediments; Cyrtograpsus angulatus is a highly euryhaline species that inhabits both estuarine sandy or muddy beaches and marine rocky shores and it is relatively independent of the refuge availability; and Cyrtograpsus altimanus is restricted to areas rich in refuges in marine coasts and, occasionally, in the lowest part of estuaries (Scelzo & Litchestein de Bastida, 1978; Spivak, Reference Spivak1997). The present knowledge about the natural history, population and reproductive biology and ecological role of these three species is disparate: N. granulata and C. angulatus have been intensely studied, and the former became a standard model for studies of physiological and biochemical adaptations to transitional environments between the sea and land (Anger et al., Reference Anger, Spivak, Luppi, Bas and Ismael2008; Spivak, Reference Spivak2010); C. altimanus, instead, has been scarcely studied in spite of being frequently found in many areas along their distribution range (Boschi, Reference Boschi1964).
Cyrtograpsus altimanus Rathbun is a small crab (maximal size 20 mm carapace width (CW)) endemic to the south-western Atlantic. This species was described by Rathbun (Reference Rathbun1918) from individuals of a population inhabiting a mussel bed in northern Patagonia. It may reach high densities in marine shores covered with stones or shells, used as refuge (Spivak, Reference Spivak1997). In spite of being a common constituent of the intertidal communities along its distribution range between Río Grande (Brazil) and Chubut (Argentina), the only studies related to its ecology and life history correspond to Buenos Aires coastal areas. Scelzo & Lichtschtein de Bastida (Reference Scelzo and Lichstchein de Bastida1978) described the larval development in the laboratory with some comments about its ecology, Gavio (Reference Gavio2003) studied the population structure, growth, maturity size, reproductive period and mating system in a population from Santa Clara (36°56′S 58°11′W) and López-Greco & Rodríguez (Reference López-Greco and Rodríguez2004) estimated the fecundity, reproductive effort and maturity size of females from a population at Jabalí Island (40°32′S 62°15′W)
The purpose of the present study was to describe the structure and dynamics of a population of C. altimanus inhabiting the extensive intertidal beds of the small mussel Brachidontes rodriguezi Footnote 1 in San Matías Gulf (northern Patagonia, Argentina), under the hypothesis that this complex structure provides crabs suitable refuge for settlement and development. Additionally, new information on reproductive traits is reported.
MATERIALS AND METHODS
Study area
The sampling site is located in San Antonio Bay (40°46′S 64°50′W), an inlet of the north-western coast of San Matías Gulf, Río Negro province, Argentina. Semidiurnal high amplitude tides (9 m) characteristic of the Patagonian coast cover and uncover twice a day an extensive cobblestone intertidal area. Parallel to the main channels that drain the intertidal along 8 km, huge populations of the small mussel Brachidontes rodriguezi, form a dense belt of several metres width and about 10 cm thickness. This three-dimensional structure hosts high number of invertebrate species (crustaceans, annelids, molluscs and sponges among others) in the spaces among shells (Vázquez, personal observation) as was observed in populations at other localities (Scelzo et al., Reference Scelzo, Elías, Vallarino, Charrier and Lucero1996; Adami et al., Reference Adami, Tablado and López Gappa2004). Average winter and summer temperatures are 7.8°C and 22.6°C (July and January respectively) (Servicio Meteorológico Nacional, Argentina).
Sample processing and data analysis
The mussel bed was sampled 11 times from October 2000 to January 2002, monthly during spring and the beginning of autumn (October to April 2001), bimonthly in winter (June to August) and monthly during the following summer (December 2001, January 2002). Each time, ten 1200 cm3 samples were collected (except January, June and August 2001, when N = 5) randomly with a cylindrical sampler of 100 mm diameter. Each sample consisted of several thousands of B. rodriguezi individuals adhered among them and to cobbles by their byssal threads, thus forming a complex structure with free spaces which hosted C. altimanus and other invertebrate species.
Since all crabs collected on the mussel bed were smaller than the maximum sizes reported for the species, an ancillary sampling was performed in February 2007 at the cobblestone area adjacent to mussel beds. There, all crabs present in 10 square areas 0.5×0.5 m, placed at random along the narrow area about 2 m width between the low tide edge and the mussel bed, were collected by hand at low tide. To minimize the possibility of escape, a square frame was kept surrounding each sample, while cobbles were removed cautiously.
Samples were immediately transported to the laboratory and frozen at –20°C before processing. Crabs were separated by hand and fixed in 4% formalin after de-freezing, sized (maximal CW) and separated into four classes: males; non-ovigerous females; ovigerous females; and juveniles (= morphologically undifferentiated crabs).
Crab density was expressed as the number of crabs/1200 cm3. Monthly crab densities were compared with one-way analysis of variance (ANOVA) and the a posteriori Tukey test was applied when significant differences existed (Zar, Reference Zar2010). Sex-ratios departures from expected 1:1 ratio for each month and for all months together were analysed with Chi2 test. Crabs were grouped in size-classes of 0.25 mm for juveniles (<3mm CW, genital pores not evident) and of 0.5 mm for larger individuals. Size–frequency distributions (SFD) were constructed separately for males, females and juveniles. Modal components of each distribution were estimated with a modification of the method developed by McDonald & Pitcher (Reference McDonald and Pitcher1979) where observed SFD were fitted to the expected values of a mixture of normal distributions by the least squares method (see Bas et al., Reference Bas, Luppi and Spivak2005 for details of procedure, parameters and restrictions of the method). Growth data obtained by Spivak (1999) and Gavio (2003) for this species were used as guide to evaluate the reliability of the differences between successive modes. Given that the number of replicates of each group was variable (larger modes appeared only in some samples, see below) it was not possible to use a two-way ANOVA and differences among consecutive modes and between sexes were evaluated separately with one-way ANOVAs. Since no differences appeared between sexes (see below), comparisons among consecutive modes were made pooling modal values of males and females. Modes 1 to 8 were compared in one analysis and modes 9 to 11 in another, since the last group presented greater variances than the former, as expected.
Between 10 and 42 females per sample, from all the size-range, were used to estimate the size of morphological maturity, measuring the maximal width of the third abdominal segment (AW) and the CW. Females were considered mature when the third abdominal segment reached the coxae of the adjacent pereiopods (Spivak, Reference Spivak1999). However, a broad range of forms of the abdominal segments were present in a wide range of CW and so, the maturity condition was not easily assigned to one of each category. Because of that, the size at 50% maturity was estimated following Somerton (Reference Somerton1980). According to this method, the data from the smallest and biggest individuals, that could be surely defined as immature and mature respectively, are used to fit straight lines by regression and then, data of uncertain immature and mature individuals are assigned iteratively to the closest line until the best assignment is obtained. After evaluating the statistical significance of the fitting, compared to the fitting to a single line, the size of 50% maturity is estimated by fitting a logistic function to the proportion of mature and immature individuals assigned to each size-class. After all samples were sized, it was evident that in some months, the maximal sizes of females with immature characteristics were larger than in others. In consequence, monthly samples were grouped based in the similitude of those ranges and separately analysed.
To analyse the availability of refuge in the mussel bed, the structural components of 250 ml sub-samples of each sample were subsequently separated and their elements classified as B. rodriguezi shells, other biological components (mainly barnacle and mollusc shells), cobblestones and fine material (sand and shells debris). The volume of each fraction was estimated by volume displacement in a graduated 200 ml test tube. Brachidontes rodriguezi shells were sized (shell length, SL) and monthly SFD histograms were plotted.
RESULTS
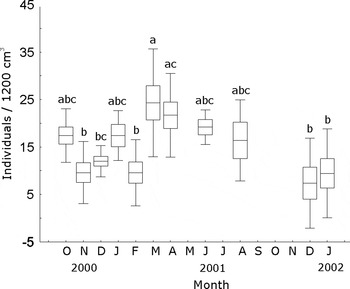
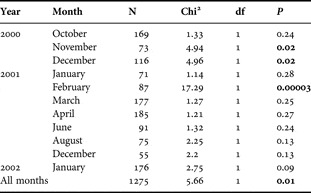
A total of 1470 individuals were measured in samples from mussel beds, 595 males, 680 females and 195 juveniles. The density of crabs was variable among samples (average 14.7 ± 9.2 crabs/1200 cm3) in all sampled months. Differences among sampling dates were significant (ANOVA, F = 4.84; P < 0.001). The a posteriori Tukey test showed no clearly separated groups. The highest average densities occurred in March and April (autumn) and the lowest in most of summer months (Figure 1). The sex-ratio was biased to females (Chi2 = 5.66; P = 0.017) when all samples were pooled. In the monthly analysis, November and December 2000 were dominated by females while males were the majority in February 2001; in the remaining months, the sex-ratio was 1:1 (Table 1)
Cyrtograpsus altimanus. Average density of crabs per sample at each sampled month. Horizontal lines inside boxes: mean. Box: standard error. Vertical lines: standard deviation. Different letters indicate significant differences among densities.

Cyrtograpsus altimanus. Results of the Chi2 tests of the monthly and total deviations of the estimated 1:1 sex-ratio in samples from the mussel bed area. Significant P values in bold.

N, number of adult individuals.
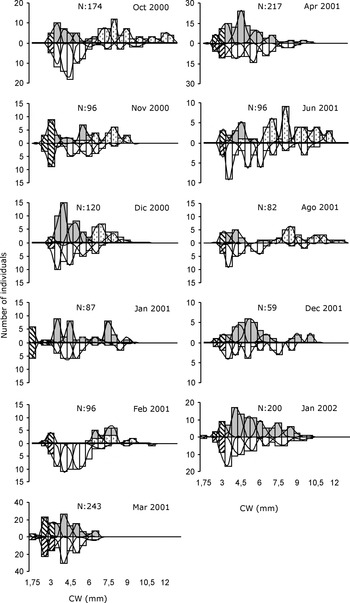
The SFD of crabs were polymodal (Figure 2). The smallest and largest size-groups of crabs were not always present. The intermediate modal groups, however, appeared in all samples, even when their proportion varied. Seven modes were detected in male SFD, ten in female SFD and two in juvenile SFD. Modal values were denominated M1 to M12; M1 and M2 corresponded to juveniles, M3 to M9 to both males and females, and M10 to M12, the largest crabs detected, were females present only in winter and at the beginning of spring.
Cyrtograpsus altimanus. Size–frequency distributions (carapace width (CW), mm) at each sampled month. Stripped bars: juveniles (half of the total number was assigned to each sex); white bars: males; grey bars: non-ovigerous females; spotted bars: ovigerous females.

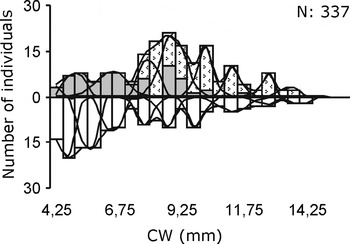
In the ancillary sample from cobblestone area adjacent to the mussel's bed, 283 individuals were sized: 174 females and 109 males. The sex-ratio was biased to females (Chi2 = 14.92, P < 0.001). The average density was 137 ind./ m2. Crabs below 3 mm CW (juveniles) were not present. Modal values of ‘cobble' females corresponded to modes M4 to M12, of ‘mussel bed' females. Larger crabs were more represented (maximum CW = 13.3 mm). The first five modes of ‘cobble' males corresponded to mussels bed modes M4 to M8 and four larger groups (M9 to M12) appeared, reaching 16.6 mm CW (Figure 3).
Cyrtograpsus altimanus. Size–frequency distributions (carapace width (CW), mm) of the ancillary sampling in February 2007. References as in Figure 2.

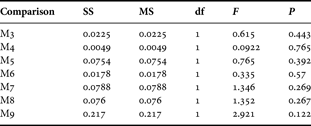
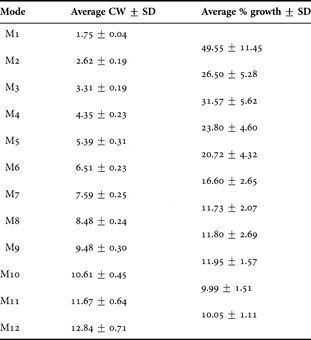
The comparison between modes of males and females showed no significant differences at least until M9 (Table 2). M10 to M12 were not statistically compared because of the low number of replicates. All modes differed from each other (ANOVA M1 to M8: df = 7; F = 1278.25; P < 0.01 and ANOVA M9 to M12: df = 3; F = 57.37; P < 0.01; Tukey tests, all pair wise comparison P < 0.01). Growth was evidenced by the shift of SFD modal classes to the right in successive months; however, in June and August, the SFD were almost identical, suggesting that growth was interrupted during the cold season. The differences between successive modes decreased with size: the difference was highest (more than 50%) between M1 and M2, it diminished to ~20% in the intermediate size-groups and to ~10% in the largest ones (Table 3). The smallest modal group (M1) appeared only in January and March, but M2, the following group of juveniles was usually present, except in winter and at the beginning of spring.
Cyrtograpsus altimanus. Analysis of variance table for the comparison between females and males modal sizes for each detected mode.
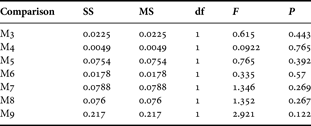
M3 to M9: modes 3 to 9 of the size–frequency distributions.
Cyrtograpsus altimanus. Average modal value of carapace width (CW: in mm) and growth increment (as a percentage ± standard deviation (SD)) between consecutive modes.

M1 to M12: modes 1 to 12 of the size–frequency distributions.
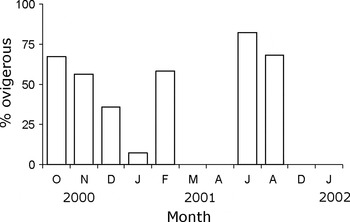
Ovigerous females were present in 7 of the sampled months at the mussel bed and were considered as an indication of reproductive activity. Reproduction peaked in spring, diminished until a minimum at mid-summer, and reached later a second peak at the end of that season. Autumn appeared as a resting period with no ovigerous females, and a new reproductive peak was present in winter, with more than 80% of females carrying eggs at that season (Figure 4).
Cyrtograpsus altimanus. Percentage of ovigerous females at each sampled month.

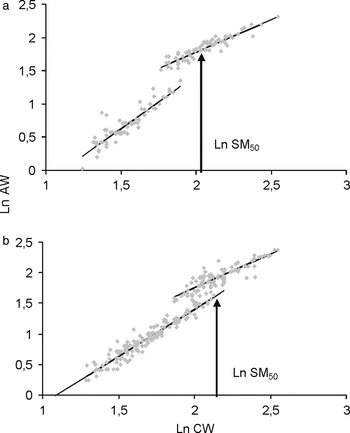
The linear growth functions (after transforming data as ln x) for AW versus CW were significantly different for immature and mature females. Size at maturity differed between winter–spring and summer–autumn females too. In samples from June, August, October, November and December 2001 and 2002 (winter and spring), immature and mature lines almost did not overlap and all females above 6 mm CW were mature; the SM50 for this group was 7.72 mm CW (95% confidence interval, 7.43–8.01 mm) (Figure 5a). In samples from January, February, March and April 2001, January 2002 and in the ancillary sample from February 2007 (summer–autumn), in contrast, lines overlapped extensively and many females above 6 mm CW (and even larger than 8 mm CW) were immature; the SM50 for this group was 8.57 mm CW (95% confidence interval, 8.32–8.92) (Figure 5b).
Cyrtograpsus altimanus. Estimated Ln of the size (carapace width (CW)) at which 50% of the females are morphologically mature (size of maturity50, SM50) in females from: (a) winter–spring; (b) summer–autumn.

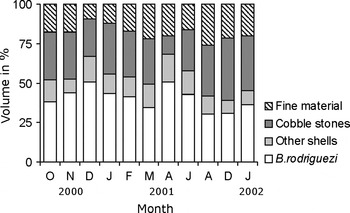
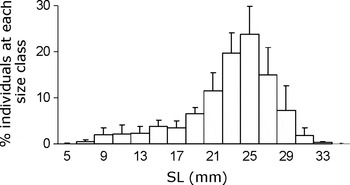
The 80% of the mussel bed was composed of Brachidontes rodriguezi shells, other biogenic structures (mollusc and barnacle shells) and cobblestones; the proportion of each component was relatively constant through the year (Figure 6). The remaining 20% of volume was fine material (sand and shells debris). A total of 4427 B. rodriguezi shells were measured. Their population structure was very stable along the sampling period, with an average of 82% (±9%) of the individuals included in one modal group (SL = 25 mm) and the remaining 18% (±5.9%) grouped into two small modes (SL between 7 and 17 mm; Figure 7).
Proportion of each structural element, forming the bed of the mussel Brachidontes rodriguezi, at each sampled month.

Size–frequency distributions (shell length (SL)) of the mussel Brachidontes rodriguezi shells from all samples pooled.

DISCUSSION
Population structure and growth
Size–frequency analysis depends on the clear identification of modes in the distributions. When this is possible, the analysis is simple and computer-based approaches are powerful tools. Nevertheless, since these approaches are flexible and need assumptions and starting points established by the user, they have to be used and interpreted with caution (Hartnoll, Reference Hartnoll2001). The results of this study were consistent: the modes in SFD of Cyrtograpsus altimanus from San Antonio were markedly separated in spite of the small number of individuals in some size-classes, and little variation was detected among modal values among samples. In addition, the differences between successive modes matched very well with the moult increments measured in juvenile and adult males and females of C. altimanus captured in the field and kept in captivity no longer than seven days (Gavio, Reference Gavio2003), and with growth data of crabs reared in the laboratory, from C1 to C6 (Spivak, Reference Spivak1999). The average M1 size (1.73 mm CW) corresponded to the size of the smallest modal class reported by Gavio (2003: 1.72 mm CW) and with the average size of the first stage crab cultured and described by Scelzo & Lichstein de Bastida (Reference Scelzo and Lichstchein de Bastida1978: 1.6 mm CW) both from populations from Buenos Aires Province, northward of San Antonio. However, the first stage of crabs obtained from megalopae of Mar Chiquita (Buenos Aires Province) were larger (Spivak, Reference Spivak1999: average 2.33 mm CW). In spite of the latter discrepancy, it seems reasonable to consider that M1 corresponded to the smallest (recently metamorphosed) settled crabs. The presence of M2 in all spring and summer samples suggests that, even when M1 settlers were not always detected, recruitment was more or less continuous between November and March. If this is so, eggs carried by females in winter would produce the new settlers of mid-spring (November), in accordance with a slower embryonic and larval development at low temperature
Reproduction
Two different strategies are commonly found in Brachyura living in warm-temperate coastal waters of the south-western Atlantic. The reproduction of some species takes place only in spring and summer: Neohelice granulata (Ituarte et al., Reference Ituarte, Bas, Luppi and Spivak2006) or Uca uruguayensis (Spivak et al., Reference Spivak, Gavio and Navarro1991). Other species carry eggs almost all the year: Cyrtograpsus angulatus (Boschi, Reference Boschi1964) and the platyxanthid Platyxanthus patagonicus (Leal et al., Reference Leal, Dima, Dellatorre and Barón2008). Gavio (2003) found ovigerous females of C. altimanus only in spring and summer in the intertidal population of Santa Clara, Buenos Aires (37°50′S 57°30′W), but Silva (Reference Silva2009) found them all year round except in April and May (autumn) in Mar del Plata harbour, 15 km southward. In San Antonio (this study) proportions of ovigerous females higher than 60% were present in spring, summer and winter months. The maximal proportion of ovigerous females in winter could be the result of a massive and synchronized event of mating after the resting period or just an effect of accumulation because of the slowing down of embryonic development at low temperature. Unfortunately, no information is available about any of these possible facts.
Sexual maturity of females
The variation in the size at maturity among individual females from the same population is commonly reported even when not explicitly referred and so, the size of mature and immature females are ranges that overlap and the intrapopulational differences in size at puberty moult between the largest and the smallest females in some species reach values of 300% (Hartnoll, Reference Hartnoll and Abele1982). The overlapping in size between mature and immature C. altimanus females was wider and the size at maturity larger, in summer–autumn than in winter–spring females. Size at maturity data have not been usually analysed on a seasonal basis, with the exception of a detailed study of growth in natural populations of Rhithropanopeus harrisii tridentatus at the Loire estuary (Marchand, Reference Marchand1979). Rhithropanopeus harrisii tridentatus females from the beginning and the end of the reproductive season reached maturity at a smaller size than those from mid-summer; this change in size at maturity was attributed to the higher temperatures and food availability at that moment (Marchand, Reference Marchand1979). Both factors have proved to exert a positive effect on growth rate (Hartnoll, Reference Hartnoll2001) and may explain the seasonal variation observed in C. altimanus: there are marked temperature differences between winter–spring and summer–autumn and presumably food availability is higher in warm months, allowing immature individuals to reach a larger size before the puberty moult. The same factors (temperature and food availability) and others, such as density or genetics, have been used to explain interpopulational differences in size at maturity of females of different decapod species (Gardner et al., Reference Gardner, Frusher, Barrett, Haddon and Buxton2006; Mellville-Smith & De Lestang, Reference Melville-Smith and De Lestang2006).
Refuge use
Mussel beds are excellent refuges for invertebrates (Adami et al., Reference Adami, Tablado and López Gappa2004) and megalopae of C. altimanus settling on B. rodriguezi beds could have high possibilities of survival to adult age. Nevertheless, habitat structure determines the maximal body size of associated fauna by constraint of their access and movement inside the spaces used as refuge (Hacker & Steneck, Reference Hacker and Steneck1990). The refuge availability is related to the size of shells and the degree of packing and was proposed to be a function of the fractal dimension of the refuge (Gutiérrez et al., Reference Gutiérrez, Jones, Strayer and Iribarne2003). Maximum size of B. rodriguezi is only 33 mm length, and they are densely packed, leaving small free spaces. Even when no attempts were made to estimate the real availability of free space, it appears to be stable along the year with no change in the proportion or size of mussel bed components, as was observed in other populations of B. rodriguezi (Adami et al., Reference Adami, Tablado and López Gappa2004). Then, crabs should leave this habitat when their body size and/or density reached dimensions incompatible with those available as refuge to establish in the adjacent stone bed where they reach bigger sizes. Flores & Negreiros-Franzoso (Reference Flores and Negreiros-Fransozo1999) observed a similar process in a Pachygrapsus transversus population inhabiting biogenic substrates of the mussel Brachidontes solisanus and the polychaete Phragmatopoma lapidosa. From the analysis of SFD and field observations, they concluded that crabs in that population settled in those substrates, but moved later, after reaching juvenile size, to rocky intertidal. Some experimental work should be necessary to accurately determine this migratory process in the C. altimanus population, and the possibility of a differential growth between habitats (and refuge size) cannot be discarded. Nevertheless, the fact that SFD of crabs from cobbles agree with, but also complement, those from mussel beds support the migration idea. In the same sense, it is worth noting that the largest size of females at mussel beds was 12.5 mm CW, and the largest male measured 10.5 mm CW (most large males have 9 mm CW). This difference could be explained by refuge size too, taking into account the high sexual dimorphism of this species. Cyrtograpsus altimanus males show positive allometry in chelar growth after reaching sexual maturity (6.7 mm CW: Gavio, Reference Gavio2003), and as a consequence their total volume is higher than those of females of the same CW.
This study is far from a comprehensive analysis of the life history and ecology of C. altimanus. Nevertheless, some relevant aspects were established and would serve as a basis to compare with other populations living in different environments in order to evaluate the effect of the environment on life history traits and the plasticity of the species. The presence of the mussel bed appears to be an important feature in the recruitment of C. altimanus in San Matías Gulf, where this species reaches the highest density reported. It would be of interest to study the settlement of this species in close areas where B. rodriguezi is absent to evaluate their effect on the mortality of the smallest size-classes.
ACKNOWLEDGEMENT
This project was supported by the Universidad Nacional de Mar del Plata (EXA 440), ANPCyT (Argentina PICT 21757) granted to E.S.