Introductory Context
This article looks at the creation of a high-impact corporate application of evidence-based thinking and practice, leading to the human resource management (HRM) Impact Award presented by the Society for Industrial and Organizational Psychology (SIOP) and the Society of Human Resource Management (SHRM) and their Foundations. The 2016 winner, Jack in the Box, Inc., demonstrated an evidence-based, model-driven longitudinal approach to their its employee survey, analytics, and management processes, leading to meaningful business results, including the ability to predict sales, profit, guest satisfaction and complaints, productivity, and employee turnover. Moreover, this article will discuss some of the actions the company took using these platforms to enhance its organizational effectiveness, and its recommendations to others based on what it has learned.
Today, the opportunities for industrial and organizational (I-O) psychologists and human resources (HR) professionals to have an impact on practices, decisions, and performance are huge. Although this alone is not new, in reality there are far too few public examples. The purpose of this article is to accomplish the following:
-
1. Deconstruct a high-impact result into its key ingredients
-
2. Share briefly the historical evolution of the thinking, analytic processes, and impact of this work, including key challenges that were overcome along the way
-
3. Provide a stakeholder view of the process and tools that are important to buy-in and implementation
-
4. Offer recommendations to I-O professionals and business leaders on how to craft such results
The process chosen to share this journey is to impart insights from different key stakeholders in the process: corporate leaders, internal champions, and external partners. All of these stakeholders played critical roles in the success of this effort.
I interviewed four stakeholders from Jack in the Box—Lenny Comma, CEO of Jack in the Box; Mark Blankenship, Chief People, Culture & Corporate Strategy Officer; Jerry Rebel, Chief Financial Officer; and Eric Tunquist, Vice President, Operations—as well as my partner on this journey with Jack in the Box, Jerry Seibert, Vice President of Assessment and Survey Services for Metrus Group, Inc. Lenny, Mark, and Jerry R. represent the views of senior leadership, with Mark serving as a champion for many years. Eric was the project leader for several years, viewing the effort from a different angle.
The questions were asked by me, so I will not repeat my name with each question, and the last names of the interviewees are noted in the answers. References were added to responses, and interviewees reviewed their edited remarks.
Before you describe the journey and impact, can you tell us a little about Jack in the Box?
Comma: We have two restaurant brands that we operate and franchise, including more than 2,200 Jack in the Box locations and over 700 Qdoba Mexican Eats fast-casual restaurants. We were founded in 1951 and are headquartered in San Diego. The organization is purpose-based and is steered by a set of guiding principles. Our purpose is, “To nourish the pursuit of dreams.” A unique aspect of our restaurant operations is that one can join with very little education and/or English language proficiency skills and still rise to achieve one's dreams.
What were the business challenges underlying this work?
Blankenship: Ten years ago, Jack in the Box was an organization that looked like many others in terms of measurement. We tracked many financial, operational, and people measures. Although we observed basic relationships between such measures (e.g., higher turnover was related to higher labor costs, higher food costs were related to lower profit), we did not have a unified model across these measurement dimensions that allowed us to understand and drive improved performance through restaurant leadership. Aside from the “cost of labor,” human capital metrics were not high on the radar of senior management at that time.
Comma: But being in a mature and largely commoditized service industry, Jack in the Box faces incredible competition in the burger and quick-serve market that forces tight margins for all players. A service business is highly dependent on labor. Inconsistency can kill the customer experience, and in the case of a highly branded business like Jack in the Box, it can injure the brand. Smiling, helpful employees in one location and disengaged ones in another are not good for consistent branding.
Over a decade ago, front-line turnover at Jack in the Box was close to 150% annually—typical for the industry. The shorter the employee tenure, the harder it is for a restaurant manager to consistently achieve high productivity and quality numbers, have sufficient employees cross-trained on different work stations, and delight guests on a regular basis. In short, people matter big time!
So what enticed you into more evidence-based thinking?
Blankenship: The first foray into predictive models occurred when our HR leaders began to socialize the concept of the service-profit chain (Heskett, Jones, Loveman, Sasser, & Schlesinger, Reference Heskett, Jones, Loveman, Sasser and Schlesinger1994). This framework links investments in people to business outcomes. This was potentially a way to think about how investments in people influenced restaurant results. With good measures, it would then be possible to learn how people influence productivity, customers, and financial performance. It wasn't until HR began to combine the independent data sets together to better understand how human capital metrics might be most relevant in a service-profit chain framework that the company got its first look at the statistical relationships among internal service (as measured by employee surveys), employee satisfaction, external service (as measured by customer satisfaction and mystery guest scores), and profits (Blankenship, Cetti, & Schultz, Reference Blankenship, Cetti and Schultz1999). These early analyses engaged leadership team members in thinking about what was strategic versus tactical (what moves our strategy forward, versus day to day process and tactical measures) and how all of these important constructs connect to one another. If they were validated, then management could begin focusing on human capital factors that were most important to achieving their strategic and operational goals.
What additionally was needed to help you make this practical for decision making and have real impact on the business?
Blankenship: The service profit chain philosophy was helpful, but a number of things were still lacking, for example, specificity. We needed a model that was more refined than simply saying higher employee engagement levels lead to guest satisfaction, which then leads to business results. Even if true, how would we increase employee engagement? What are the “drivers” of engagement? Which drivers would have more influence over engagement or guest results? It is easy to say employees drive customers who in turn drive financial results; it is harder to detect which specific areas are most controllable by management and will have the biggest influence on key business outcomes.
Tunquist: To be useful to restaurant managers, we needed everything we did to be very practical. So we needed a way to ferret out the critical few measures from the many available and come up with a way to help managers sort, sift, and use the information that is of most help to them. Ideally, we also wanted to go beyond segmentation—the grouping of people by such categories as generation, gender, job level. We wanted information that we could use to help understand individual differences and translate those differences into different developmental or performance plans.
Blankenship: Finally, even if we accomplished the technical aspects, nothing much would happen without buy-in and action by leaders and managers. So we needed to understand what it would take to secure a buy-in from key decision makers who would be using the information.
So there were really five challenges: specificity, practicality, individual relevance, prediction, and getting buy-in and action.
So, how did you begin to address these five key challenges?
Blankenship: In order to respond to these challenges, Jack in the Box teamed up with the Metrus Group using their People Equity concept (Schiemann, Reference Schiemann2009) to overcome these challenges. The People Equity model is their framework for understanding and measuring human capital, and has been an effective predictor of business results (Borg, Groenen, Bilsky, Jehn, & Schwartz, Reference Borg, Groenen, Bilsky, Jehn and Schwartz2010; Kostman & Schiemann, Reference Kostman and Schiemann2005; Schiemann, Reference Schiemann2012).
Seibert: People Equity includes three primary factors: alignment (A), capabilities (C), and engagement (E). Alignment is the degree to which everyone in the organization is rowing synchronously in the same direction. Strong vertical alignment would be indicated by behaviors that are aligned with the brand, goals, customers, coupled with units that are working synchronously together (horizontal alignment) across functions and departments. Capabilities is defined as the extent to which competencies, information, and resources are sufficient to meet internal or external customer expectations; and engagement, in the People Equity model, includes satisfaction, commitment, and advocacy (and more recently fulfillment; Schiemann, Reference Schiemann2016).
Jack in the Box is an ideal organization to conduct research because HR processes and policies do not vary across restaurant sites—every location has the same hiring, onboarding, training, compensation, and performance-management processes. This does not mean that HR processes are not important but that they tend to affect all restaurants in the same manner, and thereby are a constant. The use of this model and its application helped us address some of the five questions Mark described earlier.
Well, let's get specific. How did this model help in addressing some of those challenges?
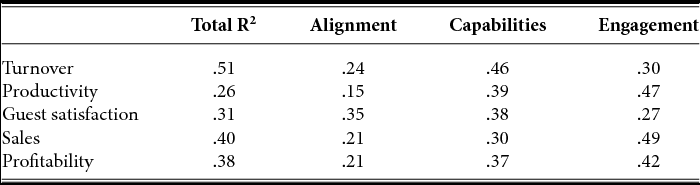
Seibert: Despite existing research on the efficacy of the model, we wanted to validate its ability to predict important business outcomes at Jack in the Box. (Note: More details will be discussed under the subsequent ROI question.) Sometimes what we found was surprising. For example, capabilities, rather than engagement, was the largest driver of turnover at Jack in the Box (accounting for 46% of the explained variance in turnover across sites), although engagement was the biggest predictor of productivity. Capabilities was also the largest predictor of guest satisfaction.
But stopping at this level of analysis would leave management wondering what to do if they want to increase capabilities and reduce turnover. Next, we used driver analysis (using relative weight analysis) to help pinpoint which drivers to focus on to increase alignment, capabilities, or engagement. For example, because of the importance of capabilities in predicting turnover, this analysis uncovered that effective training was about twice as important as improving teamwork or any other driver tested (e.g., confidence in the manager's leadership ability or the manager's effectiveness at making crew want to stay).
Tunquist: It turned out that in restaurants with low capabilities, the managers were often not ensuring employees got both hands-on and computer-based training before working at a new station. The survey, along with focus groups, pinpointed this “shortcut” as something that was counterproductive in a way restaurant managers were not realizing. Employees made more mistakes. Customers were unhappy. The half-trained staff was stressed. Their coworkers were frustrated, and guest satisfaction was down while turnover was up. But now, instead of debating what might be happening, we had the data to show managers exactly how their choices were connected to the outcomes.
Buy-in was one of the challenges mentioned earlier. How did you use this framework to convey important information to leaders and create buy-in?
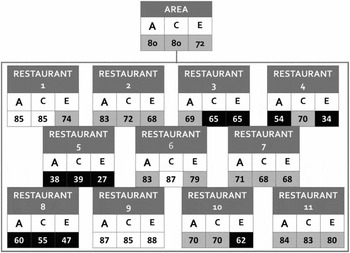
Tunquist: Good data visualization can be a surprisingly big help with that. We used ACE Scorecards™ mapped to our organizational chart (Figure 1), which really resonated with the leadership team. Both high- and low-performing units were easily identifiable, including those that were engaged but misaligned or struggling with capabilities. We saw every possible combination—high and low alignment, capabilities and engagement scores across the restaurants.
ACE scorecard.

Comma: This process was the linchpin to evidence-based HR. For a long time, about 50% of the leaders were committed; we were good at gathering data but were spotty and inconsistent on follow-up. A key to sustainable change was recognizing that the framework mirrored what we truly believed was important in our workforce—to have highly aligned, capable, and engaged people. I and my direct reports committed to discussing and acting on our data and to hold the next level of management accountable.
Rebel: Lenny Comma's personal commitment set a good example for other groups to buy-in. When managers sat down with their employees, they found that their actions were truly appreciated—even though everyone was really busy. It sent a piercing message of care.
Blankenship: A key was asking ourselves, “Why we are doing this and sharing that with everyone?” The mindset shifted from “I have to” to “I want to” do this.
What are examples of actions that had an impact, resulting from this process?
Blankenship: A good example was how we used survey results in designing and managing the role of district managers (DMs), who oversaw multiple restaurant managers (RMs). The feedback suggested that RMs wanted and needed more contact with their DMs, whose role allowed them to come and go as needed. We restructured the role, requiring far more face-to-face contact with RMs. The DMs did not like it at first (they rebounded the next year), but the RMs appreciated getting more support and ideas from their bosses.
Additionally, every restaurant must create an approved action plan that is reviewed by the district manager. The DM uses that to hold the RM accountable to their action items. The DM would work with each RM on their specific strengths and opportunities, which included things like hiring, onboarding, training, compensation, communication, rewards, and recognition. The ACE results directed the actions taken, which impacted much more than just turnover. As we discovered, these measurements were correlated with virtually every operation, financial, and guest metric. Thus, information helped us see a key gap in the value chain, take action, and then test our hypotheses.
Comma: Applying the framework also helped us clarify fit and helped leadership understand which people were willing to adapt. It also helped in succession planning. We reassessed some fast-track managers, recognizing that they were not equipped yet as people leaders to take the next step, and we found hidden leaders who were doing an outstanding job managing people.
We also aligned our leadership model (head, heart, hands) with ACE, which first gave clarity to leaders and employees about what was expected and second gave them permission to speak up about people, policies, or actions that didn't line up with those expectations. To be honest, this made ourselves as leaders more vulnerable but created far more transparency and effectiveness in our culture.
Blankenship: Last, we reshaped our reward and recognition system to be aligned with those expectations.
Why not just use engagement?
Blankenship: We had seen restaurants with similar levels of engagement but very different performance on other business metrics. It made sense to take a more nuanced look at what was driving those differences. Looking separately at alignment, capabilities, and engagement, as well as their respective drivers, enabled us to do exactly that. If we had lumped alignment, capabilities, and engagement all under the engagement rubric, we would have lost the power to differentially predict performance across the restaurants. It also meant we could better tailor interventions to the unique needs of managers.
Seibert: One of the biggest challenges in organizations today is moving away from one-size-fits-all solutions that provide “average” results to solutions that are fitted to the circumstances. Placing all managers in an engagement training program won't help those whose real challenge is keeping the team aligned and focused on the goals. To leverage information to stronger advantage, we have learned that we need to do a better job of understanding variance in almost every aspect of the operation, including employee attitudes. Prior to this analytic approach, Jack in the Box had to use more system-wide initiatives, regardless of where a particular unit was on a performance continuum. With their new analytics, they were able to pinpoint issues to particular locations, manager skills, or capabilities, and target limited resources more effectively.
Did you examine the ROI of this approach and investment?
Blankenship: The results are consistent and clear: restaurants with higher ACE scores outperform restaurants with lower ACE scores on virtually every operational and financial measure the company captures (see Table 1 for a summary of the variance explained by the model in several business metrics). For example, when comparing the performance of optimized versus suboptimized restaurants based on the ACE scores, optimized restaurants experience 21% less turnover and 10% higher productivity (in correlation terms, ACE accounts for 51% of the variance in turnover and 26% of the variance in productivity). When translated into dollars, this amounts to $27,000 in reduced turnover costs (cost to hire and train) and $72,000 in increased profits (which includes lower labor costs as a percentage of sales) per restaurant per year. The example Eric gave earlier about training shortcuts highlights how these statistical models translate into everyday reality.
Explained Variance and Relative Weights for ACE as Predictors of Business Outcomes

Tunquist: One of the actions we implemented was a training program for RMs who would be managing multiple locations. To run more than one site requires some real upskilling in both business and leadership skills. They need to learn better delegation, for example, because they split their time between restaurants. The managers who have gone through the program, regardless of whether they are ever given a second location, achieve more positive results as measured in the survey and better outcomes in most restaurant metrics.
Blankenship: The bottom line is that optimized restaurants have 10% higher sales and 30% higher profitability than suboptimized restaurants, on average. When those numbers are multiplied across the entire restaurant chain, the total is in the millions of dollars of real impact (Blankenship, Reference Blankenship, Ulrich, Schiemann and Sartain2015). When compared to the costs of doing surveys and taking actions to improve lower performing restaurants, even an investment of $1–2 million would certainly pay off. In reality, the costs are mostly time to refocus managers on blind spots and to improve their skills in creating an optimized unit—one with aligned, capable, and engaged people.
You also conducted some research with internal service functions, assessing the value they delivered to their internal stakeholders. Can you share more about the purpose of this research?
Blankenship: We felt that the service-profit chain could be extended to encompass the corporate support functions. Not everyone interacts with the guests, but everyone has a customer, and we would often hear from the field how a lack of apparent coordination at corporate could directly impact the restaurants. We had survey results for all the corporate functions, but unlike the restaurants, there was no convenient, uniform set of operational metrics for them.
So we collaborated with Metrus on an internal value assessment (IVA) to provide a number of support functions detailed feedback from their internal stakeholders on how they add value to those functions based on what they do and how they do it. They could see how well they were meeting the expectations of their stakeholders and creating value. In some cases, genuine service failures were identified, and in others we found misaligned expectations.
Seibert: We also applied some of the same analytic techniques used with the employee survey data. For example, using an “overall value delivered” rating as the criterion, we examined different deliverables and service dimensions as drivers of value. That helped the support groups understand what was really important to their internal customers and focus their limited resources in the most effective ways possible. The managers of those support groups essentially had a “functional 360” with an inside perspective from their ACE survey results and an outside-in perspective from the IVA.
This is also one of the ways that companies in industries where quantitative outcomes are not as easily measured can apply an evidence-based approach—every group or function has stakeholders who depend on them. Another approach can be as simple as setting annual goals for each department and tracking the extent to which departments meet them on a simple “met/partially met/did not meet” metric. That provides a consistent metric across disparate types of units that can be utilized in almost any industry.
This effort was a collaboration of Jack in the Box and Metrus Group on this journey. What can you share about this partnership in terms of achieving the outcomes you did?
Blankenship: Although we could conduct an employee survey ourselves, Metrus provided us with four important things. First, as an objective third party, they created a safe haven for employees to share their views candidly. Second, they brought state-of-the-art thinking and comparative insights they gather over many organizations. Third, although I am an I-O psychologist and we have others with such expertise who could read the data, Metrus brought analytic capability and a history of research that efficiently and effectively directed us to the important issues. Last, and very important to us, they are not transactional—they spent in-depth time from the beginning getting to know us and understand us—and that is reflected in how they have customized the toolkit for us.
Comma: You can find people to collect data and run analyses, but the benefit of Metrus was not only good data and insights, but bringing a passionate plea for action, calling out hotspots, and pushing us to make the most of the information. We have other partners who just provide data files.
Rebel: I would like to add that the partnership works because we share a common set of values.
Seibert: One of the key features of this partnership for us was Jack's willingness to experiment and continuously improve the predictive framework, and their tenacity to stay the course. This was only possible with strong, continuous support from the leadership team. Over the years we were able to adapt the survey instrument to changing organizational realities and strategic goals, maintaining trust, and confidence in the measurement tool. Also, they embraced the concept of building an aligned, capable, and engaged workforce—not simply a measurement tool but a continuous improvement process.
Another key is that the ACE instrument was customized to the uniqueness of Jack in the Box. Although alignment has been shown to be important to organizational performance in different models (Burke & Litwin, Reference Burke and Litwin1992; Nadler & Tushman, Reference Nadler and Tushman1997; Tushman & O'Reilly, Reference Tushman and O'Reilly1996), we have found that broad, generic alignment questions are less useful from a predictive or action perspective. Tailored questions designed to assess the level of understanding of the strategic priorities and goals were quite helpful. Do executives, managers, and employees understand and support those elements? Are department and individual goals, measures, and rewards aligned with those priorities? The customized ACE instrument is simply a reflection of their unique culture and their aspirations.
What would you do differently if you were starting again, and where do you go from here?
Comma: I would have developed our leadership model and guiding principles much earlier. This would have enabled us to set clear, specific expectations with accountability and commitment earlier.
Blankenship: I would have communicated why we do this earlier. Positive business outcomes are a result. For too long, we had measurement without accountability. Results and behaviors are equally important, and that needs to be communicated.
On the issue of where we go from here, a next big challenge is acculturating this into our franchise community where we do not have the control to say “do it.” We are formulating ways to create buy-in among those stakeholders.
What are some of the key lessons learned that might be applicable to other organizations?
Comma: Don't be afraid to do a survey, even if you suspect you may get negative results. The information will still be invaluable in understanding the many dynamics going on. Just don't rationalize negative feedback—act on it! Don't say, “Well, that leader is dealing with issues, so we should make allowances.” Where you see gaps, first step in and help the leader to succeed. If the leader can't get there, then you have to figure out what your response should be. Are they in the wrong role? The wrong organization?
Rebel: It can't be an HR thing. It must come from the entire leadership team. You have to be willing to embrace it and then deploy at full force.
Blankenship: Taking this evidence-based approach definitely resulted in more rigorous answers to the five challenges I mentioned earlier. For example, we not only learned the impact of A, C, and E on a wide swath of important business and people outcomes, but which specific drivers (e.g., hiring, communication, recognition, goal setting, teamwork, development) were the best points of leverage for managers to target actions and resources. We believe that building a “value story” is important so that our leaders increasingly learn what drives value over time. Documenting people-related drivers of guest satisfaction, productivity, and financial results was a big step in that direction.
Tunquist: It has been clear that there is a great deal of variance in alignment, capabilities, and engagement (as well as many other people variables) across the organization. This variance provided important insights into managers who are leading those groups, allowing us to tailor development programs, succession, and remedial actions to the unique needs of different managers—not one size fits all.
Comma: To that end, don't let good or very good managers—those who were triple green (a score above 80 on A, C, and E)—off the hook, feeling that their work is done. We like to leverage our triple green leaders as mentors. For example, we had several lower scoring introverted leaders who attributed their results to being less extroverted than several peers. So, we asked a triple green introverted leader to mentor them as to how he gets great results.
Rebel: Don't assume that someone who has been a good individual contributor is ready to lead. Applying a framework that mirrored our values and culture, as well as strong analytics, helped us identify leaders who needed additional skills, coaching, or other interventions.
Blankenship: Our experience may provide a good model for how to engage senior decision makers in analytics in a deeper way. We began by involving leaders in key questions that could only be answered by developing working hypotheses, designing practical experiments, and then proving or disproving those hypotheses. Getting leaders to put their implicit beliefs on the table is important so that evidence can be gathered to test those theories. Start with what you can do, and build from there.
Comma: I also think organizational leaders should start with smaller data sets so you're not overwhelmed with the results. This makes for a more digestible process. Think of this as building muscles. You need repetition at increasingly more challenging levels. Last, this is not simply about the tool or a particular analysis—it is about becoming a culture that drives business results and the continuous journey to do that.
Conclusion
Jack in the Box has been not only an exemplary story of evidence-based management but also an exposé of how organizations evolve over time and the importance of syncing organizational leadership, culture, and evidence in an effective way. It is a story of an organization that was behind the curve a few years ago, but a strong example of how that can be changed, propelling it to a human capital thought leader in a relatively short period of time.