Introduction
Altered volcanic ash beds within coal seams are referred to as tonsteins; they occur mainly as thin and laterally persistent bands in coal. As with organic matter, tonsteins are significant components of coal, from both academic and practical perspectives. They may provide useful information on: the depositional environments, diagenetic and epigenetic processes within coal beds, and coal-bearing strata; geologic events, in this case related to a volcanic eruption; coal-basin formation; and regional tectonic evolution (Arbuzov et al., Reference Arbuzov, Chekryzhov, Verkhoturov, Spears, Melkiy, Zarubina and Blokhin2023; Zhang et al., Reference Zhang, Lv, Wang, Hower, Raji, Wang, Zhang and Yang2022, Reference Zhang, Lv, Hower, Wang, Shen, Zhang, Xu and Gao2023). Tonsteins may contain minerals (such as zircon and sanidine) suitable for radiometric age determination (Dai et al., Reference Dai, Ward, Graham, French, Hower, Zhao and Wang2017c; Nechaev et al., Reference Nechaev, Dai, Chekryzhov, Tarasenko, Zin'kov and Moore2022). Practically, tonsteins can be used as chronostratigraphic markers to identify and correlate coal beds during coal exploration and exploitation. Alkali tonsteins may contain critical elements (e.g. rare earth elements (REE) and Y, Nb, Zr, Ga), and thus have the potential as raw materials for the recovery of these critical metals (Dai et al., Reference Dai, Ward, Graham, French, Hower, Zhao and Wang2017c; Hou et al., Reference Hou, Dai, Nechaev, Finkelman, Wang, Zhang and Di2023; Jiu et al., Reference Jiu, Huang, Spiro, Hao, Mu, Wen and Hao2023; Karayigit et al., Reference Karayigit, Yerin, Oskay, Bulut and Córdoba2021; Liu et al, Reference Liu, Dai, Song, Nechaev, French, Spiro, Graham, Hower, Shao and Zhao2021; Shen et al., Reference Shen, Dai, Graham, Nechaev, French, Zhao, Shao, Liu, Zuo, Zhao, Chen and Xie2021; Sutcu et al., Reference Sutcu, Şentürk, Kapıcı and Gökçe2021). Tonsteins can also affect the quality of mined coals through elevating the mineral matter content; this can be a source of abrasion, agglomeration, corrosion, or pollution associated with coal use (Davis et al., Reference Davis, Rodrigues, Esterle, Nguyen, Duxbury and Golding2021; Ward, Reference Ward2016). With the exception of the Devonian, tonsteins occur widely in sequences representing almost all coal-forming ages, including the Pennsylvanian, Permian, Late Triassic, Jurassic, Late Cretaceous, Paleocene, and Neogene. Tonsteins have been found in numerous coals on all continents and in ranks ranging from lignite, through various bituminous coals, to anthracite.
The Middle Pennsylvanian Duckmantian-age Fire Clay coal, one of the most important coal resources in the Central Appalachians, contains a lanthanide-rich volcanic-ash fall tonstein. This tonstein, dated at 315-–317 Ma (Machlus et al., Reference Machlus, Shea, Hemming, Ramezani and Rasbury2020), contributes to the coal's reputation as one of the premier coal-based REE resources in the world (Seredin & Dai, Reference Seredin and Dai2012; after Mardon & Hower, Reference Mardon and Hower2004). In most cases within this study area, the ash was deposited during the peat accumulation (Andrews et al., Reference Andrews, Hower and Hiett1994; Bohor & Triplehorn, 1981; Chesnut, 1985; Eble et al., Reference Eble, Hower and Andrews1994; Greb et al., Reference Greb, Eble and Hower1999, Reference Greb, Eble, Hower and Andrews2002; Hower et al., Reference Hower, Andrews, Wild, Eble, Dulong and Salter1994, Reference Hower, Ruppert and Eble1999, Reference Hower, Eble, Dai and Belkin2016, Reference Hower, Berti, Hochella and Mardon2018, Reference Hower, Eble, Backus, Xie, Liu, Fu and Hood2020, Reference Hower, Eble and Mastalerz2022; Lyons et al., Reference Lyons, Outerbridge, Triplehorn, Evans, Congdon, Capiro, Hess and Nash1992, Reference Lyons, Krogh, Kwok, Davis, Outerbridge and Evans2006; Mardon & Hower, Reference Mardon and Hower2004). Not all the ash fall is found as a megascopic rock. At the Mardon and Hower (Reference Mardon and Hower2004) and Hower et al. (Reference Hower, Berti, Hochella and Mardon2018) site to the west of this study area, the ash is mixed with the macerals within the coal. In a few cases, the tonstein is found at the base of the coal or within the underclay (Eble et al., Reference Eble, Hower and Andrews1994; Hower et al., Reference Hower, Andrews, Wild, Eble, Dulong and Salter1994).
Aspects of the chemistry and petrology of the coal and tonstein were discussed by Robl and Bland (1977), Bohor and Triplehorn (1981), Hower et al. (Reference Hower, Andrews, Wild, Eble, Dulong and Salter1994, Reference Hower, Ruppert and Eble1999, Reference Hower, Eble, Dai and Belkin2016, Reference Hower, Eble, Backus, Xie, Liu, Fu and Hood2020), and Hower et al. (Reference Hower, Eble and Mastalerz2022) and will not be discussed in detail here. While the earlier studies established the nature of the tonstein, they did not have the advantage of modern analytical techniques such as inductively coupled plasma mass spectrometry (ICP-MS). The present study is based on the suite of samples collected by Hower and Eble and others (at least one of the Hower and Eble team was part of every sampling crew) in 1990 through early 1992. The tonstein, while not the sole target of the comprehensive coal + rock sampling, was appreciated to be a unique part of the coal seam and, therefore, was always sampled during the field campaign. The purpose of the present study was to carry out mineralogical and geochemical analyses to characterize the enrichment in REE, Y, and other critical elements in the Fire Clay tonstein.
Samples and Methods
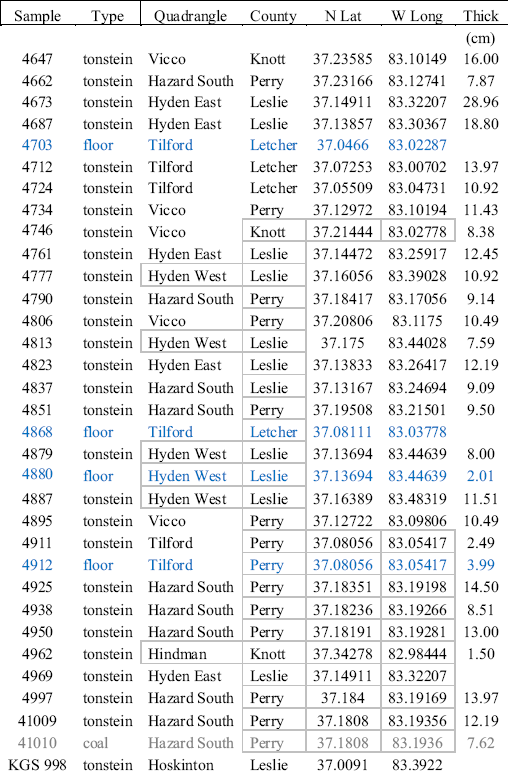
Samples were collected by Hower, Eble, and colleagues from 1990 through 1992, with all but one site within the region shown in Fig. 1. One sample, KGS-998, was collected prior to the latter sampling campaign. The samples were collected from counties including Knott, Perry, Leslie, and Letcher, and included 27 tonstein samples, three floor samples, and one coal sample. The samples were preserved in plastic jars at the Kentucky Geological Survey's Earth Analysis and Research Laboratory (EARL) in Lexington, Kentucky. The sample number, type, location, and thickness are presented in Table 1 and Fig. 1. One sample not in the eight-quadrangle area shown in Fig. 1 (sample 4962) is from the Hindman 7½ˈ quadrangle, northeast of the Vicco 7½ˈ quadrangle mapped in Fig. 1.
Locations of the tonstein and other sample sites within central eastern Kentucky, USA

Sample, sample type, location (7½ˈ quadrangle, county, north latitude, west longitude), thickness (cm) for samples analyzed in the present study
 |
KGS Kentucky Geological Survey
Blue type is used for the floor samples and gray type is used for the coal sample
The proximate and total sulfur analyses were conducted at the University of Kentucky Center for Applied Energy Research (CAER) after ASTM procedures (currently ASTM, 2017, 2018a, b). The major oxide analyses attributed to the CAER were performed following Hower and Bland's (Reference Hower and Bland1989) procedures on an X-ray fluorescence (XRF) instrument in place at that time. The major oxide analyses attributed to the China University of Mining & Technology (CUMT) were analyzed with a scanning wavelength dispersive X-ray fluorescence spectrometer (XRF; Thermo ARL Advant’XP+, ThermoFisher, Waltham, Massachusetts, USA).
The concentrations of trace elements in the tonsteins, floor, and coal samples were determined by ICP-MS (ThermoFisher, X series II). Before the ICP-MS analysis, the samples were prepared in the following procedure: 50 mg of coal and non-coal samples were digested in a Milestone UltraClave Microwave High Pressure Reactor microwave digestion system (Milestone, Inc., Sorisole, Italy); tonstein and floor samples were digested with 2 mL of HNO3 (65%) and 5 mL of HF (40%); ashed coal samples were digested with 5 mL of HNO3 (65%) and 2 mL of HF (40%). More details of the ICP-MS analysis method were described by Dai et al. (Reference Dai, Wang, Zhou, Hower, Li, Chen, Zhu and Zou2011).
The mineral phases and their contents in samples were determined by X-ray diffraction (XRD) using a Rigaku D/max-2500/PC X-ray powder diffractometer (Rigaku, Tokyo, Japan), along with the commercial software Siroquant™ (Michell, ACT, Australia) developed by Taylor (Reference Taylor1991) based on the whole-pattern analysis principles proposed by Rietveld (Reference Rietveld1969). More details of XRD and Siroquant analyses were given by Ward et al. (2001). Each coal sample was subjected to low-temperature ashing (<120°C) using a plasma low-temperature asher (EMITECH K1050X; Quorum, East Sussex, UK) to remove the organic matter prior to XRD analysis.
The morphology and some elemental compositions of minerals in tonsteins were analyzed using a field emission-scanning electron microscope (FE-SEM, FEI Quattro S; ThermoFisher, Waltham, Massachusetts, USA) in conjunction with an energy-dispersive X-ray spectrometer (EDS, OctaneElect, Berwyn, PA, USA). Samples were carbon-coated using a Quorum Q150T ES (Quorum, East Sussex, UK) sputter coater. The images of SEM were captured via a retractable solid-state backscatter electron detector. The working distance of the FE-SEM–EDS was ~10 mm, the beam voltage was 20 kV, the aperture was 6, and spot size was 5.0.
Transmission electron microscopy (TEM) images and selected area diffraction patterns (SAED) of the Dean coal sample were collected using a JEOL JEM-2100 (JEOL USA, Peabody, Massachusetts, USA) operated at 200 keV, at the Virginia Tech National Center for Earth and Environmental Nanotechnology Infrastructure (NanoEarth).
Results and Discussion
Mineralogy
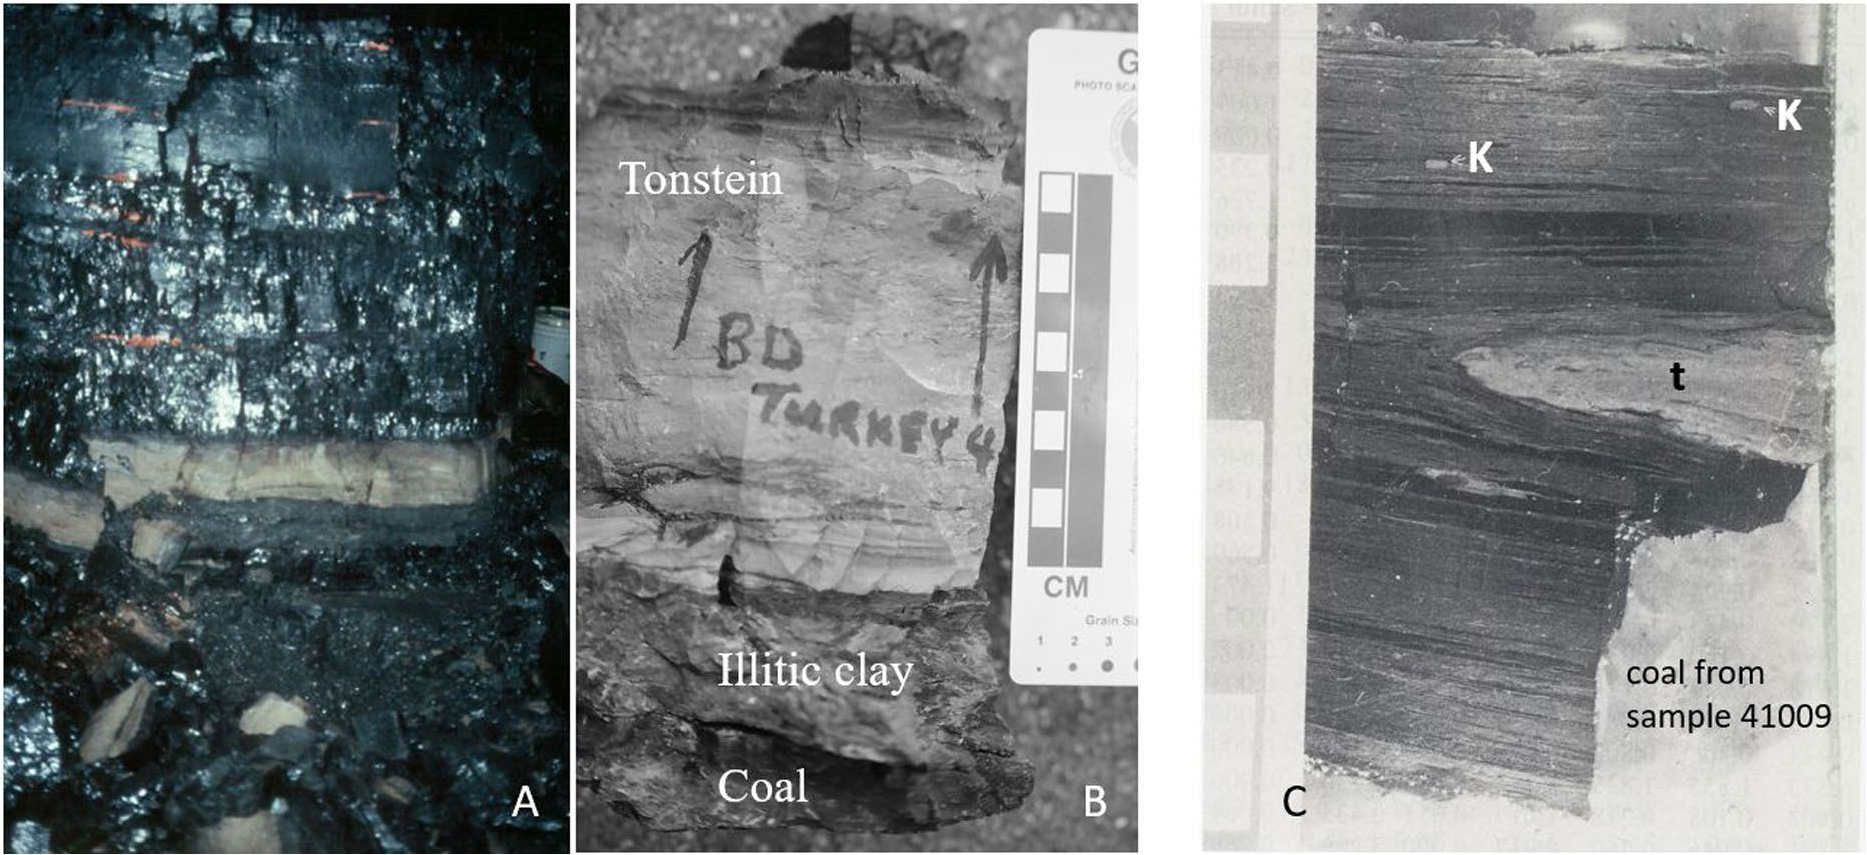
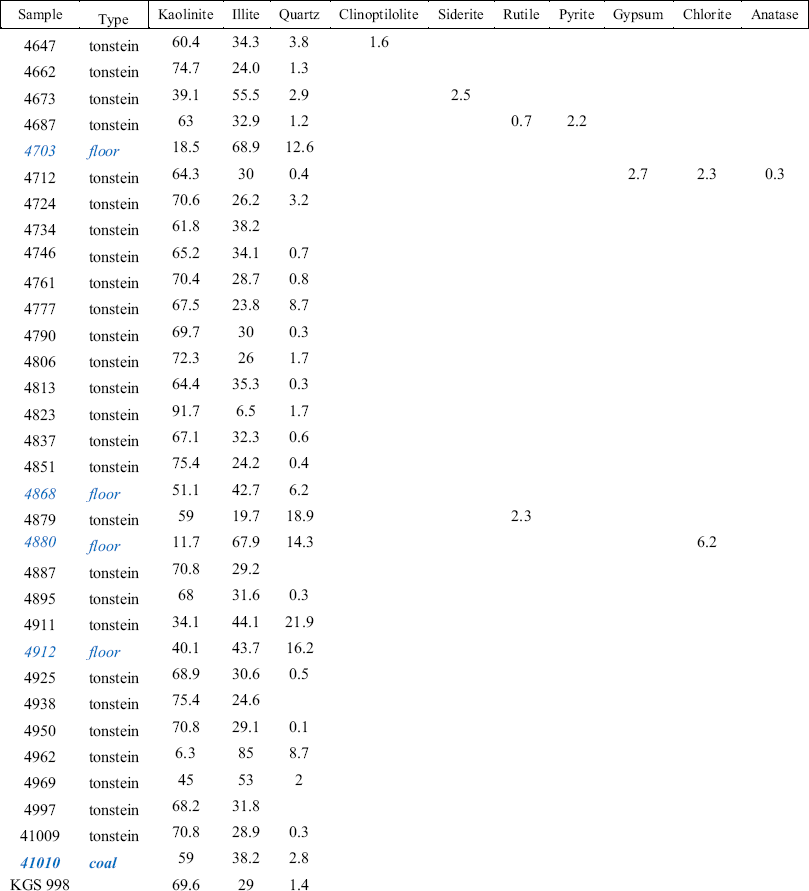
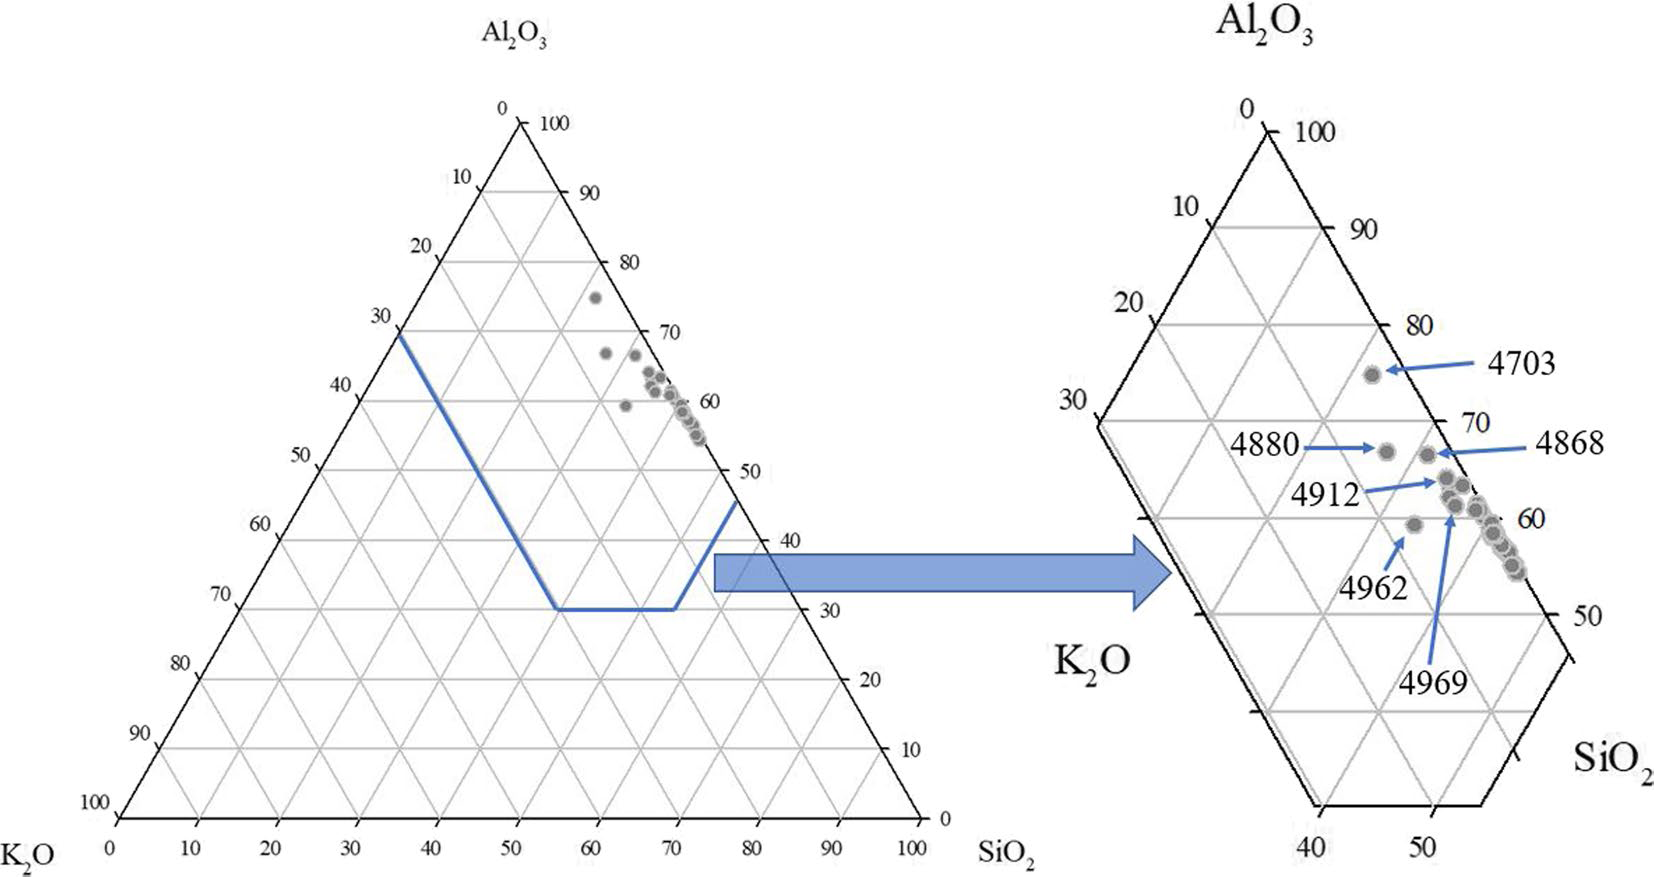
As discussed by Robl and Bland (1977), Rice et al. (1994), and Hower et al. (Reference Hower, Andrews, Wild, Eble, Dulong and Salter1994), the tonstein (Fig. 2) mineralogy is dominated by kaolinite with lesser amounts of quartz, K-feldspar, illite, and other minerals (Table 2). The Al2O3-SiO2-K2O chemistry (Fig. 3) supports the dominance of kaolinite, with most samples clustering along the Al2O3–SiO2 axis. As a caveat concerning the samples, Frank Dulong (Hower et al., Reference Hower, Andrews, Wild, Eble, Dulong and Salter1994; based on a 1991 personal communication with Cortland Eble) noted that sample 4911 might have been transitional to the underclay (sample 4912) resulting in a diminished kaolinite content in the “tonstein” and a relatively high kaolinite content in the underclay. Of the other tonstein samples with <50% kaolinite, 4673 was noted as darkening upwards, perhaps an indicator of an increasing illite content in that part of the rock; 4962 was a parting from a roadcut in the Hindman 7½ˈ quadrangle, thus relatively distant from the other sites; and 4969 was from a weathered roadcut. Basically, the field identification was imperfect and roadcut samples with ~10–15 y of weathering (at the time of the sampling) are imperfect. In this case, the XRD analysis is the final arbiter of the sample type. Setting aside these four gradational (4673 and 4911) and weathered (4962 and 4969) samples, the kaolinite content of the tonstein samples ranges from 59 to >91%. The coal sample included among these samples (41010) contains several flint clay inclusions.
a Lithologic profile of a coal seam surrounding tonstein sample 4712. b Hand specimen of tonstein (sample 4712), the underlying illitic clay (sample 4713 in Hower et al., Reference Hower, Ruppert and Eble1999), and a portion of the lowermost lithotype of the coal (sample 4714 in Hower et al., Reference Hower, Ruppert and Eble1999). Note centimeter scale to the right of hand specimen. c Polished block corresponding to coal sample 41010. The coal encases kaolinite lenses (K) and a thin tonstein lens (t). The tonstein was present at the top of the polished coal section. Note centimeter scale to the left of polished block

Mineral percentages as determined by XRD and Siroquant (%)
 |
Tonsteins in regular type, floor rocks in blue italics, and coal in bold blue italics
KGS Kentucky Geological Survey
Al2O3–SiO2–K2O chemistry of the rock and coal samples. The floor samples (4703, 4898, 4880, and 4912) and the weathered tonsteins (4962 and 4969) are identified

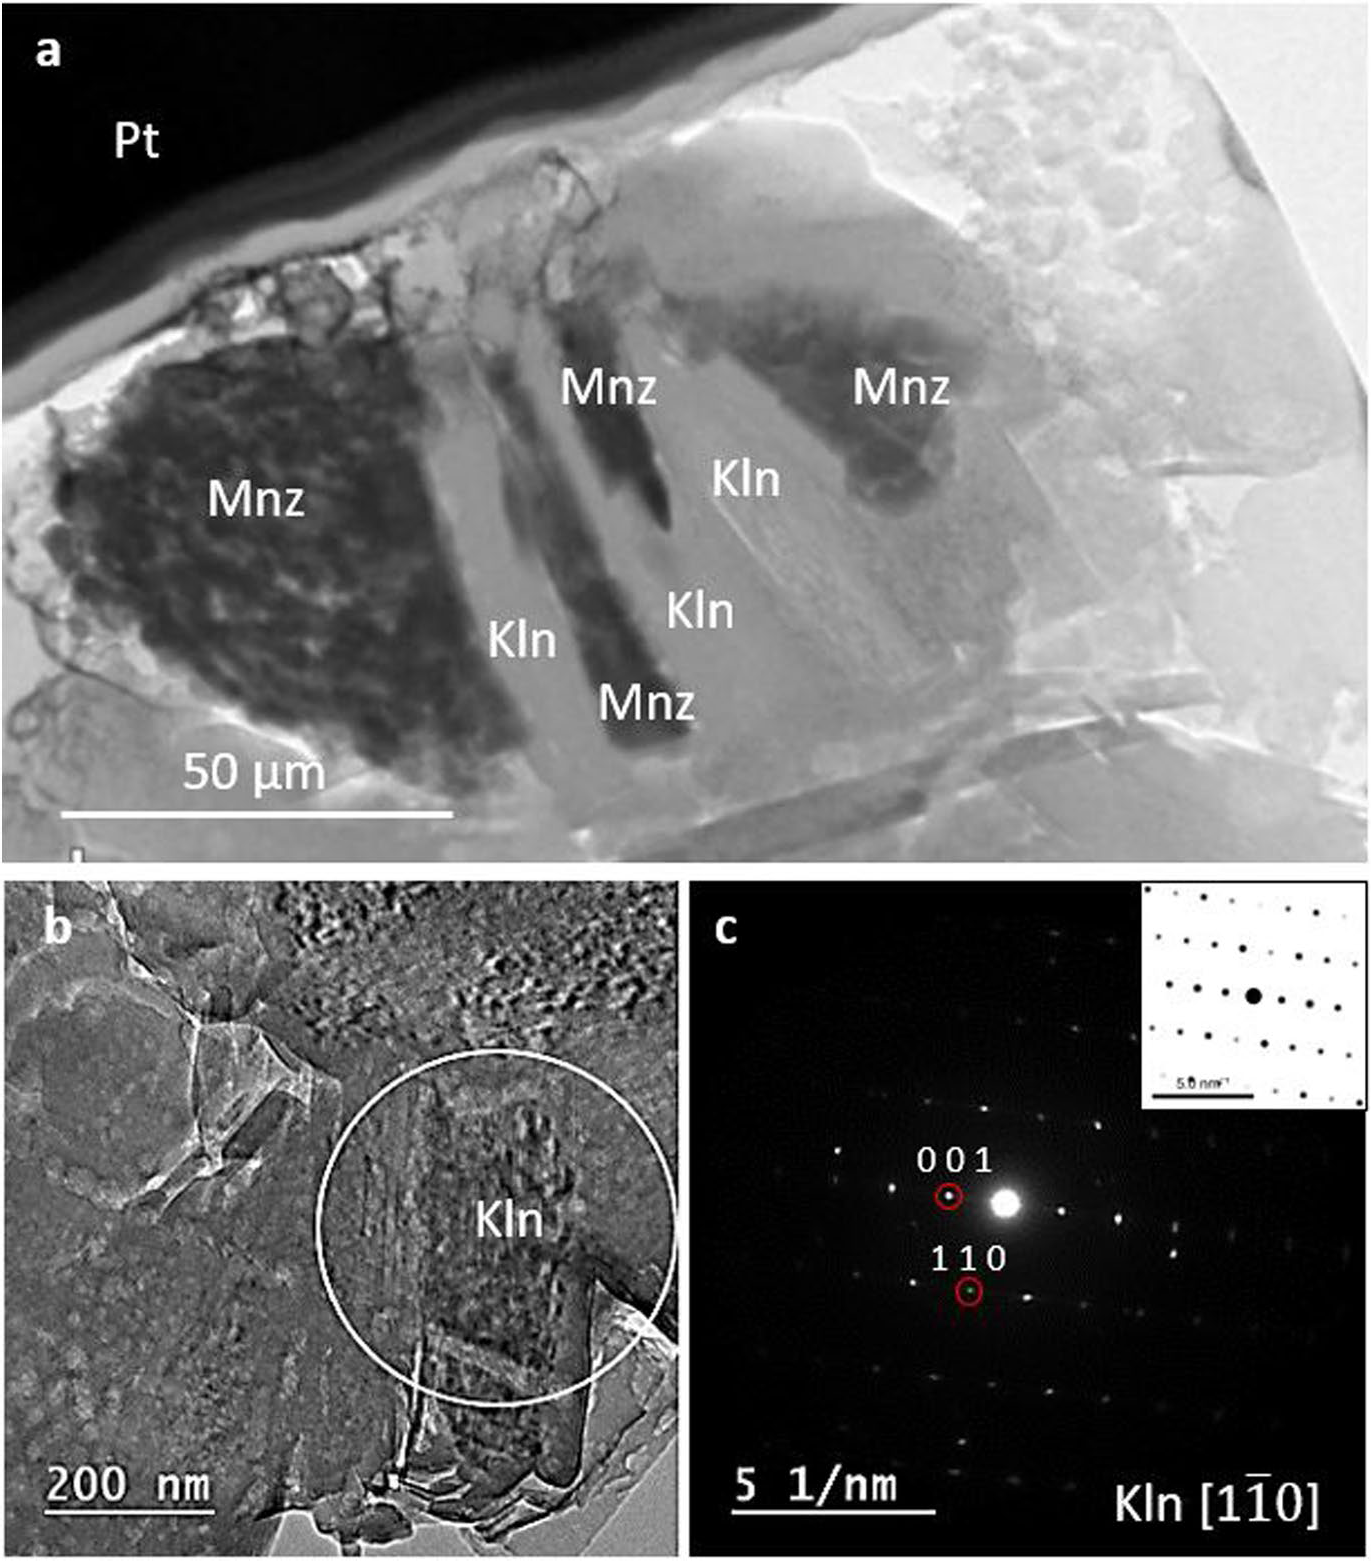
Previous electron microscopy studies include the SEM and high-resolution TEM (HRTEM) investigation of the minerals in a high-REE portion of the Dean coal (a Fire Clay coal correlative) in Knox County, Kentucky (Hower et al., Reference Hower, Berti, Hochella and Mardon2018; based on samples from Mardon & Hower, Reference Mardon and Hower2004). Figure 4a shows interlayered monazite and kaolinite. In this case, the kaolinite could represent the diagenetic recrystallization of the volcanic glass. A well crystallized kaolinite, possibly a phenocryst from the volcanic-ash fall, is shown in Fig. 4b,c. The Dean coal site is different from the sites in the current study in that it has no megascopic tonstein. The lower portion of the coal bed does show an enrichment in REE and does contain abundant kaolinite and trace amounts of monazite, however (Hower et al., Reference Hower, Berti, Hochella and Mardon2018).
TEM images of the FIB section. a Monazite (mz) and kaolinite (Kln); the black ribbon is a platinum (Pt) protective layer placed on the surface of the sample; b kaolinite; c selected area electron diffraction pattern (SAED) of the region within the white circle in b. The pattern symmetry and d spacing correspond to kaolinite viewed along
 . The inset shows the kinematic simulation computed with the software SingleCrystal®4, using the kaolinite structure by Bish and Von Dreele (Reference Bish and Von Dreele1989) which confirms the identification (from Hower et al., Reference Hower, Berti, Hochella and Mardon2018)

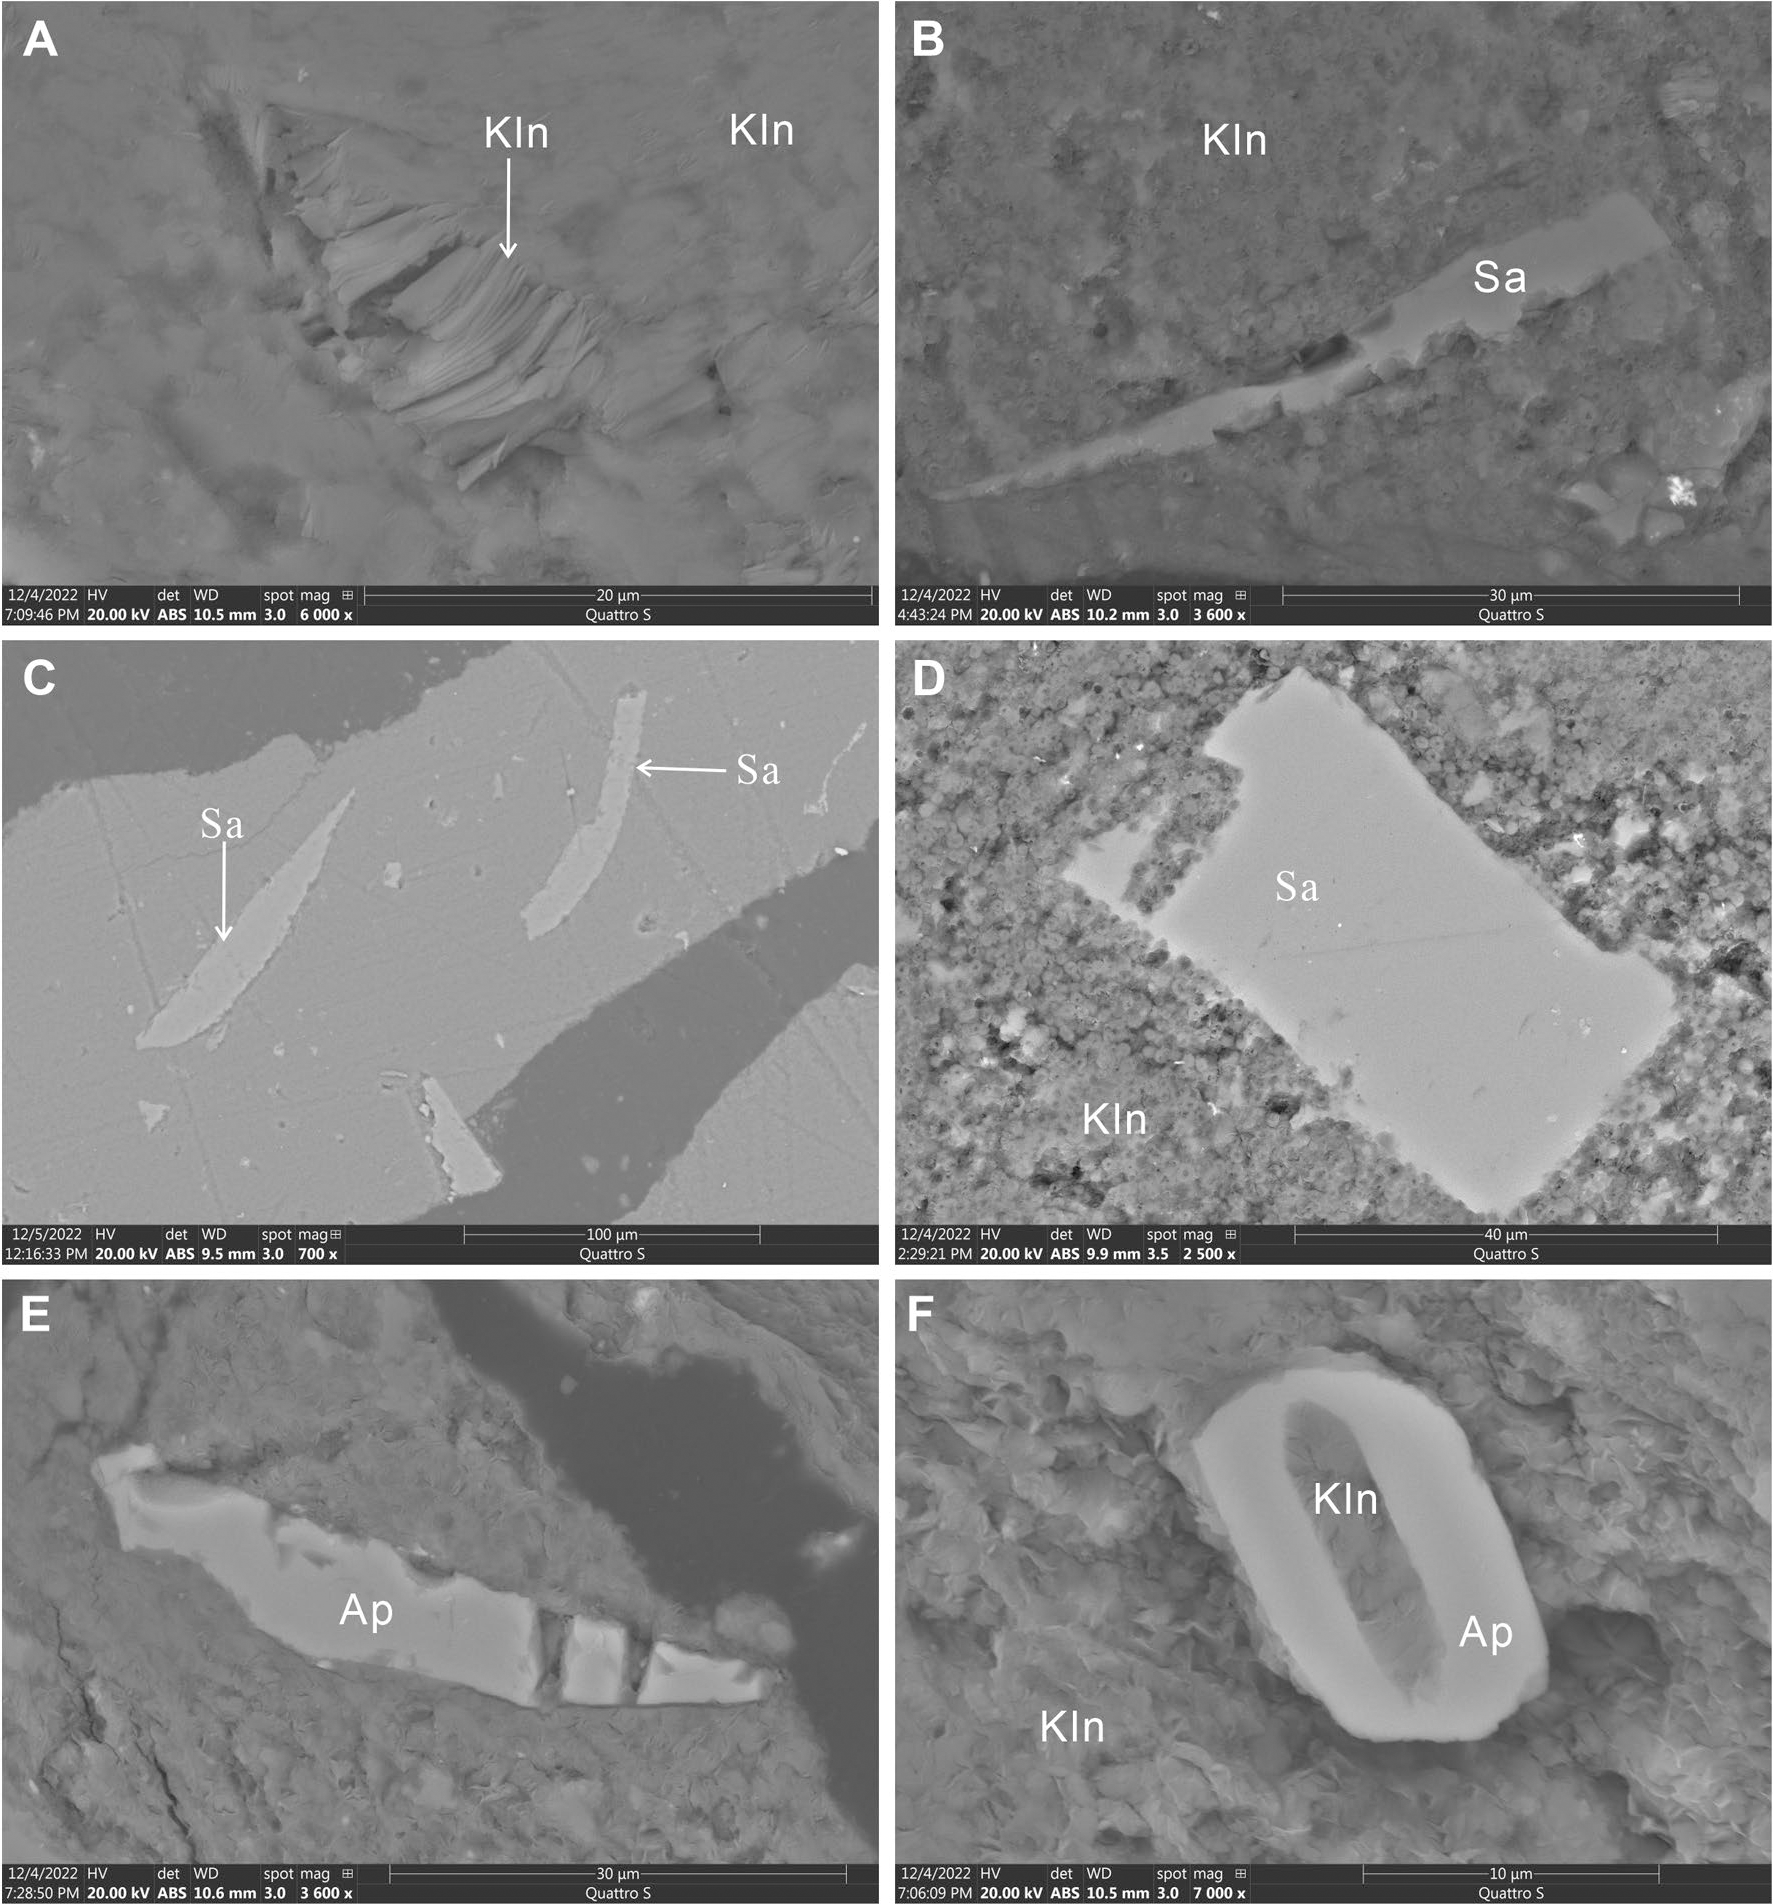
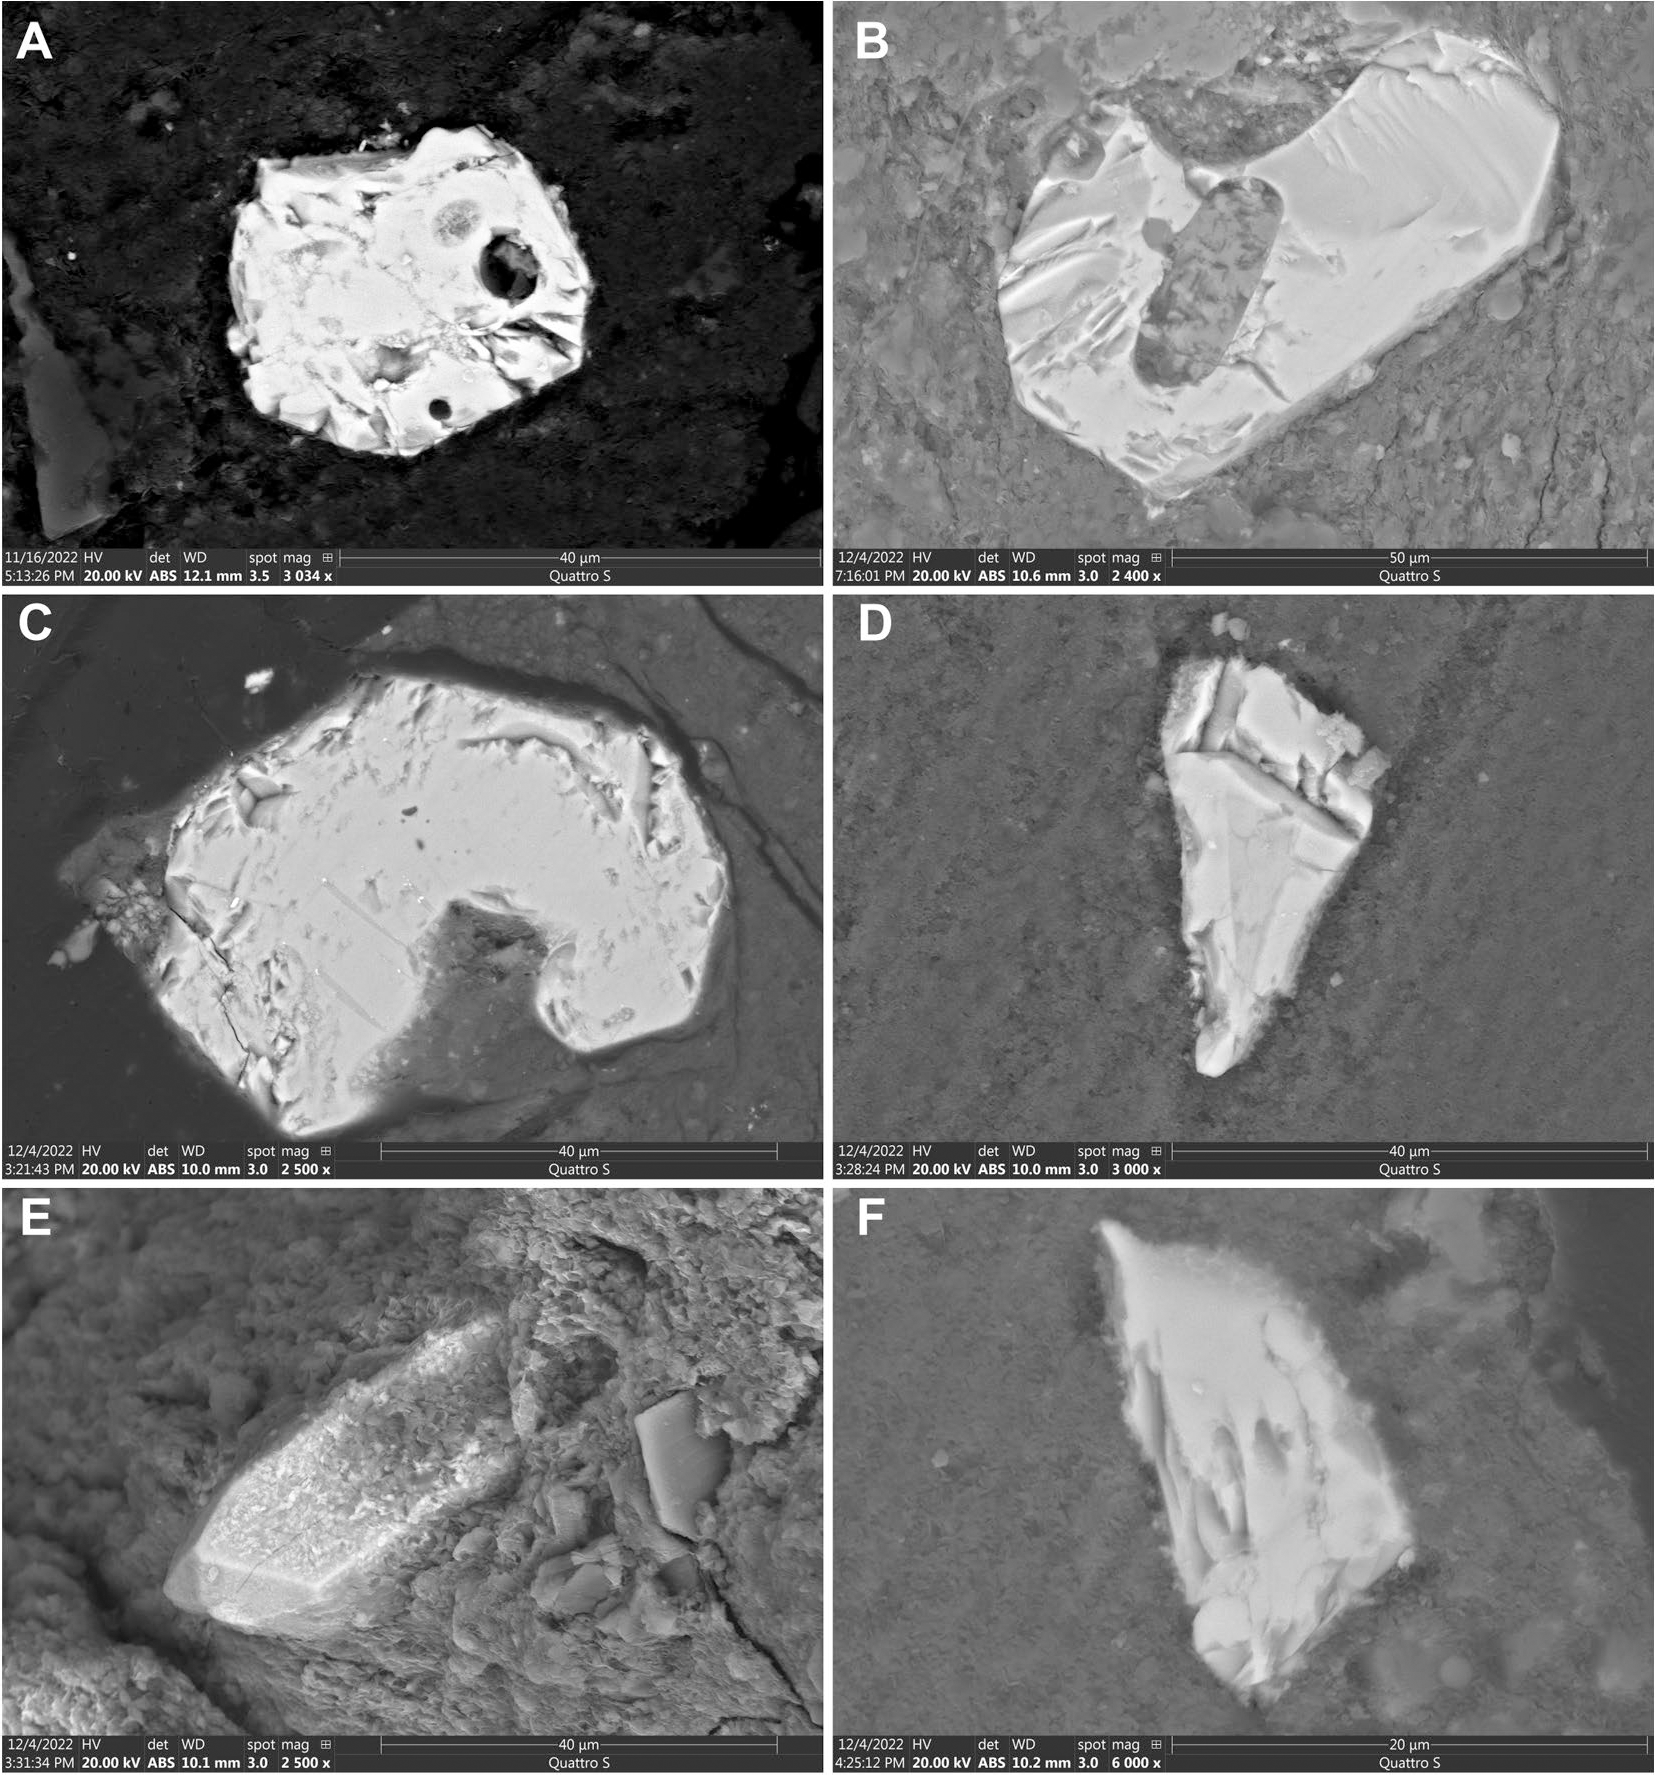
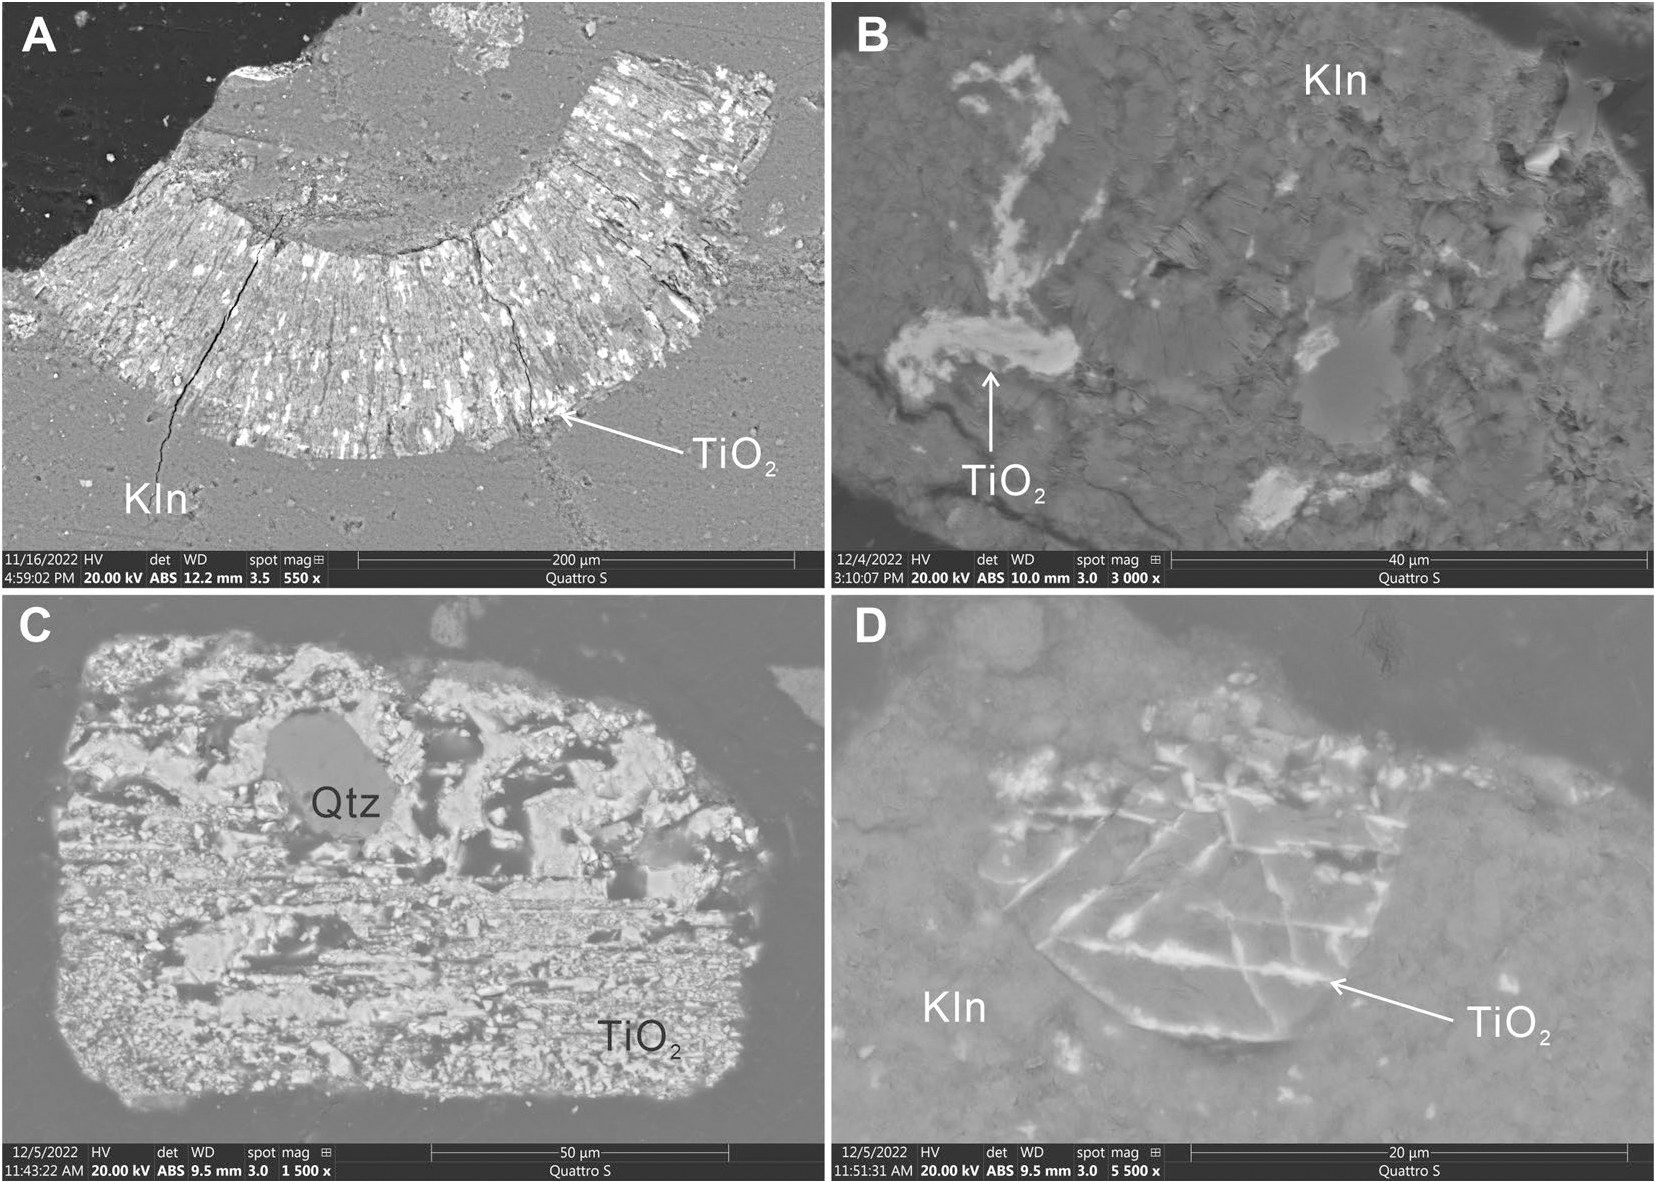
In addition to minerals identified by XRD, some trace minerals with contents below the detection limits of XRD analysis were identified by SEM–EDS, including K-feldspar and apatite (Fig. 5); zircon (Fig. 6); Ti oxides (rutile or anatase) (Fig. 7); ilmenite, pyrite, crandallite, florencite, and galena (Fig. 8); and siderite and goethite (Fig. 9). Compared to the trace minerals found in the present study, Weaver (Reference Weaver1963), in his review of heavy minerals in bentonites, noted that hornblende, biotite, zircon, apatite, and titanite were the most common non-opaque heavy minerals in felsic ashes.
SEM back-scattered electron images of kaolinite, sanidine, and apatite in tonstein samples: a vermicular kaolinite and a matrix kaolinite in sample 4673; b sanidine in a kaolinite matrix in sample 4673; c sanidine in a kaolinite matrix in sample 4777; d sanidine in a kaolinite matrix in sample 4673; e and f apatite in a kaolinite matrix. Key: Kln, kaolinite; Sa, sanidine; Ap, apatite

SEM back-scattered electron images of zircon in sample 4673

SEM back-scattered electron images of Ti oxides (rutile or anatase): a Ti oxide distributed in vermicular kaolinite in sample 4673; b authigenic Ti oxide distributed in a kaolinite matrix in sample 4673; c Ti oxides subjected to corrosion and filled with authigenic quartz in sample 4777; d Ti oxides subjected to corrosion and filled with kaolinite in sample 4777. Key: Kln, kaolinite; Qtz, quartz

SEM back-scattered electron images of trace minerals in sample 4673: a apatite distributed in a kaolinite matrix; b ilmenite in kaolinite; c crandallite and pyrite in kaolinite; d florencite in kaolinite; e euhedral pyrite in kaolinite; f galena. Key: Kln, kaolinite; Ap, apatite; Ilm, ilmenite; Crd, crandallite; Flr, florencite; Py, pyrite; Gn, galena

SEM back-scattered electron images of siderite and goethite in sample 4673: a well crystallized siderite; b and c siderite subjected to corrosion; d goethite with a bell-emulsion shape. Key: Sd, siderite; Kln, kaolinite; Gt, goethite

As indicated by XRD analysis, kaolinite is the main constituent of tonsteins present in this study. In addition to occurring as matrix for other trace minerals, it occurs in vermicular form (Figs. 5a and 7a), indicating an authigenic origin. Vermicular kaolinite is usually considered as evidence of volcanic ash deposition of the partings with coal seams (Dai et al., Reference Dai, Ward, Graham, French, Hower, Zhao and Wang2017c), mainly because vermicular kaolinite in the partings is indicative of in situ alteration of volcanic minerals, as reported by Triplehorn and Bohor (1981), Ward (Reference Ward2002 Reference Ward2016), and Dai et al. (Reference Dai, Ward, Graham, French, Hower, Zhao and Wang2017c).
The volcanogenic minerals identified in altered volcanic ash layers present in this study that survived post-depositional alteration include mainly sanidine, zircon, apatite, and rutile (or anatase). Sanidine occurs mainly as anhedral, elongate shards distributed in the kaolinite matrix (Fig. 5b,c). Sanidines shown in Fig. 5b,c have well defined shard-like morphologies strongly suggestive of original subhedral to euhedral sanidine micro crystals being torn apart during an explosive volcanic eruption. Some sanidines are in the form of embayed, tabular euhedral crystals (Fig. 5d). The presence of sanidine supports strongly the volcanic-ash origin of the partings. Apatite occurs typically as individual shard-like grains within a kaolinite matrix (Figs. 5e,f and 8a) and the apatite in a few cases is resorbed, all suggesting a volcanic origin (Fig. 5f). The delicate and elongate apatite grains may have fractured as a result of the volcanic explosion or compaction after deposition (Figs. 5c–e and 8a) (Dai et al., Reference Dai, Ward, Graham, French, Hower, Zhao and Wang2017c; Spears, Reference Spears2012).
In many cases, zircon grains observed in samples that were subjected to SEM–EDS analysis do not show well crystallized shapes, but euhedral crystals are observed (Fig. 6a,b,c). The embayments seen in Fig. 6b,c are evidence of magmatic corrosion. The zircon grains shown in Fig. 6d,f are clearly fragments of zircon crystals from an explosive volcanic primary origin while the grain shown in Fig. 6e is a euhedral prismatic crystal with well developed terminations. The fractures shown in Fig. 6d,f are probably the result of this explosive volcanic activity which would have shattered original primary subhedral to euhedral zircon micro-crystals. A single tonstein horizon was suggested by Dopita and Kralik (1977) to have an homogeneous population of euhedral zircons with a limited range of shapes. The various shapes of zircon are probably due to modification resulting from the volcanic eruption and transport in the ash cloud. Larger and rounded zircon grains appear to be older than the normal zircon population (Guerra-Sommer et al., Reference Guerra-Sommer, Cazzulo-Klepzig, Santos, Hartmann, Ketzer and Formoso2008), suggesting that the xenocrysts represent partially resorbed older zircons in the magma (Spears, Reference Spears2012). In addition, some zircon grains contain inclusions (Fig. 6a,b).
Various TiO2 forms are shown in Fig. 7. Ti oxides in Fig. 7a,b are clearly of authigenic origin, in places (Fig. 7a) clearly intergrown with kaolinite along its cleavage planes. Ti oxides shown in Fig. 7c,d are probably originally magmatic in origin (from the same source as sanidine and zircon grains) and similarly deposited from an explosive volcanic eruption. They would have been primary magmatic Fe-Ti oxides, probably titaniferous magnetite with a well-developed trellis or lattice structure (probably originally magmatic exsolution of Ti oxide in magnetite) and during diagenesis, the Fe was leached out selectively and the Ti oxides have remained behind and now may be the phase ‘leucoxene’.
Ilmenite, observed as a partially corroded grain in kaolinite (Fig. 8b), is a resistate volcanogenic mineral and has also been found in a few tonsteins (Bohor & Triplehorn, 1993; Dai et al., Reference Dai, Ward, Graham, French, Hower, Zhao and Wang2017c; Lyons et al., Reference Lyons, Spears, Outerbridge, Congdon and Evans1994). As with apatite, goyazite-gorceixite-crandallite-florencite minerals are often indicative of volcanic input (Brownfield et al., Reference Brownfield, Affolter, Cathcart, Johnson, Brownfield and Rice2005; Dai et al., Reference Dai, Ward, Graham, French, Hower, Zhao and Wang2017c; Rao & Walsh, Reference Rao and Walsh1997; Wilson et al., Reference Wilson, Sergeant, Young and Harrison1966; Zhao et al., Reference Zhao, Ward, French and Graham2012;) and have been found in a number of tonsteins in coals (e.g. Bohor & Triplehorn, 1993; Kokowska-Pawłowska & Nowak, Reference Kokowska-Pawłowska and Nowak2013; Rao & Walsh, Reference Rao and Walsh1997). Crandallite and florencite were also identified in tonstein samples present in this study. They occur as individual (Fig. 8c) or as elongated grains (Fig. 8d) in kaolinite.
Sulfide minerals such as pyrite (Fig. 8c) and galena (Fig. 8f) have been observed in the samples present in this study and indicate an epithermal solution input. The pyrite seen in Fig. 8e is of syngenetic or authigenic origin. Siderite has been found in tonsteins, but if present, it is probably of secondary origin (Dai et al., Reference Dai, Ward, Graham, French, Hower, Zhao and Wang2017c). Siderite in sample 4763 distributed in kaolinite was subjected to alteration (Fig. 9). Goethite in sample 4673 (Fig. 9d) with a bell-emulsion shape shows an authigenic origin, possibly as a pseudomorph after siderite because of the rhombohedral shape of the original siderite.
Geochemistry
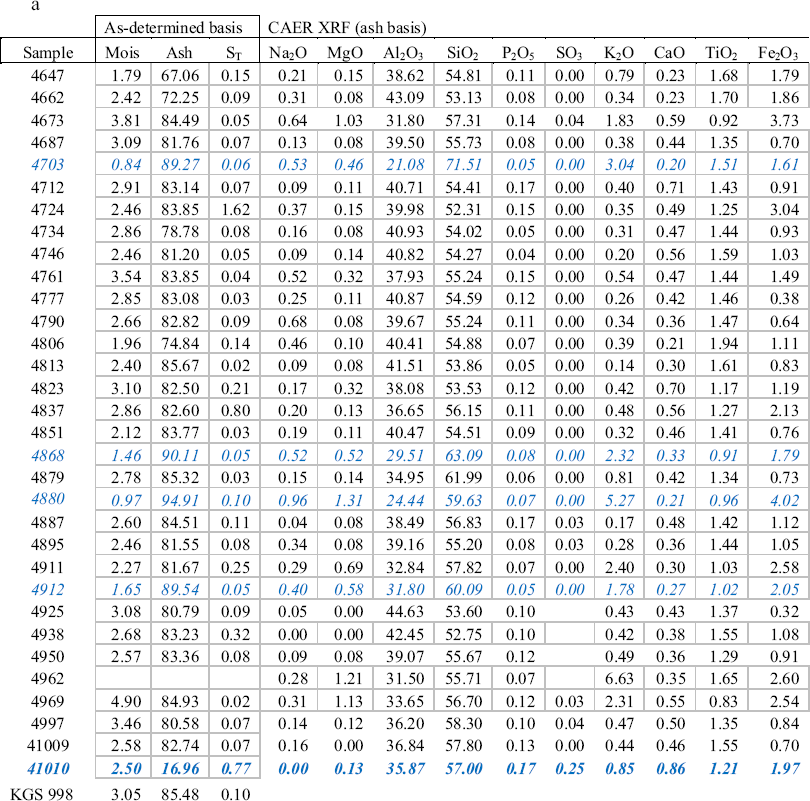
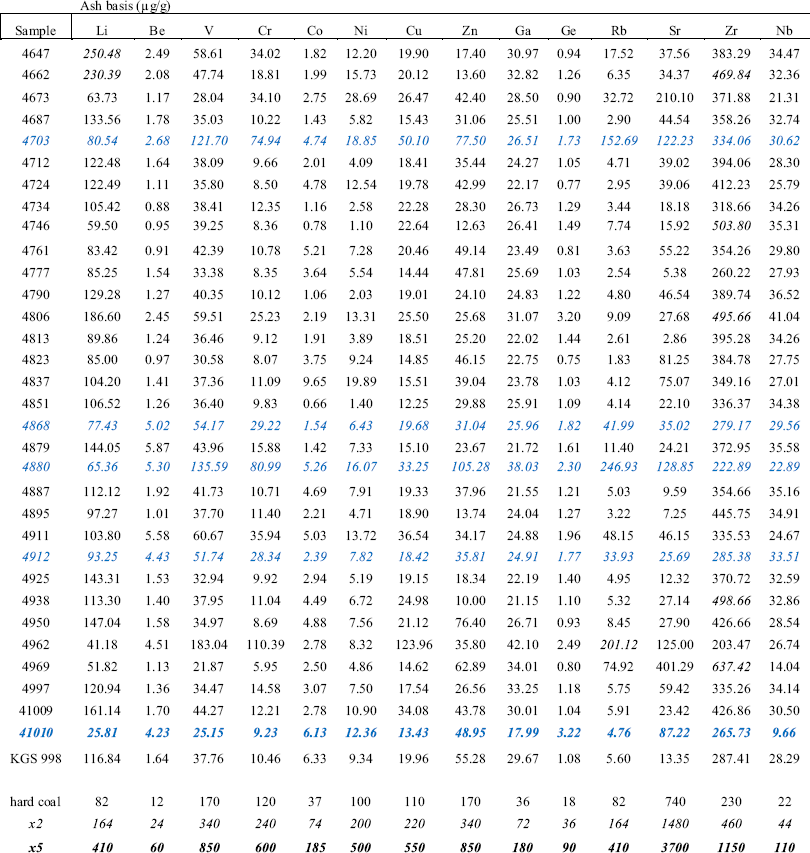
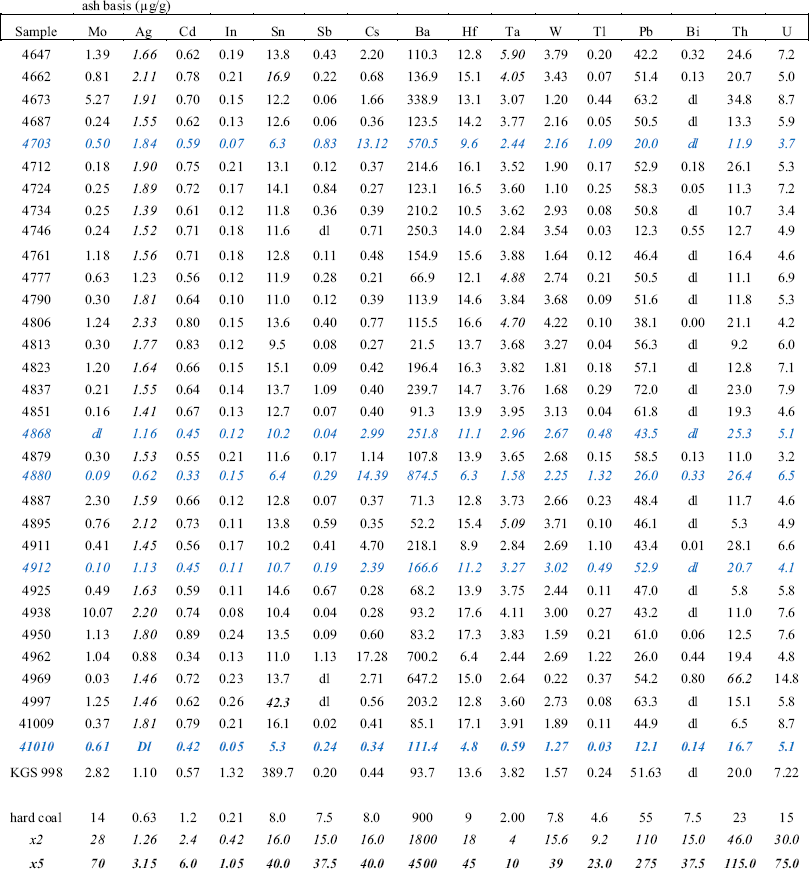
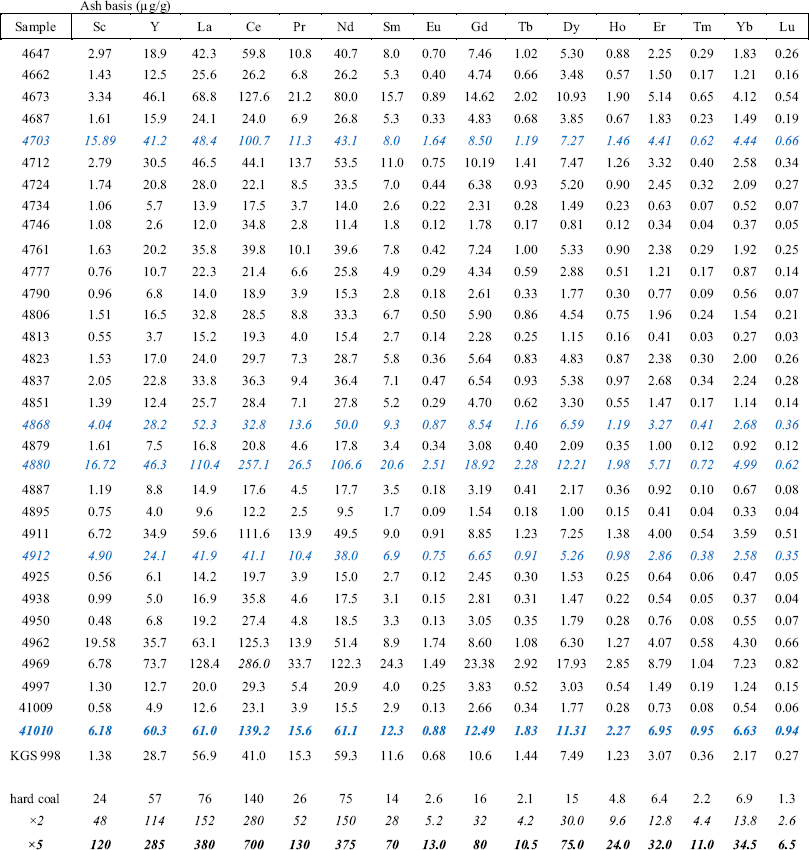
The chemical analyses of the tonstein, floor rock, and coal are shown in Tables 3, 4, 5, 6, 7, and 8. Both the CAER and CUMT major oxides results are given. The CAER major oxides data were used in the plotting of the figures.
a Sample; as-determined moisture, ash, and total S; ash-basis major oxides determined at CAER. b Sample, ash-basis (%) major oxides determined at CUMT
 |
 |
KGS Kentucky Geological Survey
Tonsteins in regular type, floor rocks in blue italics, and coal in bold blue italics
Sample; ash basis (µg/g) minor elements from Li through Nb; World coal average (ash basis), 2 × World coal average, and 5 × World coal average at bottom of table (after Ketris & Yudovich, Reference Ketris and Yudovich2009).
 |
KGS Kentucky Geological Survey
Tonsteins in regular type, floor rocks in blue italics, and coal in bold blue italics
Sample; ash basis (µg/g) minor elements from Mo through U; World coal average (ash basis), 2 × World coal average, and 5 × World coal average at bottom of table (after Ketris & Yudovich, Reference Ketris and Yudovich2009).
 |
KGS Kentucky Geological Survey
Tonsteins in regular type, floor rocks in blue italics, and coal in bold blue italics
Sample; ash basis (µg/g) REE plus Sc and Y; World coal average (ash basis), 2 × World coal average, and 5 × World coal average at bottom of table (after Ketris & Yudovich, Reference Ketris and Yudovich2009)
 |
KGS Kentucky Geological Survey
Tonsteins in regular type, floor rocks in blue italics, and coal in bold blue italics
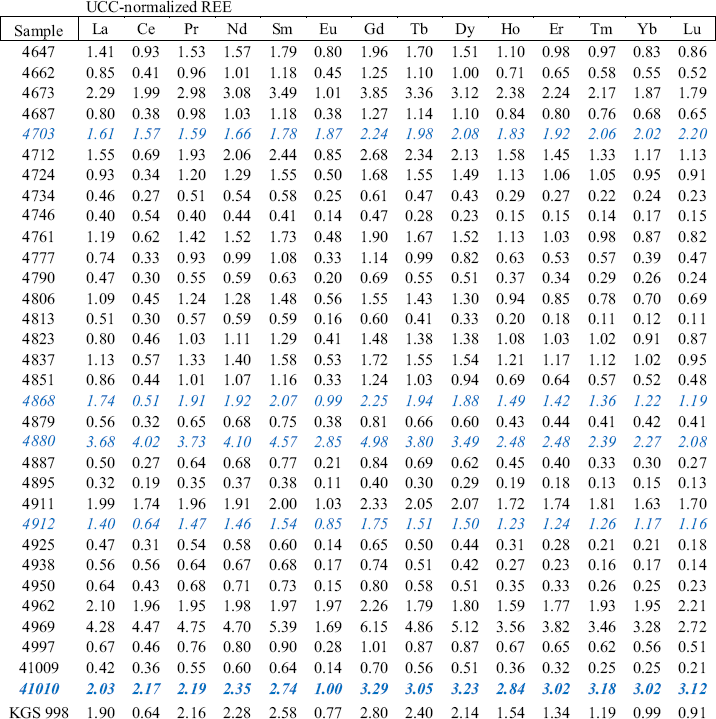
Sample; UCC-normalized REE values (after Taylor & McLennan, Reference Taylor and McLennan1985)
 |
KGS Kentucky Geological Survey
Tonsteins in regular type, floor rocks in blue italics, and coal in bold blue italics
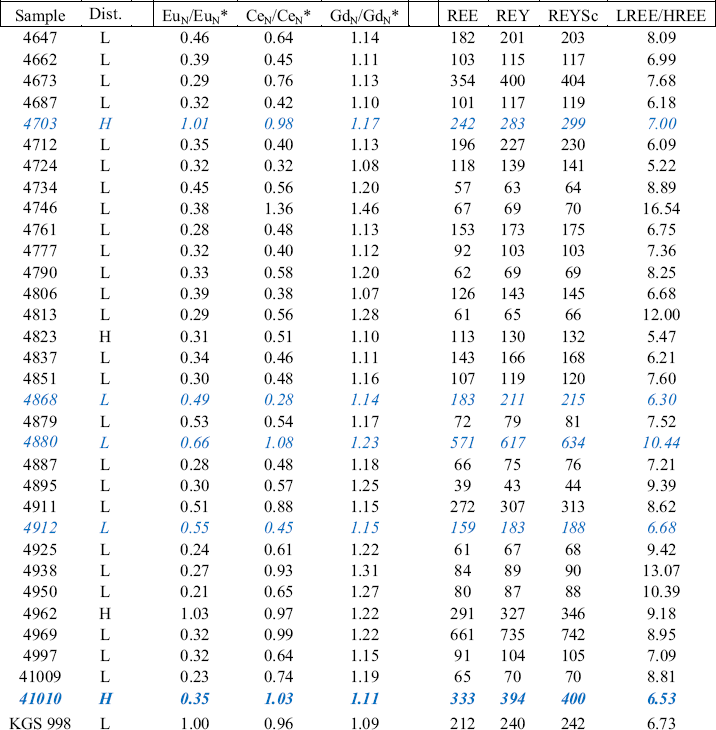
Sample; Light (L) vs. Heavy (H) distribution, EuN/EuN*, CeN/CeN*, GdN/GdN*, total REE, REE + Y (REY), REY + Sc (REYSc, Light REE/Heavy REE (LREE/HREE)
 |
KGS Kentucky Geological Survey
Tonsteins in regular type, floor rocks in blue italics, and coal in bold blue italics
Major Oxides
The major-element oxides in all samples are dominated by SiO2 and Al2O3 (Table 3) with traces of TiO2, Fe2O3, MgO, CaO, MnO, Na2O, K2O, and P2O5. Among the tonsteins, the amounts of each major element oxide in the two data sets based on CUMT and CAER analyses (Table 3) are very close to each other. The data for major-element oxides are also consistent with the mineral components in the samples as presented in Table 2. Samples with large illite contents also have large K2O contents.
Rare Earth Elements
In the present study, REE were used to describe the lanthanide elements, REY for REE + Y, and REYSc for REY + Sc with light REE (LREE) defined as La through Sm and the heavy REE (HREE) defined as Eu through Lu (Hower et al., Reference Hower, Ruppert and Eble1999; Seredin, Reference Seredin1996). Following the normalization of REE abundances to the Upper Continental Crust (UCC) averages (indicated by the subscript suffix ‘N’) (after Taylor & McLennan, Reference Taylor and McLennan1985), L-type (light type: LaN/LuN > 1), M-type (medium type: LaN/SmN < 1, GdN/LuN > 1), and H-type (heavy type: LaN/LuN < 1) enrichment patterns are delineated (Seredin & Dai, Reference Seredin and Dai2012). Building upon the UCC corrections (Taylor & McLennan, Reference Taylor and McLennan1985), Ce, Eu, and Gd are decoupled from the other REE in the distribution patterns (Bau & Dulski, Reference Bau and Dulski1996; Dai et al., Reference Dai, Graham and Ward2016b, Reference Dai, Xie, Jia, Ward, Hower, Yan and French2017a, Reference Dai, Xie, Ward, Yan, Guo, French and Grahamb):


In addition to the tuffaceous, detrital, infiltrational/leaching, and hydrothermal modes of REE enrichment in coals (Seredin & Dai, Reference Seredin and Dai2012), peat and low-rank coals would have had organic associations, with HREE having a greater affinity for organics than the LREE (Aide & Aide, Reference Aide and Aide2012; Davranche et al., Reference Davranche, Grybos, Gruau, Pédrot, Dia and Marsac2011; Eskenazy et al., Reference Eskenazy, Mincheva and Rousseva1986; Eskenazy, Reference Eskenazy1978, Reference Eskenazy1987a, Reference Eskenazyb, Reference Eskenazyc, Reference Eskenazy1999, Reference Eskenazy2015; Pédrot et al., Reference Pédrot, Dia and Davranche2010). As the chelating functional groups diminish in importance in bituminous coals (Given, 1984; Hatcher & Clifford, Reference Hatcher and Clifford1996), organic associations are lost from the coal with low LREE/HREE being a ghost signature of the original organic association (Hower et al., Reference Hower, Eble, Backus, Xie, Liu, Fu and Hood2020). The formerly organic-bound REE could be leached from the coals, bound to clays (Eskenazy, Reference Eskenazy1995, Reference Eskenazy1999; Seredin, Reference Seredin1996), or incorporated in secondary carbonates and phosphates. Leaching of LREE from intra-seam and bordering rocks (Dai et al., Reference Dai, Ren, Chou, Li and Jiang2006, Reference Dai, Li, Chou, Zhao, Zhang, Ren, Ma and Sun2008) and hydrothermal mobilization of HREE-depleted phosphates and HREE- and Y-enriched organic compounds (Dai et al., Reference Dai, Zhang, Seredin, Ward, Hower, Wang, Li, Song, Zhao, Kang, Zheng and Zhou2013a, Reference Dai, Zhang, Ward, Seredin, Hower, Li, Song, Wang, Kang, Zheng, Wang and Zhoub, Reference Dai, Chekryzhov, Seredin, Nechaev, Graham, Hower, Ward, Ren and Wang2016a) contribute to the redistribution of light and heavy REEs. According to Williams-Jones et al. (Reference Williams-Jones, Migdisov and Samson2012), hydrothermal-influenced deposits tend to be enriched in LREE.
The UCC-normalized REE for all of the samples are shown in Figs. 10 and 11. As noted above, several of the highlighted samples are complicated, being weathered tonsteins (sample 4673 with a distinct negative Eu anomaly; samples 4962 and 4969 do not have a distinct Ce anomaly), floor rock (sample 4703 without a distinct Ce anomaly; sample 4880 with a distinct Ce anomaly), gradational between the tonstein and the floor rock (4911 without a distinct Ce anomaly), or a coal with kaolinite inclusions (41010 without a distinct Ce anomaly). All of the latter samples comprise the highest normalized Lu values. Basically, all of the other samples have similar spider plots, varying in their normalized REE but not in the distribution patterns. Most of the samples have L-type distributions (the exceptions being 4703, 4823, 4962, and 41010) and negative Eu anomalies (the exceptions being 4703 and 4962; Figs. 10 and 11).
Upper continental crust-normalized REE distributions for all of the studied samples. Normalization after Taylor & McLennan (Reference Taylor and McLennan1985)

Upper continental crust-normalized REE distributions for the samples with the highest normalized Lu. Normalization after Taylor & McLennan (Reference Taylor and McLennan1985)

While the Ce N /Ce N * vs. Eu N /Eu N * and Gd N /Gd N * vs. Eu N /Eu N * trends show flat, non-significant distributions for the tonstein samples, the Gd N /Gd N * vs. Ce N /Ce N * (Fig. 12) plot shows a positive correlation (r2 = 0.59 with the inclusion of sample 4746 (a weathered tonstein; significant at the 1% level); r2 = 0.36 (below the r2 = 0.37 point for being significant at the 5% level). Removing the weathered and gradational tonsteins from consideration yields an r2 = 0.46 which is significant at the 5% level. Sample 41010, the coal with tonstein-like inclusions, and the coal samples from the 4754–4765 series (data from Hower et al., Reference Hower, Ruppert and Eble1999) exhibit a non-significant distribution to the low-Gd N /Gd N * side of the tonstein distribution indicating that the tonstein has a more pronounced M-type-distribution tendency than the coals.
Gd N /Gd N * vs. Ce N /Ce N * distribution showing the locations of coal data from Hower et al. (Reference Hower, Ruppert and Eble1999)

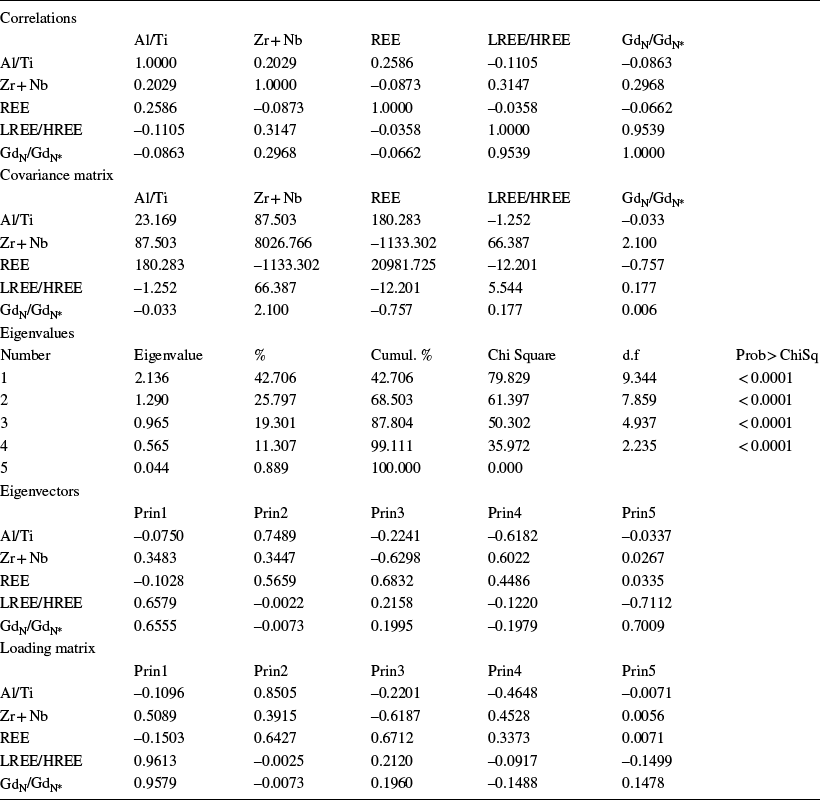
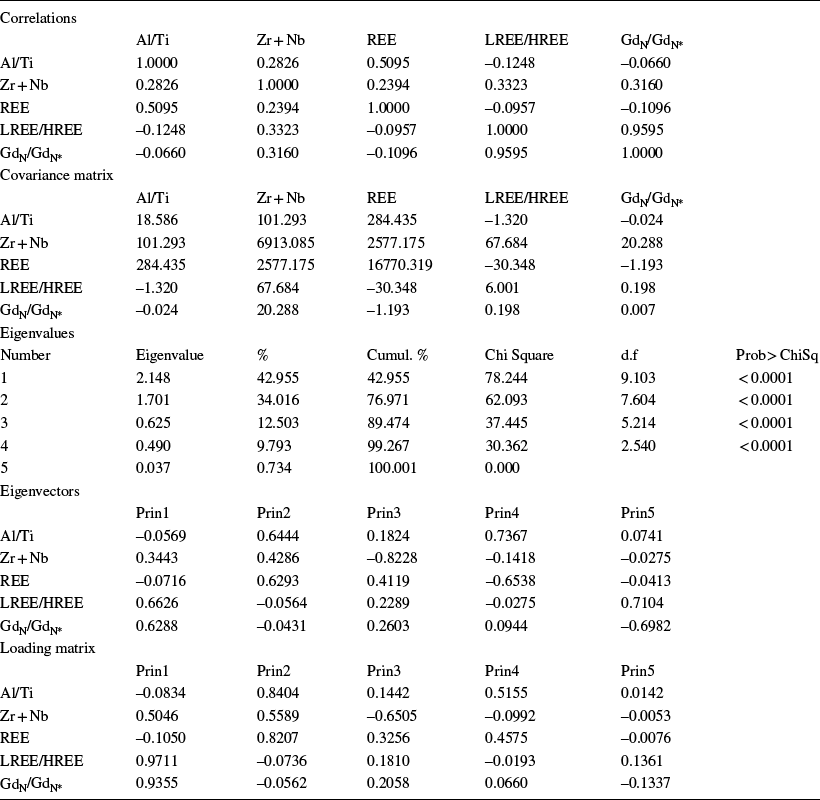
Principal components analysis (PCA) (JMP® Pro 17.0.0, © JMP Statistical Discovery LLC, Cary, North Carolina, USA) for all of the samples shows that the first Eigenvector, contributing to 42.71% of the variation, comprises Al2O3/TiO2, LREE/HREE, and Gd N /Gd N * with a less significant contribution by Zr + Nb (Fig. 13a; supporting statistics in Table 9). The second Eigenvector, contributing to 25.80% of the variation, is composed of Al2O3/TiO2 and REE (ppm; ash basis) with a less significant contribution of Zr + Nb. The most significant outliers are 4703, 4746, 4806, 4969, and 4880, the weathered tonsteins and floor samples noted above (Fig. 13b). Without the floor and coal samples, the first Eigenvector, contributing to 42.96% of the variation, is comprised of Zr + Nb, LREE/HREE, and Gd N /Gd N * (Fig. 14a; supporting statistics in Table 10). The second Eigenvector, contributing to 34.02% of the variation, consists of Al2O3/TiO2, Zr + Nb, and REE. The outliers are the weathered tonsteins (Fig. 14b).
a Principal components analysis (PCA) distribution for selected variables for all of the samples. Note that the vectors for LREE/HREE and Gd N /Gd N * overlap at this scale. b Outlier distribution for all samples

Principal components analysis parameters for the analysis of all samples

a Principal components analysis (PCA) distribution for selected variables for the tonstein samples. Note that the vectors for LREE/HREE and Gd N /Gd N * overlap at this scale. b Outlier distribution for all samples

Principal components analysis parameters for analysis of the tonstein

In previous studies, the relationship between Al2O3/TiO2 and REE (Dai et al., Reference Dai, Nechaev, Chekryzhov, Zhao, Vysotskiy, Graham, Ward, Ignatiev, Velivetskaya, Zhao, French and Hower2018) was used to discern a relationship, e.g. the REE distribution and the detrital minerals (represented, in part, by TiO2). The Al2O3/TiO2 vs. REE relationships is shown in Fig. 15 but it does not show a significant distribution among the tonstein samples. Samples 4703 and 4969, distinct outliers, are weathered tonsteins.
REE vs. Zr + Nb (ppm; ash basis) for all samples

Other Elements
Zircons can contribute REE and Y to a coal as a detrital or tuffaceous mineral. Zircons were noted in the Fire Clay tonstein by Hower et al. (Reference Hower, Andrews, Wild, Eble, Dulong and Salter1994) and in the present study. The relationship between Zr + Nb (ppm; ash basis) and Al2O3/TiO2 (after Dai et al., Reference Dai, Nechaev, Chekryzhov, Zhao, Vysotskiy, Graham, Ward, Ignatiev, Velivetskaya, Zhao, French and Hower2018), with the TiO2 being an indicator of detrital contributions and a trace mineral in tuffaceous deposition (Hower et al., Reference Hower, Andrews, Wild, Eble, Dulong and Salter1994), is shown in Fig. 16. Within the tonstein population, excluding the weathered samples (4703, 4962, and 4969), there is a clustering of the points but there is no significant relationship, with the Zr + Nb showing a greater relative variation than the Al2O3/TiO2. Zircons can contain trace amounts of Y but the relationship between Zr and Y (Fig. 17) is not significant for these samples.
Al2O3/TiO2 vs. Zr + Nb (ppm; ash basis) for all samples

Zr vs. Y (both ppm; ash basis) for all samples

Compared with the world hard coal average (after Ketris & Yudovich, Reference Ketris and Yudovich2009) (admittedly, not necessarily the best baseline for the tonstein and floor samples, but they are within or adjacent to coal), few elements exceed even the 2 × -world coal average level. Lithium reaches its highest concentrations at several Hazard South and Vicco quadrangle locations. Aside from Ag, with only one tonstein sample (weathered sample 4962) not reaching the 2 × level, only Zr and Ta exceed the 2 × level in five of the 27 tonstein samples. The greatest Ta concentrations correspond with some of the highest Nb samples (Fig. 18), with samples 4647, 4806, and 4895 all being from Vicco quadrangle sites. The largest Zr value corresponds with the largest Y value (weathered sample 4969; Fig. 17). The same sample also has the highest REE concentrations (except for Eu) and the largest Th and U contents of any of the tonstein samples. The high Zr, Y, REE, and Th + U in sample 4969 and, to a lesser extent, in sample 4962, might be a function of an enhanced concentration of zircons and REE-bearing minerals, such as monazite, in the weathered tonstein.
Nb vs. Ta (both ppm; ash basis) for tonstein, weathered tonstein, floor, and coal

Discussion
The tonstein rock type, after Winchester and Floyd (Reference Winchester and Floyd1977) and later utilization of the defining geochemical parameters, is largely trachyandesite to trachyte (Fig. 19) and has a relatively constant Zr/TiO2 value but Nb/Y values which change significantly, especially as there is little change in the designated fields, suggesting that tonsteins present in this study have all come from a very similar source.
Rock classification based on Nb/Y vs. Zr/TiO2 after Winchester and Floyd (Reference Winchester and Floyd1977) and Vergunov et al. (Reference Vergunov, Arbuzov, Soktoev, Ilenok and Chekryzhov2022)

The tonstein mineralogy is generally dominated by kaolinite (59–91% of the unweathered samples) with illite > quartz comprising the remainder of the major minerals. Much of the kaolinite is a secondary mineral after volcanic glass, as evidenced not only by its vermicular texture derived from other original volcanic minerals (e.g. mica; Dai et al., Reference Dai, Ward, Graham, French, Hower, Zhao and Wang2017c) but also by its matrix occurrence for other minerals rather than detrital modes of occurrence (Fig. 5) and in Hower et al. (Reference Hower, Berti, Hochella and Mardon2018), although phenocrysts of kaolinite suggest a primary deposition of those forms. Minor amounts of clinoptilolite, siderite, pyrite, gypsum, chlorite, and anatase were detected and quantified by XRD + Siroquant. Sanidine, apatite, zircon, ilmenite, pyrite, crandallite, florencite, galena, siderite, and goethite were detected by SEM among these samples. Monazite and kaolinite phenocrysts were noted in the electron microscopy study of the correlative Dean coal (Hower et al., Reference Hower, Berti, Hochella and Mardon2018); Hower et al. (Reference Hower, Andrews, Wild, Eble, Dulong and Salter1994) found sanidine (some with alteration to quartz and kaolinite), β-quartz, magnetite, magnetite with an ilmenite core, anatase, rutile, and weathered titanite; and Robl and Bland (1977) noted the presence of kaolinite pseudomorphs after β-quartz and sanidine. Mineralogical evidence for a volcanic-ash deposit includes vermicular kaolinite, sanidine, β-quartz, euhedral zircons, ilmenite, apatite, and phosphates including crandallite-group minerals, monazite. and rutile (or anatase). The possibility that some of the phosphates and TiO2 minerals could be of secondary origin cannot be discounted. The Fe-Ti oxides shown in Fig. 7c,d give strong evidence for the magmatic origin of at least some of the Fe-Ti oxide/TiO2 suite.
The tonstein geochemistry is dominated by Al2O3 and SiO2, a function of the dominance of kaolinite. The total REE content, exceeding 400 µg/g in one case (sample 4997) and < 100 µg/g at many of the sites, is, perhaps, deceptively small as the REE in the coal is often reported on an ash basis (e.g. Hower et al., Reference Hower, Eble, Dai and Belkin2016, Reference Hower, Eble, Backus, Xie, Liu, Fu and Hood2020). The tonstein, with REE and REY-bearing minerals such as apatite, crandallite, monazite, florencite, and zircon, was, indeed, a primary source of the REE in the surrounding coal. That influence may have been through direct deposition of REY-bearing minerals, as in coal sample 41,010, or via remobilization of the REY in the tonstein by leaching.
Among the tonsteins, some of the highest REY concentrations occur in tonsteins that were possibly gradational with non-tonstein lithologies (samples 4673 and 4911; noted in both the megascopic appearance and in the <40% kaolinite content) and in weathered outcrops (samples 4962 and 4969). The reasons for this could not be explored further in this study because crushed whole-rock samples were being analyzed. The character of these samples is seen in the upppermost UCC spidergram plots (Figs. 10 and 11), with the gradational and weathered tonsteins, the floor rock, and the coal sample having the greatest and, in some cases, the most significant, negative Eu anomalies. In the PCA analyses (Figs. 13b and 14b), the weathered tonsteins are among the outliers. In the assessment of REE vs. Zr + Nb (Fig. 15), Al2O3/TiO2 vs. Zr + Nb (Fig. 16), and Zr vs. Y (Fig. 17), weathered sample 4969 stands out as being distinctly different from the other tonstein samples. Both weathered samples are on the low-Ta and, to a lesser extent, the low-Nb end of the Nb vs. Ta plot (Fig. 18). Transitional sample 4673 is at the low-Nb/Y and high-Zr-TiO2 end of the Winchester and Floyd (Reference Winchester and Floyd1977) rock classification (Fig. 19).
What are the implications of the outliers? For the transitional tonsteins, the rock type was gradational between the tonstein, as represented by the apparently non-gradational samples with 59–92% kaolinite, and a relatively illite-rich lithology. In the deposition of the partings, the passage from an illitic clay to the kaolinite-rich tonstein can be seen (Fig. 2a,b); the boundary between the two is transitional, as seen by the dark streaks in the lower quarter of the tonstein (Fig. 2b). The illitic clay, presumed to have been a terrigenous depositional event, is an influence on the REE chemistry of the coal underlying the tonstein, with the coal below the illitic clay having a lower REE content than coal directly underlying the ash-fall tonstein (Fig. 2c) (Hower et al., Reference Hower, Ruppert and Eble1999, Reference Hower, Eble, Backus, Xie, Liu, Fu and Hood2020). Weathering of the tonstein preferentially removes kaolinite from the rock, leaving behind REE-bearing phosphates (apatite, crandallite, florencite, monazite) and Y-bearing zircon, the latter causing a relative enrichment in the REY.
Summary
A lanthanide-rich, 315–317 Ma (after Machlus et al., Reference Machlus, Shea, Hemming, Ramezani and Rasbury2020) volcanic ash-fall tonstein occurs in association with the Middle Pennsylvanian Duckmantian-age Fire Clay coal in eastern Kentucky. Ranging from 1.5 to nearly 29 cm in thickness in the study area, the tonstein was deposited generally during peat accumulation, although sites with the tonstein at the base of the coal or within the underclay are known. Outside of the study area, the ash fall is known to have been dispersed within the peat, resulting in REE-rich coal lithologies but not as a distinct parting (Hower et al., Reference Hower, Berti, Hochella and Mardon2018; Mardon & Hower, Reference Mardon and Hower2004). In addition to the tonstein, one coal and four floor (underclay) samples were studied.
Some of the tonsteins were transitional to illitic partings and two of the samples were from roadcuts (therefore, weathered samples). The kaolinite content of the non-weathered tonsteins and exclusive of the partings known to be transitional to other lithologies ranged from 50–92%. Illite and quartz were present as major to minor minerals in all cases, with clinoptilolite, siderite, pyrite, gypsum, chlorite, and anatase detected by XRD and Siroquant mineralogy; sanidine, apatite, zircon, ilmenite, pyrite, crandallite, florencite, galena, siderite, and goethite observed during SEM examination of three of the samples; and monazite, β-quartz, magnetite, magnetite with an ilmenite core, rutile, and weathered titanite known from studies by Robl and Bland (1977), Bohor and Triplehorn (1981, 1993), and Hower et al., (Reference Hower, Andrews, Wild, Eble, Dulong and Salter1994, Reference Hower, Berti, Hochella and Mardon2018). Evidence for a volcanic-ash deposit includes vermicular kaolinite, sanidine, β-quartz, euhedral zircons, ilmenite, apatite, phosphates (including crandallite-group minerals and monazite), and rutile (or anatase). Zircons and the REE-bearing phosphates contributed to the REY concentrations in the tonstein. The REE concentration is enriched in the weathered tonsteins due to the preservation of REE-bearing phosphates (apatite, crandallite, florencite, monazite) and Y-bearing zircon at the expense of the kaolinite weathered from the rock.
Acknowledgements
The samples were collected during the period 1990–1992 by Eble and Hower and colleagues. The collection effort and the supporting chemical analyses were supported by grants to the Kentucky Geological Survey and to the University of Kentucky Center for Applied Energy Research from the Commonwealth of Kentucky. The analytical work at the China University of Mining & Technology was supported by the National Key Research & Development Program of China (No. 2021YFC2902003), the National Natural Science Foundation of China (No. 42272194), and the 111 Project (No. B17042).
Authors’ Contributions
Liu, Dai, Dong, Gao – chemical, mineralogical, and SEM analyses; Berti – TEM analysis; Eble and Hower – collection of samples; Liu, Dai, Berti, Eble, Hower – writing of manuscript.
Funding
As stated in the acknowledgments.
Data availability
All of the data are available in the tables. The remaining samples are stored at the Kentucky Geological Survey's Earth Analysis Research Laboratory in Lexington, Kentucky, USA and at the China University of Mining & Technology.
Declarations
Conflicts of interest/Competing interests
The authors declare no conflict of interest or competing interests.