


Introduction
Healthcare-associated infections (HAIs) remain a major public health challenge worldwide. They are among the most frequent adverse events occurring during healthcare delivery and are associated with increased morbidity, mortality, prolonged hospital stays, higher healthcare costs, as well as the emergence and spread of antimicrobial resistance. 1–Reference Allegranzi, Bagheri Nejad and Combescure3 Despite advances in medical care and infection prevention practices, HAIs continue to affect millions of patients each year, particularly in low-and middle-income countries, where healthcare systems often face resource constraints. 2
Given their clinical and economic burden, the prevention and control of HAIs constitute a priority for healthcare institutions. The occurrence of HAIs is influenced by a combination of patient and healthcare-related factors. Extreme ages, underlying comorbidities, immunosuppression, malnutrition, intensive care unit stay, and exposure to invasive medical devices have consistently been identified as major risk factors. 2–Reference Allegranzi, Bagheri Nejad and Combescure3 Identifying these factors is essential for planning infection prevention and control (IPC) measures and focusing preventive efforts on patients at higher risk.
Repeated point prevalence surveys (PPS) represent a practical and standardized method for monitoring HAIs at the hospital level. Beyond estimating the prevalence of infections, they provide valuable information on temporal trends and allow healthcare facilities to evaluate the impact of IPC strategies, identify priority areas for intervention, and guide resource allocation. 4 Monitoring trends over time is therefore an essential indicator of the performance of infection prevention and control efforts.
In Tunisia, data on the epidemiology and temporal evolution of HAIs remain limited, particularly at the hospital level. The absence of a centralized national surveillance system has resulted in scattered and fragmented evidence. Previous institutional surveys in Central Tunisian university hospitals reported an increase in HAI prevalence from 12.3% in 2012 to 15.5% in 2020, Reference Ghali, Ben Cheikh, Bhiri, Khefacha, Latiri and Ben Rejeb6 although southern Tunisian hospitals reported 8.4% in 2023. Reference Baklouti, Ben Hmida and Ben Ayed7 A national prepandemic survey documented substantial variability in HAI prevalence and antimicrobial resistance across healthcare facilities. Reference Letaief, Rejaibi and Hechaichi9 Although several prevalence studies have been conducted, few have assessed long-term trends using standardized methodologies, limiting the ability to evaluate the effectiveness of local infection control programs and to compare findings across different periods.
To address this gap, we conducted this study to assess temporal trends in HAI prevalence at Hedi Chaker University Hospital, southern Tunisia, to describe their distribution by infection sites and causative pathogens, and to identify factors associated with HAI occurrence among hospitalized patients.
Methods
Study design and setting
This repeated cross-sectional prevalence study was conducted at Hedi Chaker University Hospital, a tertiary-care teaching hospital in southern Tunisia. As a major referral center for complex medical conditions and a training institution for medical students, residents, and healthcare professionals. The hospital provides a representative setting for studying HAIs in a high-volume healthcare environment. The hospital has a capacity of 1,000 beds and comprises a wide range of medical, surgical, and intensive care departments with a principally medical vocation. The departments included in the analysis were classified into three categories:
-
1. Medical wards: Cardiology, Pneumology, Gastroenterology, Infectious Diseases, Internal Medicine, Endocrinology, Hematology, Dermatology, Rheumatology, Nephrology, Pediatrics, Neonatology, Psychiatry, and Child and Adolescent Psychiatry.
-
2. Surgical wards: Pediatric Surgery and Gynecology–Obstetrics.
-
3. Intensive Care Units (ICUs): Pediatric Intensive Care Unit and Anesthesia–Resuscitation Unit.
Emergencies and Hemodialysis Departments were excluded because they function as day-hospital services and do not provide conventional inpatient care. Hospitalwide surveillance of HAIs through PPS was initiated in 2017. Since then, data have been collected using a locally adapted protocol and standardized data collection forms that have been periodically updated. Surveys were conducted in 2017, 2019, 2023, 2024, and 2025 during the same predefined period (April–May) to minimize the influence of seasonal variations in HAI occurrence and antimicrobial prescribing practices. Each survey followed a point-prevalence design, consisting of a single-day assessment in each participating department using a standardized methodology across all survey years.
Data collection
The surveys were conducted by the IPC Department, with the involvement of a multidisciplinary team of health-care professionals in the identification and validation of infections. Before each survey, standardized training sessions were provided to all investigators to ensure uniform data collection and consistent application of case definitions. Data were collected through a comprehensive review of patients’ medical records and, when necessary, consultation with the healthcare staff responsible for patient care. Only active HAIs present on the survey date were recorded.
HAIs were defined according to the Centers for Disease Control and Prevention (CDC) criteria. Reference Horan, Andrus and Dudeck5 Eligible patients included all individuals who had been hospitalized for at least 48 hours at the time of the survey, as well as patients presenting with a surgical site infection within 30 days following surgery or within one year after the implantation of a prosthesis or other implantable device. Collected data included demographic and clinical characteristics, underlying comorbidities, exposure to invasive medical devices, and detailed information on HAIs, including infection occurrence, anatomical site, and microbiological findings when available. Participation of hospital departments was voluntary. All collected data were anonymized and handled confidentially, and survey results were reported in aggregate form to ensure the confidentiality of patients and participating departments.
Statistical analysis
Data analysis was performed using IBM SPSS Statistics version 20.0. Categorical variables were described as frequencies and percentages. Continuous variables were expressed as the mean ± standard deviation when normally distributed and as the median and interquartile range otherwise. Temporal trends of HAI prevalence, infection sites, and causative pathogens were assessed using Poisson regression (prevalence ratio (PR) (95% CI); annual increase; p).
Associated factors of HAIs were first explored using χ2 test and univariate logistic regression analysis (Crude Odds Ratio (COR), 95% Confidence Interval (CI)). Variables with a P value <.20 in the univariate analysis were included in a multivariate logistic regression model. Validation of the final model was assessed using goodness-of-fit (Hosmer–Lemeshow test) and discrimination measures (Area Under the Receiver Operating Characteristic curve (AUROC), sensitivity, and specificity). Statistical significance was defined as a two-sided P value <.05.
Results
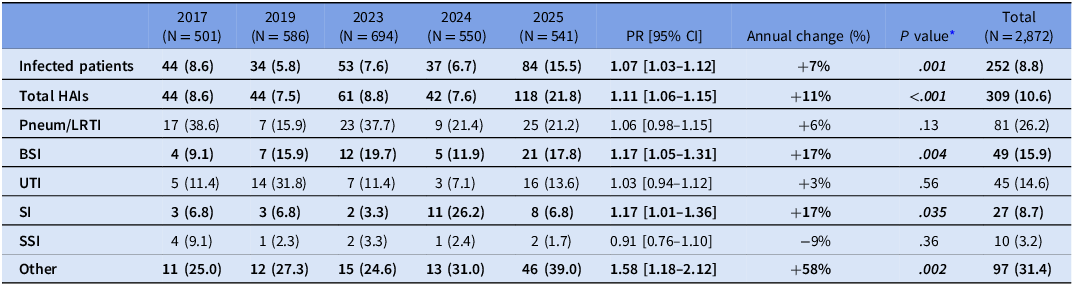
Overall, 2,872 patients were included over the five surveys. All eligible departments participated in each survey round. Their median age was 35 years [17–55]. Patients were female in 50.5% (n = 1,437). The most frequent HAI was pneumonia/lower respiratory tract infection, accounting for 26.2% (n = 81) of all infections (Table 1).
Distribution and trends of healthcare-associated infected patients by year and infectious site (Hedi Chaker University Hospital, 2017–2025)

Table 1. Long description
The table presents data on healthcare-associated infected patients from 2017 to 2025, focusing on different infectious sites. It includes columns for each year, with the number of patients and percentages in parentheses. The rows categorize the data by infected patients, total HAIs, Pneumonia/LRTI, BSI, UTI, SI, SSI, and Other. Notable trends include an increase in infected patients and total HAIs over the years, with significant annual changes and P values indicated. The table highlights the distribution and trends of various infectious sites, showing variations in annual changes and statistical significance.
Bold and bold italic values indicate statistical significance.
HAIs, Healthcare-associated infections; Pneum/LRTI, pneumonia/lower respiratory tract infection; BSI: bloodstream infection; UTI, urinary tract infection; SI, skin infection; SSI, surgical site infection; Other, other healthcare-associated infections; PR, Prevalence Ratio; CI, Confidence Interval.
* P value derived from the Wald test of the Poisson regression model.
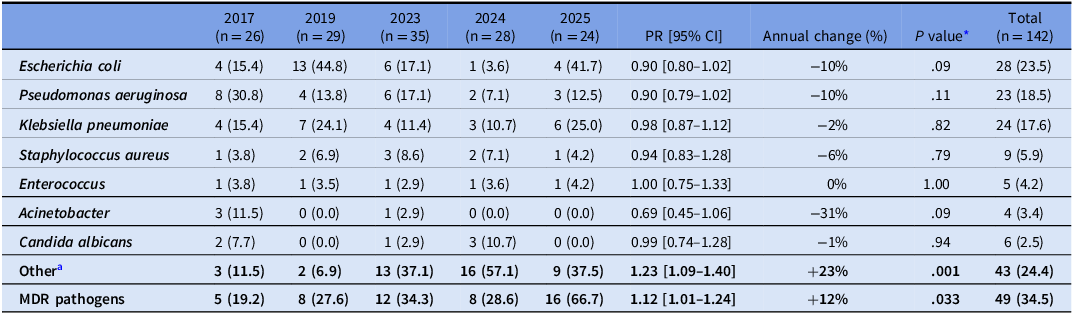
The prevalence of HAIs increased significantly over time (COR = 1.11; 95% CI: [1.06–1.15]; P < .001), corresponding to an estimated annual prevalence increase of 10%. As for temporal trends by infection site, a significant increase was noted for bloodstream infections (PR = 1.17; 95% CI: 1.05–1.31; annual increase = 17%; P = .004) (BSIs) as well as for skin and soft tissue HAIs (PR = 1.17; 95% CI: 1.01–1.36; annual increase = 17%; P = .035) (Table 1). Microbiological documentation was available for 142 HAIs (45.9 %). Gram-negative bacilli dominated, with Escherichia coli being the most frequently isolated pathogen (n = 28; 23.5%), followed by Pseudomonas aeruginosa (n = 22; 18.5%) and Klebsiella pneumoniae (n = 21; 17.6%). Overall, 49 isolates (34.9%) were identified as multidrug-resistant (MDR). Chronological trends of MDR pathogens showed a significant increase during the study period, with an annual rise of 12% (PR = 1.12; 95% CI: 1.00–1.24; P = .033) (Table 2).
Distribution and trends of laboratory-confirmed HAIs by causative pathogen (Hedi Chaker University Hospital, 2017–2025)

Table 2. Long description
The table presents the distribution and trends of laboratory-confirmed healthcare-associated infections (HAIs) by causative pathogen at Hedi Chaker University Hospital from 2017 to 2025. It includes data for seven pathogens and other categories, showing the number and percentage of infections for each year. The table also provides prevalence ratios (PR) with 95% confidence intervals (CI), annual change percentages, and P values for each pathogen. Row 1: Escherichia coli, 2017 (4, 15.4 percent), 2019 (13, 44.8 percent), 2023 (6, 17.1 percent), 2024 (1, 3.6 percent), 2025 (4, 41.7 percent), PR 0.90 [0.80-1.02], -10 percent, P value 0.09, Total (28, 23.5 percent). Row 2: Pseudomonas aeruginosa, 2017 (8, 30.8 percent), 2019 (4, 13.8 percent), 2023 (6, 17.1 percent), 2024 (2, 7.1 percent), 2025 (3, 12.5 percent), PR 0.90 [0.79-1.02], -10 percent, P value 0.11, Total (23, 18.5 percent). Row 3: Klebsiella pneumoniae, 2017 (4, 15.4 percent), 2019 (7, 24.1 percent), 2023 (4, 11.4 percent), 2024 (3, 10.7 percent), 2025 (6, 25.0 percent), PR 0.98 [0.87-1.12], -2 percent, P value 0.82, Total (24, 17.6 percent). Row 4: Staphylococcus aureus, 2017 (1, 3.8 percent), 2019 (2, 6.9 percent), 2023 (3, 8.6 percent), 2024 (2, 7.1 percent), 2025 (1, 4.2 percent), PR 0.94 [0.83-1.28], -6 percent, P value 0.79, Total (9, 5.9 percent). Row 5: Enterococcus, 2017 (1, 3.8 percent), 2019 (1, 3.5 percent), 2023 (1, 2.9 percent), 2024 (1, 3.6 percent), 2025 (1, 4.2 percent), PR 1.00 [0.75-1.33], 0 percent, P value 1.00, Total (5, 4.2 percent). Row 6: Acinetobacter, 2017 (3, 11.5 percent), 2019 (0, 0.0 percent), 2023 (1, 2.9 percent), 2024 (0, 0.0 percent), 2025 (0, 0.0 percent), PR 0.69 [0.45-1.06], -31 percent, P value 0.09, Total (4, 3.4 percent). Row 7: Candida albicans, 2017 (2, 7.7 percent), 2019 (0, 0.0 percent), 2023 (1, 2.9 percent), 2024 (3, 10.7 percent), 2025 (0, 0.0 percent), PR 0.99 [0.74-1.28], -1 percent, P value 0.94, Total (6, 2.5 percent). Row 8: Other, 2017 (3, 11.5 percent), 2019 (2, 6.9 percent), 2023 (13, 37.1 percent), 2024 (16, 57.1 percent), 2025 (9, 37.5 percent), PR 1.23 [1.09-1.40], +23 percent, P value 0.001, Total (43, 24.4 percent). Row 9: MDR pathogens, 2017 (5, 19.2 percent), 2019 (8, 27.6 percent), 2023 (12, 34.3 percent), 2024 (8, 28.6 percent), 2025 (16, 66.7 percent), PR 1.12 [1.01-1.24], +12 percent, P value 0.033, Total (49, 34.5 percent).
MDR, Multidrug-resistant; PR, Prevalence ratio; CI, Confidence interval.
* P-value derived from the Wald test of the Poisson regression model.
a Other, other pathogens, including scabies and pediculosis.
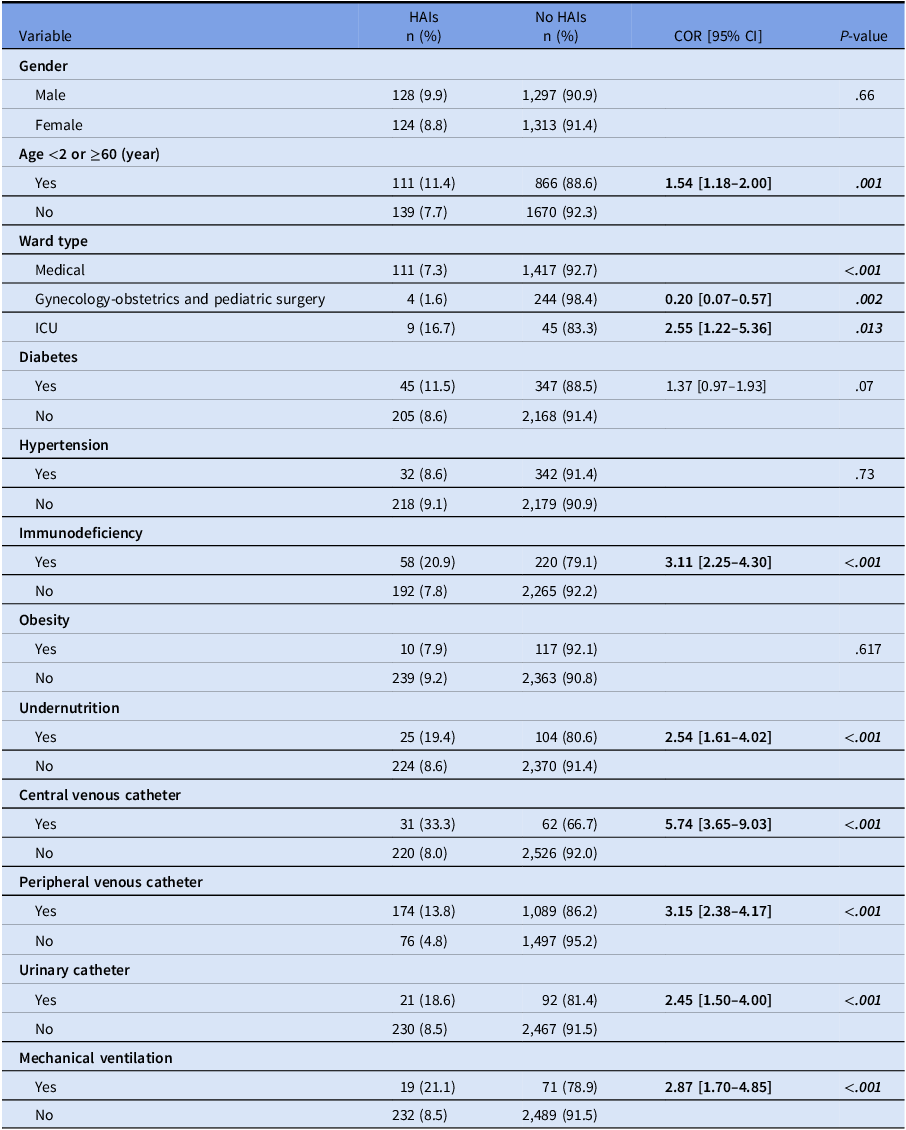
In the univariate analysis, age <2 years or ≥60 years (11.4% vs 7.7%; P = .001), admission in ICU (16.7% vs 8.9%; P < .001), immunodeficiency (20.9% vs 7.8%; P < .001), undernutrition (19.4% vs 8.6% P < .001), central venous catheter (33.3% vs 8.0%; P < .001), peripheral venous catheter (13.8% vs 4.8%; P < .001), urinary catheter (18.6 % vs 8.5%; P < .001), and mechanical ventilation (21.1% vs 8.5%; P < .001) were significantly associated with HAIs (Table 3).
Associated factors for healthcare-associated infection: results of univariate analysis

Table 3. Long description
A table with 12 rows and 6 columns comparing factors associated with healthcare-associated infections (HAIs) and no HAIs. The columns are labeled Variable, HAIs n (%), No HAIs n (%), COR [95% CI], and P-value. The variables include gender, age, ward type, diabetes, hypertension, immunodeficiency, obesity, undernutrition, central venous catheter, peripheral venous catheter, urinary catheter, and mechanical ventilation. Each row provides the count and percentage of patients with and without HAIs for each variable, along with the crude odds ratio (COR) and 95% confidence interval (CI), and the P-value. Notable trends include higher percentages of HAIs in patients with age <2 or >=60 years, ICU admission, immunodeficiency, undernutrition, central venous catheter, peripheral venous catheter, urinary catheter, and mechanical ventilation.
HAIs, Healthcare-associated infections; COR, Crude odds ratio; CI, Confidence interval; ICU, Intensive care unit.
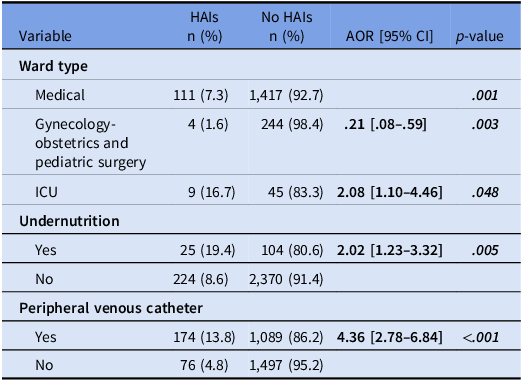
In multivariate analysis, independent associated factors of HAIs were peripheral venous catheter, undernutrition, and admission in ICU (Table 4). The Logistic regression model showed an adequate calibration (Hosmer–Lemeshow test p-value = .29) and a good discriminatory performance (AUROC = 0.73; 95% CI: 0.68–0.77; P < .001), with a sensitivity of 77.7% and a specificity of 61.5%.
Associated factors for healthcare-associated infection: results of multivariate analysis

Table 4. Long description
A table with four rows and three columns comparing factors associated with healthcare-associated infections (HAIs). The table includes variables such as ward type, undernutrition, and peripheral venous catheter. For ward type, the rows are medical, gynecology-obstetrics and pediatric surgery, and ICU. For undernutrition, the rows are yes and no. For peripheral venous catheter, the rows are yes and no. Each row shows the number and percentage of HAIs and no HAIs, the adjusted odds ratio (AOR) with 95% confidence interval (CI), and the p-value. Notable trends include higher AORs for ICU admission, undernutrition, and the presence of a peripheral venous catheter.
HAIs, Healthcare-associated infections; AOR, Adjusted odds ratio; CI, Confidence interval; ICU, Intensive care unit.
Discussion
Between 2017 and 2025, the prevalence of HAIs at Hedi Chaker University Hospital increased significantly, peaking in 2025. BSI, skin and soft tissue infections, and MDR pathogens also showed significant increases over time. Pneumonia and lower respiratory tract infections were the most frequent HAIs, although Gram-negative bacteria were the predominant pathogens identified. In addition, peripheral venous catheterization, undernutrition, and intensive care unit admission were independently associated with the occurrence of HAI.
The upward trajectory of HAI prevalence is consistent with data from Tunisian university hospitals, where repeated PPS showed HAI prevalence rising significantly from 12.3% in 2012 to 15.5% in 2020, Reference Ghali, Ben Cheikh, Bhiri, Khefacha, Latiri and Ben Rejeb6 and with southern Tunisian hospitals reporting a prevalence of 8.4% in 2023. Reference Baklouti, Ben Hmida and Ben Ayed7 The gap between high-income and low-to middle-income countries remains substantial, with African studies reporting pooled HAI prevalence ranging from 7.24% to 28%, more than twice European rates, largely attributable to structural deficits in IPC infrastructure and the absence of national surveillance systems. Reference Bunduki, Masoamphambe, Fox, Musaya, Musicha and Feasey8,Reference Letaief, Rejaibi and Hechaichi9 International comparisons suggest that HAI trends vary across healthcare settings, with differences in IPC resources potentially contributing to this heterogeneity. In Europe, adjusted HAI prevalence increased modestly from 6.5% in 2016–2017 to 8.0% in 2022–2023. 2 In contrast, a previous national US survey reported a decline in HAI prevalence from 3.2% in 2015 to 2.6% in 2023. Reference Chea, Li and Eure19 Similarly, a four-year repeated PPS conducted in an Italian tertiary hospital found no significant upward trend in HAI prevalence between 2022 and 2025. Reference Pennisi, Godoy and Camuffo20 In our setting, the observed rising trajectory should therefore be interpreted in the context of comparatively limited IPC resources. The sharp rise observed in 2025 likely reflects both the enduring consequences of the COVID-19 pandemic, during which antimicrobial-resistant HAIs increased by up to 78% for some pathogens between 2019 and 2020, 10 and the progressive accumulation of antimicrobial resistance pressure within the hospital environment. The sudden surge of the 2025 peak suggests an acute determinant over gradual risk accumulation. MDR isolates rose from 28.6% in 2024 to 66.7% in 2025, a sharper shift than the overall HAI trend, consistent with a localized outbreak in one or more high-risk units where device use and broad-spectrum antibiotic exposure favor resistant-strain dissemination. The concurrent rise in bloodstream infections, largely caused by MDR Gram-negative bacilli in our setting, supports this interpretation. Another explanation for this sharp rise could be a concurrent supply chain breakdown that caused an acute shortage of hospital-grade surface and hand disinfectants during this period.
The pathogen profile observed in our cohort, mainly a predominance of E. coli, P. aeruginosa, and K. pneumoniae, broadly mirrors both African and European surveillance data, though with differing relative rankings. A recent African systematic review similarly reported E. coli (18.3%), S. aureus (17.3%), and Klebsiella spp. (17.2%) as the leading HAI pathogens, Reference Bunduki, Masoamphambe, Fox, Musaya, Musicha and Feasey8 whereas the 2022–2023 ECDC PPS identified E. coli as the single most common European isolate (13%), followed by Klebsiella spp. and Enterococcus species. 2 The relative overrepresentation of P. aeruginosa in our series may reflect a higher local burden of device-associated and ICU-acquired infections.
The significant increase in BSIs mirrors international surveillance data: in Canadian acute care hospitals, BSI prevalence rose from 1.0% in 2017 to 1.5% in 2024, with central line-associated BSIs doubling over the same period. Reference Mitchell, Lee and Bartoszko11 In critically ill COVID-19 patients admitted to a Tunis medical ICU, BSIs constituted a major HAI subtype. Reference Trifi, Sellaouti and Mehdi12 The rising BSI trend most plausibly reflects the increasing use of invasive vascular devices in complex patients, combined with an insufficient catheter care bundle implementation. Both phenomena are, however, deeply interconnected with the rising MDR burden: MDR Gram-negative bacilli—including ESBL-producing Enterobacterales and carbapenem-resistant strains—readily colonize invasive vascular devices and evade standard empirical regimens, creating a direct pathway to device-associated BSIs. This association is well documented in the Tunisian context, where MDR organisms have been consistently identified as the predominant pathogens in hospital-acquired bloodstream infections over the past decade. Reference Trifi, Sellaouti and Mehdi12,Reference Kanzari, Ferjani and Meftah13 The postCOVID-19 period further amplified this dynamic, as the widespread use of broad-spectrum antibiotics in critically ill patients accelerated resistance selection, Reference Horan, Andrus and Dudeck5 sustaining a cycle between MDR emergence and BSI incidence that the trends observed in our series clearly illustrate.
Part of the increase observed in the “Other” HAI category may be attributable to ectoparasitic infestations, namely scabies and pediculosis, although these were not recorded as a distinct infection site and their individual trend could not be quantified. Parasitic infections more broadly are known to play a considerable role in HAIs, particularly in an increasingly complex hospital environment with a growing proportion of immunocompromised patients. Reference Fürnkranz and Walochnik14 The nonspecific cutaneous manifestations of scabies frequently lead to delayed diagnosis and sustained nosocomial transmission, Reference Kim, Kim and Yun15 and overcrowded wards with close patient contact may have created favorable conditions for transmission in our setting.
The three independent risk factors identified in the multivariate analysis—peripheral venous catheter use, undernutrition, and ICU admission—are well documented in both Tunisian and international surveys. ICU-admitted patients carry the highest HAI risk, given the convergence of severe underlying illness, multiple invasive devices, and intensive antibiotic exposure; national multicenter data from Tunisian ICUs reported an HAI prevalence of 25.2%, further corroborating this gradient. Reference Jamoussi, Ayed and Ben Ismail16 Undernutrition compromises mucosal integrity and immune defense mechanisms, rendering affected patients disproportionately vulnerable to nosocomial pathogens, a finding consistently reported across PPS conducted in comparable settings, and addressing it has been proposed as an integral component of HAI reduction strategies. Reference Ghali, Ben Cheikh, Bhiri, Khefacha, Latiri and Ben Rejeb6,Reference Baklouti, Ben Hmida and Ben Ayed7,Reference Fitzpatrick, Skally and O’Hanlon17 The identification of peripheral venous catheter use as an independent predictor is noteworthy: a systematic review showed that peripheral venous catheters account for a mean of 23% of nosocomial catheter-related bloodstream infections, with prolonged dwell time and emergent insertion as the main risk factors—yet this device remains systematically under-surveilled compared to central venous access. Reference Mermel18
To our knowledge, this is one of the few studies in Tunisia to document HAI trends over a prolonged period spanning nearly a decade, using a standardized and reproducible methodology across five successive surveys—a design that confers particular reliability to the temporal trends reported. However, some limitations should be acknowledged. The PPS methodology, although well-suited for repeated trend monitoring, provides a cross-sectional snapshot that may not fully capture the true HAI incidence. Moreover, the single-center design limits generalizability.
Taken as a whole, these findings paint an alarming picture of a growing HAI burden calling for strengthened IPC programs targeting modifiable risk factors, sustained investment in microbiological surveillance, and a coordinated national response. Efforts to improve infection prevention in Tunisian hospitals are real and ongoing, as reflected in the successive implementation of IPC measures and the commitment to repeated prevalence monitoring over nearly a decade, achievements that deserve recognition. However, the sustained upward trend in HAI prevalence underscores that these efforts, although meaningful, remain insufficient and must be reinforced. In this perspective, building a national HAI surveillance network would be a pivotal milestone, providing the continuous, multi-site data needed to guide targeted interventions and antimicrobial stewardship.
Financial support
None reported.
Competing interests
All authors report no conflicts of interest relevant to this article.

 Open access

