Nomenclature
- ADS-B
-
Automatic Dependent Surveillance-Broadcast
-
 ${R_c}$
-
containment radius
- CW
-
continuous wave
- DDS
-
digital multi-sweep
- EIRP
-
jammer effective isotropic radiated power
- EUROCAE
-
European Organisation for Civil Aviation Equipment
- EPU
-
estimated position uncertainty
- FSPL
-
free space path loss
- GNSS
-
Global Navigation Satellite System
- GPS
-
Global Positioning System
- HIL
-
horizontal integrity limit
- HPL
-
horizontal protection level
-
${J_c}$
-
critical jamming signal power
-
${J_r}$
-
jamming signal power
-
$J/S$
-
jamming to signal power ratio
-
${(J/S)_c}$
-
critical jamming to signal power ratio
- NACp
-
Navigation Accuracy Category for Position
- NACv
-
Navigation Accuracy Category for Velocity
- NIC
-
Navigation Integrity Category
- PVT
-
positioning, velocity and timing
- RFI
-
radio frequency interference
- RTCA
-
Radio Technical Commission for Aeronautics
- SDA
-
System Design Assurance
- SIL
-
Source Integrity Level
- SIS
-
signal-in-space
-
${S_r}$
-
authentic GNSS signal power


1.0 Introduction
Global Navigation Satellite Systems (GNSS) are an essential source of positioning, velocity and timing (PVT) in many fields, including critical infrastructure. This includes aviation where GNSS is commonly used as a primary source of navigation for both commercial and general aviation aircraft as well as ground vehicles. GNSS also provides precise timing for numerous communications and surveillance systems in aviation [1].
However, GNSS being a space-based PVT source comes with some inherent vulnerabilities. One of them is the susceptibility to GNSS interference, the scope of this research specifically deals only with type interference jamming. GNSS jamming can be described as the transmission of an unauthorised signal in or near the frequency reserved for GNSS. GNSS jamming of sufficient power may cause the GNSS receiver to lose track of the authentic GNSS signal leading to the unavailability of the PVT information [Reference Whitty and Walport2, 3]. GNSS jamming can be differentiated by the character of the signal. Some of the most commonly described types of jammers based on signal are narrowband jammers, spread spectrum jammers, sawtooth jammers, chirp jammers and wideband gaussian jammers [Reference Morales Ferre, de la Fuente and Lohan4].
In recent years there have been many cases of GNSS jamming impacting aircraft both in flight and when approaching an airport leading to an impact on airport operations. Operations of small airports that only have GNSS-based approach procedures are especially vulnerable because without GNSS no non-visual approach is possible in these airports making it impossible to operate in poor visibility conditions [5, 6].
There are two main sources of information on the impact of jamming on aircraft receivers. The first are direct crew reports which can be directed to the air navigation service provider (ANSP) and/or the aircraft operator. There are also tools specifically designed to collect GNSS interference impact reports from crew members. In the European region, the network manager EUROCONTROL operates a system called EVAIR [7], in the United States these reports can be filled via the NAVCEN website [8]. An overview of reports gathered from 2014 to 2020 by EUROCONTROL is available for example in their Think paper # 9 “Radio Frequency Interference to satellite navigation: An active threat for aviation?” [9]. The other information source on the impact of jamming on aircraft is Automatic Dependent Surveillance-Broadcast (ADS-B), specifically ADS-B position quality indicators describing navigation accuracy and integrity. ADS-B quality indicators consist of:
-
• Navigation Accuracy Category – Position (NACp)
-
• Navigation Accuracy Category – Velocity (NACv)
-
• Navigation Integrity Category (NIC)
-
• Source Integrity Level (SIL)
-
• System Design Assurance (SDA)
ADS-B position quality indicators are a proven data source of GNSS jamming detection. The most commonly used ones are NACp and NIC. Many papers describe various approaches and detection algorithms for GNSS jamming detection from ADS-B. For instance, Darabseh et al. [Reference Darabseh, Bitsikas and Tedongmo10] suggests using the null values for NACp and NIC to indicate interference. Researchers from Stanford used a bayesian online changepoint detection model based on the NIC indicator and gaps in aircraft position data to detect GNSS interference [Reference Liu, Blanch, Lo, Chen and Walter11]. Lukes et al. [Reference Lukes, Topkova, Vlcek and Pleninger12] emphasises the importance of monitoring the NACp values decrease, not just NACp null values. EUROCONTROL described a grid probability model, based on ADS-B trajectory gaps, to identify the possible location of the RFI source [Reference Jonas and Vitan13].
Following up on the development of jamming detection from ADS-B, localisation algorithms using the same data emerged. In research by Liu et al. [Reference Liu, Lo and Walter14] focused on one such localisation algorithm an estimate of −115 dBW was used as the maximum tolerable jamming power for the aircraft receiver in simulations of jamming impact on ADS-B. Another localisation approach by Dacus et al. [Reference Dacus, Liu, Lo and Walter15] used the fitting of an Euclidean Cone to ADS-B data with a low NIC indicator to give a rough estimate of the jamming source location.
When deriving information relevant to GNSS jamming from ADS-B quality indicators, a crucial parameter is the critical value of jamming to signal ratio, devoted as
 ${(J/S)_c}$
. This value represents the jamming to signal ratio
 $J/S$
necessary for the receiver to lose track of the already acquired authentic GNSS signal. Additionally, the jamming to signal ratio preventing the reacquiring of previously lost GNSS signal also plays an important role in some applications and computations. These two values differ within a single GNSS receiver [Reference Betz and Kolodziejski16].
Unfortunately, most papers analysing receivers’ resilience to jamming generally focus on non-aircraft GNSS receivers. The few papers focused on aviation receivers were generally limited in scope and therefore limited in their indicative value. For example, the study by Osechas et al. [Reference Osechas, Fohlmeister, Dautermann and Felux17] was limited to a single aircraft model Airbus A320. The study by Truffer et al. [Reference Truffer, Scaramuzza, Troller and Bertschi18] on the other hand predominately involved helicopters.
The receiver resilience, represented by the
 ${(J/S)_c}$
value depends on the GNSS receiver type and the interference signal type. From previous research Morong et al. [Reference Morong, Puričer and Kovář19], Sabatini et al. [Reference Sabatini, Moore, Hill and Ramasamy20] it is evident that white noise and narrowband signals must be transmitted at significantly higher power levels per unit of bandwidth to completely disrupt the GNSS signal tracking compared to frequency-modulated sawtooth signals or chirp signals.
Although ADS-B quality indicators have been used successfully to detect GNSS jamming, previous papers have not correlated these indicators with specific values of GNSS jamming signal power. Understanding the behaviour of these indicators in the presence of quantified jamming signal power would greatly enhance the performance of emerging GNSS jamming localisation methods using ADS-B. Furthermore, knowing the exact
 ${(J/S)_c}$
value for aircraft receivers would also improve the localisation algorithms based on ADS-B as well as help better define impact areas around conflict zones notorious for GNSS interference.
To address these state-of-the-art limitations the presented research conducts an evaluation of how quality indicators respond and change when the aircraft GNSS receiver is affected by different jamming signal power levels. For the purposes of data gathering a series of deliberate experiments using multiple types of real aircraft and their avionics was carried out. The experiment included Boeing 737, Airbus A319, Beechcraft King Air B350 and Tecnam P2006 aircraft. Finally, the critical values of the jamming signal power, when an aircraft loses and regains track of the GNSS signal, were determined for each tested aircraft.
2.0 Method of measurement
The section sequentially introduces relevant variables, ADS-B quality indicators, the experimental measurement setup and finally the method chosen for an analysis of the correlation between GPS position outage and the jamming signal power.
2.1 Definitions of relevant variables
In general, a
 $J/S$
ratio is defined as the ratio of the jamming signal power, devoted as
 ${J_r}$
, to the authentic GNSS signal power, devoted as
 ${S_r}$
. The
 $J/S$
ratio is usually expressed in decibels and is defined by Equation (1). A specific
 $J/S$
ration value that causes a GNSS receiver to lose track of an already acquired authentic GNSS signal may be called critical jamming to signal ratio, devoted as
 ${(J/S)_c}$
.
 \begin{align}J/S = {J_r} - {S_r}\end{align}
The calculation of the jamming signal power
 ${J_r}$
in relation to the distance from the jammer, assuming free-space propagation, is given in dBW by Equation (2).
 \begin{align}{J_r} = {J_t} + {G_t} + {G_r} - L - {L_{FSPL}} = {J_t} + {G_t} + {G_r} - L - 20\ {\rm{lo}}{{\rm{g}}_{10}}\left( {\frac{{4\pi df}}{c}} \right)\end{align}
Where:
-
•
${J_t}$
is transmitted jamming signal power -
•
${G_t}$
and
${G_r}$
are transmitting and receiving antenna gain, respectively -
•
$L$
is receiver losses which do not affect propagation


The Free Space Path Loss (FSPL) equation is expressed by Equation (3), where
 $f$
is the frequency of the radio wave and
 $d$
is the distance between the receiver and the transmitter (jammer in our case).
 \begin{align}{L_{FSPL}} = \left( {\frac{{4\pi df}}{c}} \right)\end{align}
The FSPL method was preferred to models adjusted to ground signal reflection like the two-ray path model because the aircraft GPS antenna is on top of an aircraft; the fuselage of the aircraft serves almost like a ground, meaning the effect of reflected signals from the ground is near zero. Considering negligible losses in the receiver and negligible receiving antenna gain as an isotropic antenna and using the effective isotropic radiated power
 $EIRP$
, then Equation (2) can be rewritten as Equation (4):
 \begin{align}{J_r} = EIRP - 20\ {\rm{lo}}{{\rm{g}}_{10}}\left( {\frac{{4\pi df}}{c}} \right)\end{align}
Throughout the paper, the jamming power values will be described in both EIRP and electric field strength (E) at the aircraft GPS antenna location. The conversion between the two variables is described by Equation (5), where EIRP is effective isotropic radiated power in dBm,
 $E$
is electric field strength in
 ${\rm{dB\;}}\mu {\rm{V}}/{\rm{m}}$
, and
 $d$
is the distance in meters.
 \begin{align}EIRP = E + 20\ {\rm{log}}\left( d \right) - 104.8\end{align}
With a known value of
 ${S_r}$
, the
 $J/S$
ratio can be determined using Equation (1). In reverse, assuming the knowledge of
 ${(J/S)_c}$
value, it is possible to calculate from Equation (1) the critical jamming power
 ${J_c}$
that will prevent the receiver from authentic GNSS signal reception.
The value of
 ${S_r}$
can be derived from the Convention on International Civil Aviation, Aeronautical Telecommunications, Volume I, Radio Navigation Aids, Annex 10 [21] which states: ‘Each GPS satellite shall broadcast SPS navigation signals with sufficient power such that, at all unobstructed locations near the ground from which the satellite is observed at an elevation angle of five degrees or higher, the level of the received RF signal at the antenna port of a three dBi linearly-polarised antenna is within the range of −158.5 dBW to −153 dBW for all antenna orientations orthogonal to the direction of propagation.’ Similarly, the GPS Interface Specification [22] states: ‘minimum RF signal strength for the GPS L1 C/A signal, is −128.5 dBm’.
It is also possible to compute the maximum distance at which the jamming signal with a given power can jam the GNSS receiver can be obtained, devoted as
 ${d_{max}}$
. The maximum distance computation is expressed by Equation 6.
 \begin{align}{d_{max}} = \frac{c}{{4\pi f}}{10^{\frac{{EIR{P_t} - {J_c}}}{{20}}}}\end{align}
2.2 ADS-B quality indicators
The scope of the paper is limited to the analysis of ADS-B quality indicators broadcasted in ADS-B 1090ES ICAO Version 2 technology, namely NACp, NIC, SIL and SDA, as the main position quality indicators. In April 2024, over 96% of aircraft were equipped with ADS-B version 2 in the European region [23]. The following is the description of the four relevant ADS-B quality indicators and their broadcasting.
NACp provides a graduated indication of position accuracy based on the estimated position uncertainty (EPU) parameter. The EPU is defined as the radius of a circle, centred at the reported position, such that the probability that the actual aircraft position lies outside this circle is 0.05 [24, 25]. When the position information is reported by a GPS or GNSS system, EPU is commonly called horizontal figure of merit (HFOM). The NAC indicator takes values from 0 to 11. If an update has not been received from an onboard data source for NACp within the past 2.6 seconds, then the NACp subfield shall be encoded as zero, indicating unknown accuracy [24, 25].
NIC carries information about the value of the Integrity containment radius (
 ${R_c}$
). This value is derived from the horizontal protection level (HPL), the horizontal integrity limit (HIL) or another means of establishing an appropriate radius of containment. For the airborne position messages, the NIC indicator can take values from 0 to 11, while for the surface position messages, the NIC value can take only values 0, 6, 7, 8, 9, 10, 11 [24, 25].
SIL defines the probability of the reported horizontal position exceeding RC defined by NIC without alerting, assuming no avionics faults. i.e., SIL addresses the integrity of signal-in-space (SIS). The indicator takes values from 0 to 3. For GNSS position sources, the HIL or HPL is provided with a probability of
 $1 \times {10^{ - 7}}$
per hour, which sets the SIL value to three [24, 25].
SDA indicates the probability of ADS-B system malfunction causing false or misleading information to be transmitted. The ADS-B system in this context includes the ADS-B transmission equipment, ADS-B processing equipment, position source, and any other equipment that processes the position data transmitted by the ADS-B system. The indicator takes values from 0 to 3 [24, 25].
When an aircraft is airborne, the NIC indicator is determined from the airborne position message. When an aircraft is on the ground, the NIC indicator is determined from the surface position message and the aircraft operational status message. The NACp, SIL and SDA indicators are transmitted either within the aircraft operational status message or the target state and status message. The update rate of the quality indicators varies from 2.5 to 0.5 seconds depending on multiple factors. More details can be found in the standards Radio Technical Commision for Aeronautics RTCA [24], The European Organisation for Civil Aviation Equipment (EUROCAE) [25]. The latency between the parameter computations and its transmission is less than 1.5 seconds [24, 25].
If GNSS position information is unavailable in the last 60 seconds, for example, due to GNSS jamming, the transmission of the airborne position message and surface position message should be stopped. However, if barometric altitude is available then ADS-B message transmission is not suppressed. Nevertheless, since the surface position message does not contain barometric altitude the message stops transmitting when the aircraft is jammed because no position information is computed. As stated in RTCA 2009; EUROCAE 2009: ‘ADS-B Surface position Message (as well as Aircraft Operational Status Messages) is no longer broadcast 60
 $ \pm $
1 s after stopping the data input’ [24, 25].
2.3 Jamming equipment used
For the experimental measurements, two different GNSS jammers were used. For Boeing measurements, the STARGAL jammer was used. Whereas for the other three measurements on Airbus, Beechcraft and Tecnam the TG5CA jammer [26] was used. Both jammers allow for adjustment in the output power. Additionally, an external attenuator was used for the Airbus measurement allowing for better control over the output power. Furthermore, the transmission antenna used with the jammers was equipped with a metal base which minimises transmission to negative elevation angles. The stated power and electric field intensity values throughout the paper are measured for a 20 MHz bandwidth centred at the GPS L1 carrier frequency, 1575.42 MHz.
The STARGAL jammer model is a digital multi-sweep (DDS) based system that generates a type of interfering signal referred to as linear chirp. The jamming is transmitted in the frequency range of 1,563 MHz to 1,587 MHz, with a dwell time of 0.1 microseconds per the 30 kHz frequency step. This results in a sweep repetition rate of 12.5 kHz.
The TG5CA jammer transmits a sweeping jamming signal at the GPS L1 centre frequency with a bandwidth of 20 MHz measured for 99% power using the
 $\beta /2$
method as per ITU’s recommendation [27]. The maximum radiated power is an EIRP of 36.6 dBm or 4.6 W in the configuration with the manufacturer-supplied antenna. The interference signal is generated through frequency modulation using a sawtooth pattern with a frequency of approximately 85.3 kHz which corresponds to a sweep period of about
 $12\mu s$
.
2.4 Experimental measurement
In total four experimental measurements were carried out testing four aircraft models each from a different manufacturer. Specifically tested aircraft models were:
-
• Boeing B737 Max
-
• Airbus A319
-
• Beechcraft King Air 350
-
• Tecnam P2006T
The first two aircraft represent commercial aviation whereas the other two can be categorised as general aviation aircraft. Both ground and flight measurements were carried out. The ground measurements involved Boeing B737 Max and Airbus A319. While Beechcraft King Air 350 (B350) and Tecnam P2006T were in flight measurements.
In all measurements, aircraft were subjected to an increasing jamming signal power while the response in ADS-B quality indicators and cockpit avionics was monitored. To ensure sufficient ADS-B data recording an additional ADS-B receiver was deployed at the testing grounds. The ADS-B quality indicators mentioned in Section 2.2 were decoded from the captured data. The method of decoding and the presence of specific indicators in individual types of messages can be found in in RTCA [24] and The European Organisation for Civil Aviation Equipment (EUROCAE) [25].
2.4.1 Boeing and airbus measurements
Boeing B737 and Airbus A319 were stationary ground measurements with the aircraft GPS antennas and the jammer at a horizontal distance of 21 meters. Aircraft GPS antennas are located on top the the fuselage. Aircraft avionics were powered by an external power source and the inertial navigation system was aligned. The outages of position information displayed by the avionics were monitored and recorded via camera in the cockpit.
The measurements were conducted in two jammer-aircraft configurations. The first with zero mutual elevation and the second with negative elevation. The zero elevation configuration involved placing the jammer at the same height as the aircraft GPS antenna at 5.4 meters for Boeing and 5.5 meters for Airbus. In the negative elevation configuration, the jammer was placed at the height of 1.7 and 2.5 meters, respectively, in each measurement. The difference in GPS receiver antennas’ gains in each elevation was taken into account. These aircraft antenna gains reflect only the antenna radiation pattern. Thus, the
 $J/S$
ratio calculation took into account the fact that the jamming signal was coming in the direction of zero or negative elevation angle while the GPS signal was coming from significantly positive elevations.
In both configurations, the jamming signal power was increased every 60 seconds by approximately one dB to ensure that the response was reflected in the transmitted 1,090 ES messages and in the cockpit output. In Boeing testing, each measurement was conducted once. Whereas in the A319 testing, measurement was carried out twice in each configuration. Additionally, after the tested aircraft was fully jammed, the jamming power was decreased in the same increments to monitor the aircraft receiver recovery.
2.4.2 Beechcraft King Air 350 and Tecnam P2006T measurements
Both Beechcraft King Air 350 (B350) and Tecnam P2006T were deliberate and controlled flight measurements. The pilots were instructed to conduct two flight passes over the TG5CA jammer which was transmitting at a maximum power of EIRP = 36.6 dBm (4.6 W). For the analyses of the jamming impact on aircraft receivers, only the part when the aircraft is approaching the jammer was taken into account. That is because the regeneration process takes a certain amount of time after leaving the jammer impact area. Within the scope of this measurement methodology, it is not possible to determine this specific time. Additionally, there is a time delay between when the aircraft starts tracking the authentic GNSS signal and when the absence of jamming is reflected in ADS-B messages.
2.5 Logistic regression model for GNSS position outage versus jamming signal power
For further analysis, the logistic regression modelling the conditional probability of GNSS position outage in relationship to the power of the jamming signal was created. The logistic regression showcases a more accurate and detailed statistical description of the dependency. Only data from the part of flights where the aircraft is approaching the jammer were used for the analysis. This data filtering was applied since it is not possible to determine when the receiver exactly starts tracking the authentic signal due to an unspecified time delay it takes to start broadcasting the position information in ADS-B data. Data from the ground measurement were also filtered only to include those captured during periods of increasing jamming signal power.
The logistic function described in Equation 7. was fitted to the data of jamming signal power and the GNSS receiver output, represented by two states, 1 and 0. Value one means positional information is unavailable whereas zero means position information is available.
 \begin{align}p\left( x \right) = \frac{1}{{1 + {e^{ - \left( {x - \mu } \right)/s}}}} = \frac{1}{{1 + {e^{ - \left( {{\beta _0} + {\beta _1}x} \right)}}}}\end{align}
Where:
-
• x – jamming signal power (independent continuous variables)
-
•
$\mu $
– location parameter (the midpoint of the curve, where
$p\left( \mu \right) = 1/2$
,
$\mu = - {\beta _0}/{\beta _1}$
-
• s – scale parameter,
$s = 1/{\beta _1}$


Position information unavailability was derived from the NACp and NIC indicators. The position was considered lost once at least one of those indicators reached zero. Specific parts of a flight further described in Section 3.3, when the aircraft antenna was shielded from the jamming signal by the airframe, were excluded from the logistic regression dataset.
3.0 Results of measurement
The section introduces results for individual aircraft models in the form of ADS-B quality indicators and jamming signal power values when aircraft GNSS receivers lose track of the authentic signal. Subsequently, aircraft models are compared in terms of both jamming vulnerability and the ability to recover. Finally, logistic regression showcasing the dependency of GNSS position outage on the jamming signal power is displayed.
3.1 Boeing B737 Max results
In the zero elevation jammer-aircraft configuration, further referred to as B
 $737_{zer}$
, the loss of positions on both GNSS receivers as well as in ADS-B occurred at EIRP = 0.832 mW equivalent to −0.36 dBm. This corresponded to E = 78 dB
 $\mu $
V/m at the aircraft antenna location. The calculated power of the jamming signal was −68.3 dBm at the aircraft receiver for an aircraft antenna gain of −5 dB.
In the negative elevation jammer-aircraft configuration, further referred to as B
 $737_{neg}$
, both GNSS receivers failed at EIRP = 2.63 mW or 4.2 dBm. This corresponded to E = 82.6 dB
 $\mu $
V/m at the aircraft antenna location. The calculated power of the jamming signal was −66.6 dBm at the aircraft receiver for an aircraft antenna gain of −8 dB representing the combined effect of the jammer’s and the aircraft’s antenna characteristics.
The values of NACp, NIC, SIL and SDA during B
 $737_{zer}$
and B
 $737_{neg}$
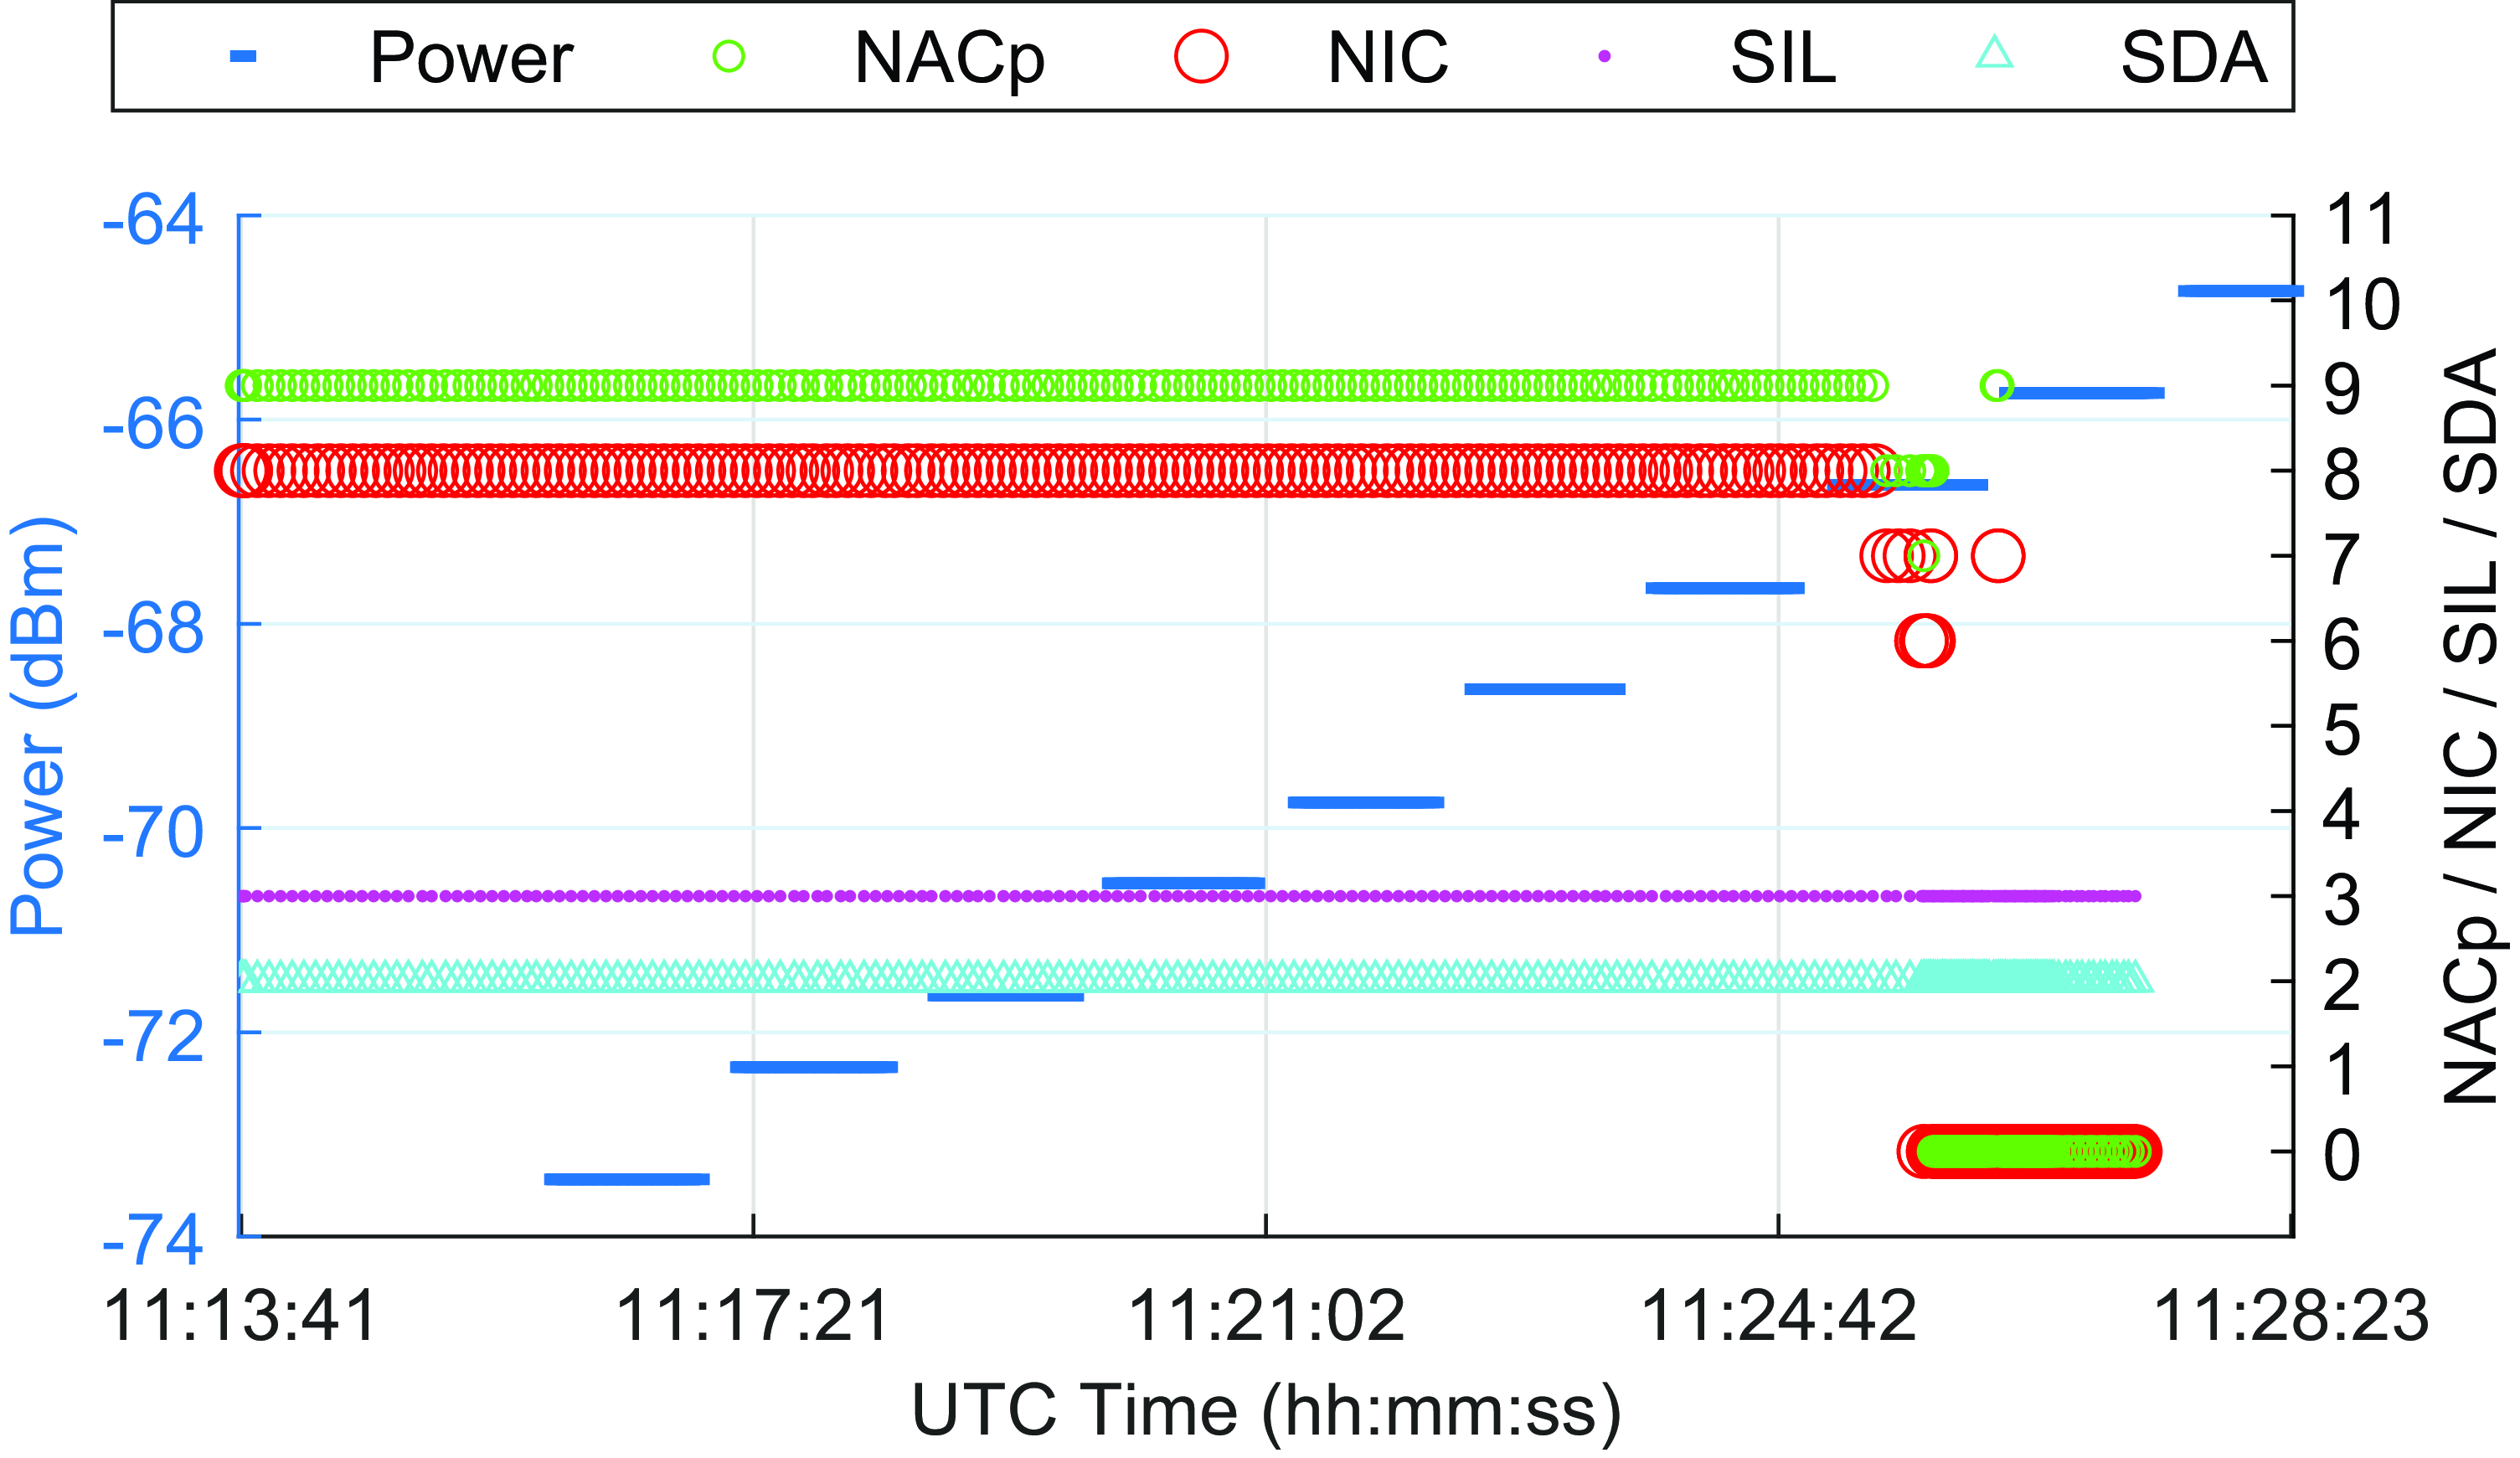
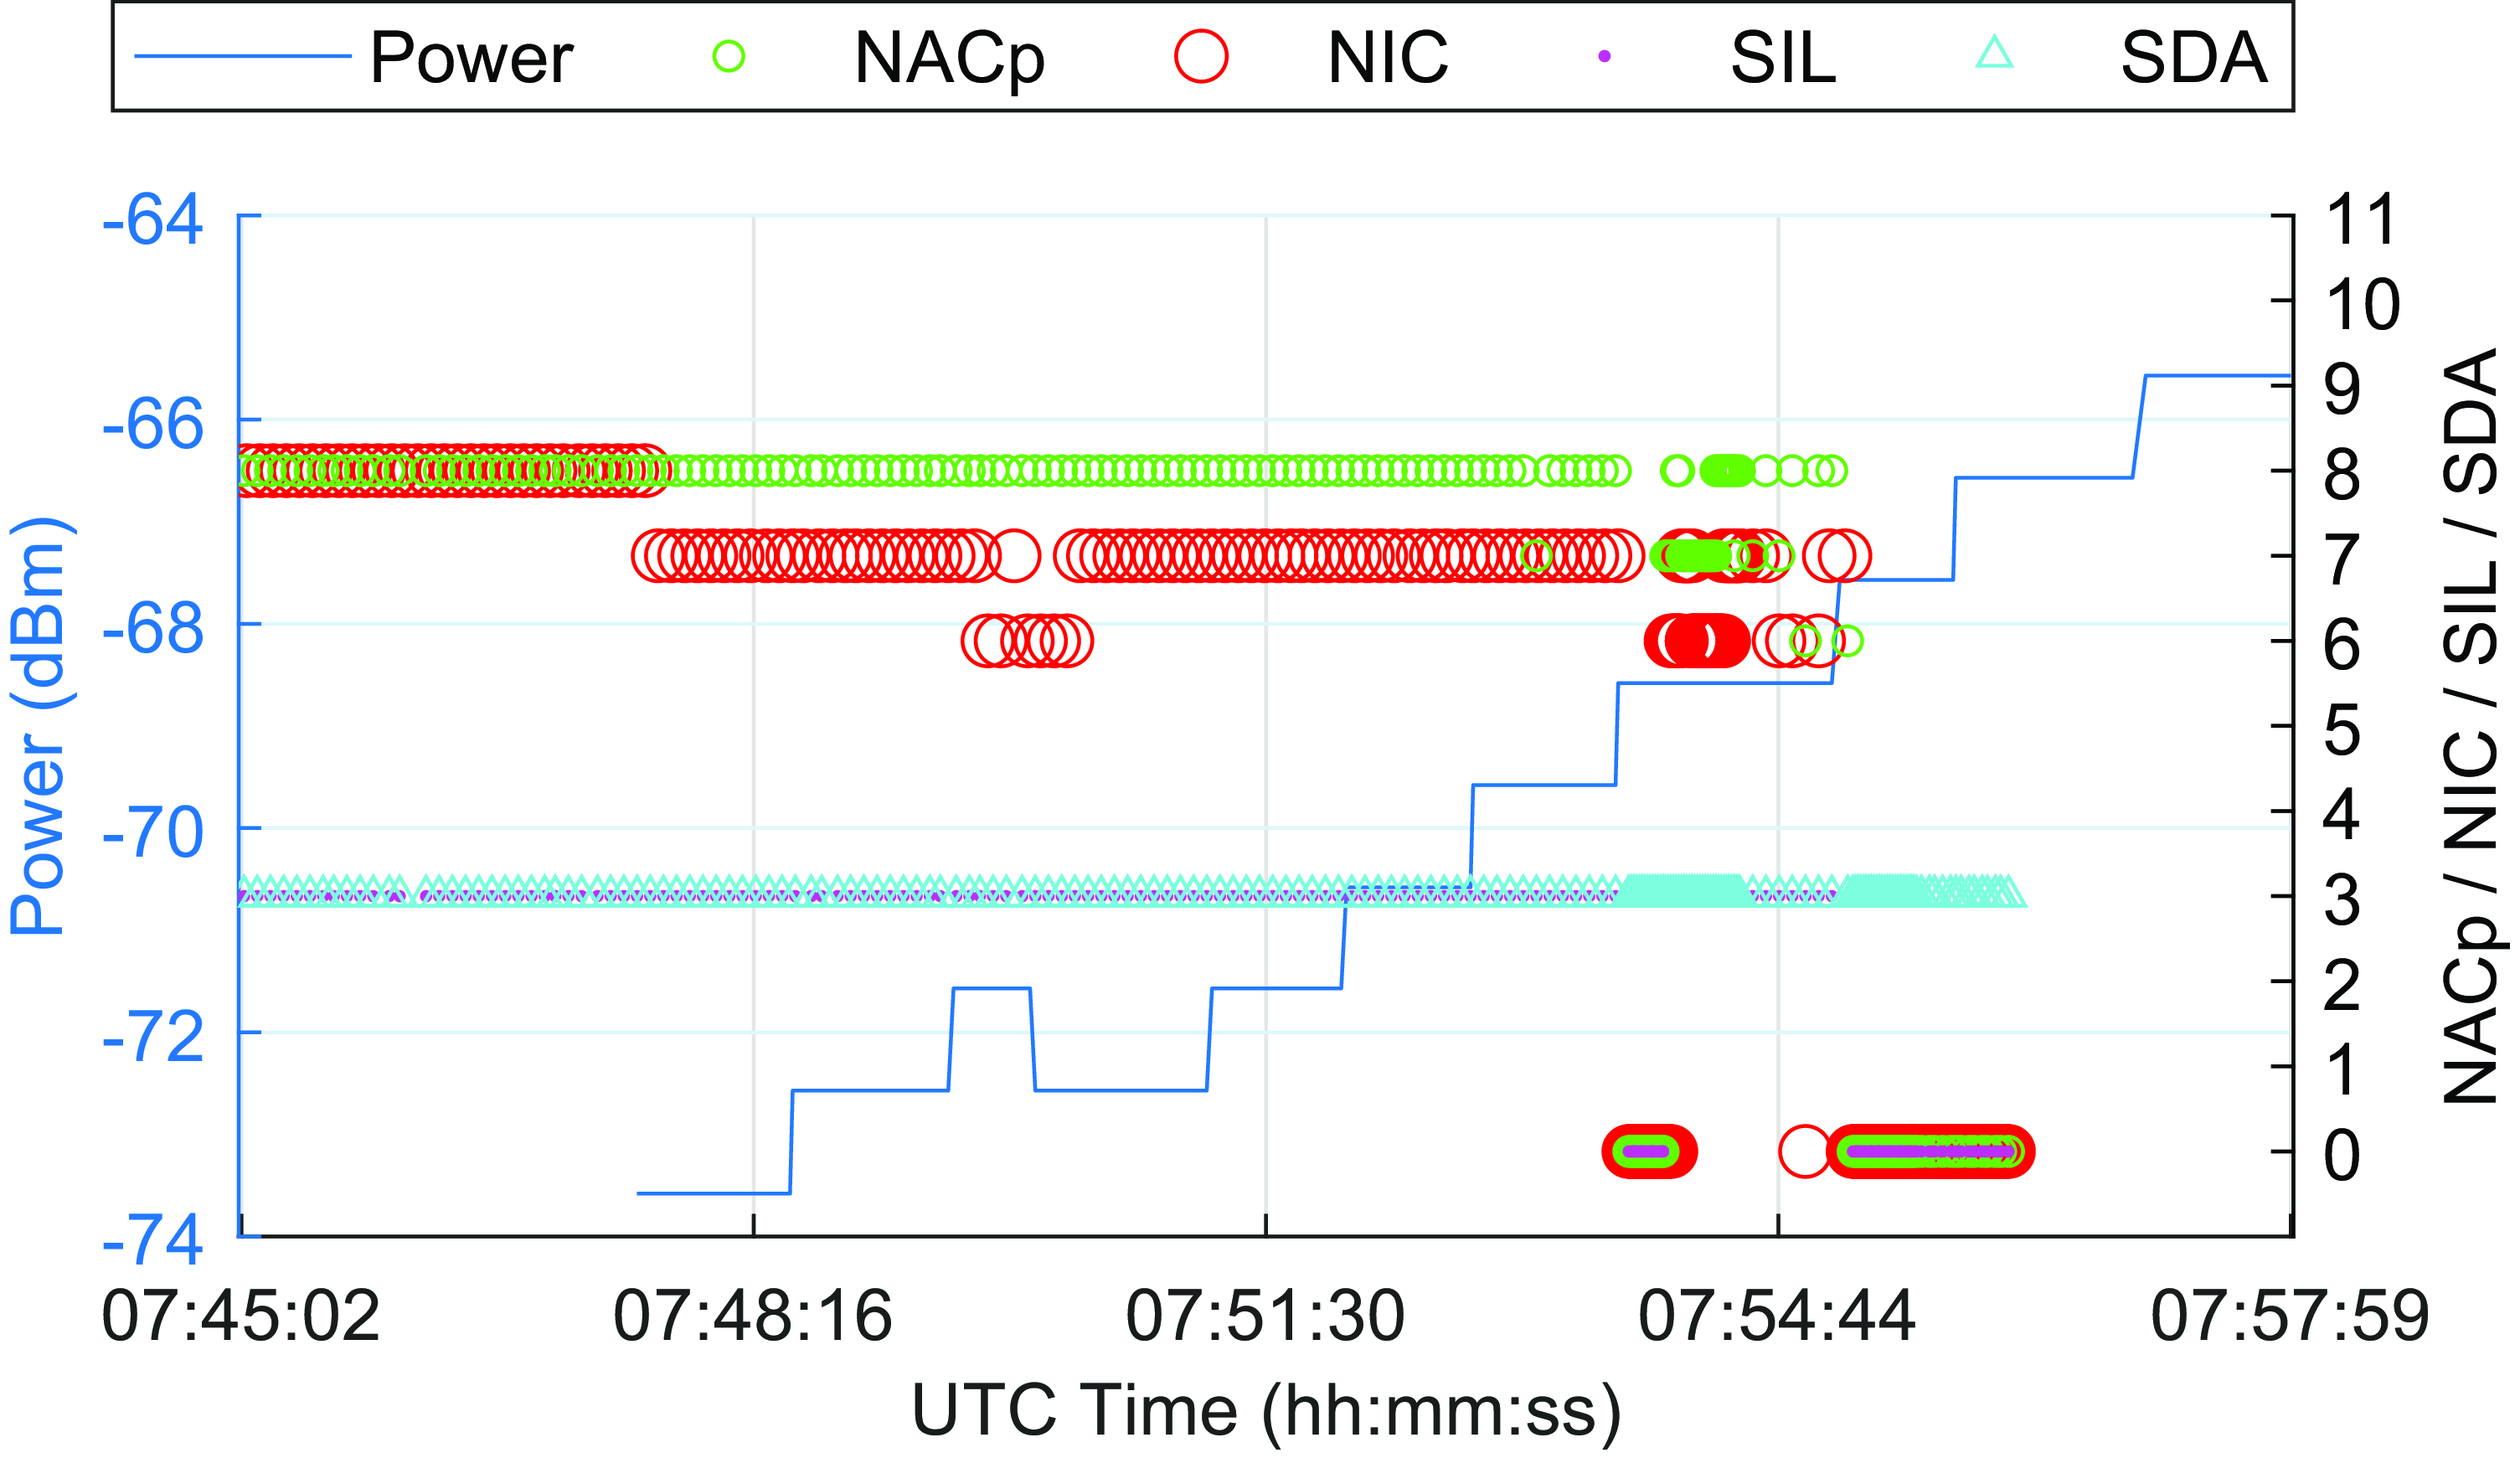
are shown in Figs 1 and 2, respectively. The NACp and NIC indicators remain stable in a normal operation range until jamming power reaches over −69 dBm when a certain fluctuation can be seen which leads to a drop to zero in both indicators. The SIL and SDA parameters remained unchanged throughout the experiment. After a certain time, the ADS-B containing the quality indicators cease transmission completely, resulting in the unavailability of all these parameters.
Values of ADS-B quality indicators during B737 measurement with zero aircraft-jammer elevation.

Values of ADS-B quality indicators during B737 measurement with negative aircraft-jammer elevation.

3.2 Airbus A319 results
In the first measurement with zero elevation jammer-aircraft configuration, further referred to as A
 $319_{zer1}$
, a loss of GPS position occurred at a transmitted EIRP of 0.845 mW or −0.73 dBm. This corresponded to E = 77.6 dB
 $\mu $
V/m at the aircraft antenna location. The calculated power of the jamming signal was −68.6 dBm. During the subsequent reduction of jamming signal power, the GPS position information was restored at an EIRP of 0.267 mW or −5.73 dBm, which corresponded to E = 72.6 dB
 $\mu $
V/m at the aircraft antenna location. The calculated power of the jamming signal was −73.6 dBm.
In the second measurement with zero elevation jammer-aircraft configuration, further referred to as A
 $319_{zer2}$
, a loss of GPS position occurred at a transmitted EIRP of 0.424 mW or −3.73 dBm. This corresponded to E = 74.6 dB
 $\mu $
V/m at the aircraft antenna location. The calculated power of the jamming signal was −69.9 dBm. The re-establishment of GPS position occurred at an EIRP of 0.212 mW or −6.74 dBm, which corresponded to E = 71.6 dB
 $\mu $
V/m at the aircraft antenna location. The calculated power of the interference signal was −74.5 dBm.
In the first measurement with negative elevation jammer-aircraft configuration, further referred to as A
 $319_{neg1}$
, a loss of GPS position occurred at an EIRP of 1.3 mW or 1.14 dBm. This corresponded to E = 79.7 dB
 $\mu $
V/m at the aircraft antenna location. The calculated power of the jamming signal was −69.5 dBm. The reacquisition of position occurred at an EIRP of 0.27 mW or −5.7 dBm which corresponded to E = 72.66 dB
 $\mu $
V/m at the aircraft antenna location. The calculated power of the interfering signal was −76.5 dBm.
In the second measurement with negative elevation jammer-aircraft configuration, further referred to as A
 $319_{neg2}$
, a loss of GPS position occurred at an EIRP of 2.1 mW or −3.3 dBm. This corresponded to E = 81.7 dB
 $\mu $
V/m at the aircraft antenna location. The calculated power of the jamming signal was −67.5 dBm. The reacquisition of GPS position occurred at an EIRP of 0.054 mW or −12.7 dBm which corresponded to E = 65.66 dB
 $\mu $
V/m at the aircraft antenna location. The calculated power of the interfering signal was −83.5 dBm.
In all four measurements, a similar trend in all ADS-B quality indicators can be observed. All indicators from the four A319 measurements are displayed in order in Figs. 3–6. In most cases, during the initial phase of interference, when positional information is still available, the decrease in the value of the NIC indicator precedes the decrease in the NACp and SIL indicators. The fall of the SIL indicator to zero completely copies the decrease of the NACp indicator to zero. After the aircraft loses the ability to provide position information, NIC = 0 continues to be transmitted. After approximately 60 seconds of position unavailability, all quality indicators transmission is terminated also in accordance with ADS-B standards [24, 25].
Evolution of quality indicators values for measurement A
 $319_{{\rm{zer}}1}$
.

Evolution of quality indicators values for measurement A
 $319_{{\rm{zer}}2}$
.

Evolution of quality indicators values for measurement A
 $319_{{\rm{zer}}3}$
.

Evolution of quality indicators values for measurement A
 $319_{{\rm{zer}}4}$
.

3.3 Beechcraft King Air 350 results
In nominal conditions without the presence of GNSS interference, the NACp indicator values ranged between 10 and 11. The NIC indicator remained constant at a value of eight. Parameters SIL and SDA were also constant during the portion of the flight with no jamming with SIL = 3 and SDA = 2.
During the first overflight, further referred to as B
 $305_1$
, the NIC indicator decreases from eight to zero at 07:47:35.59 which corresponds to a jamming signal power level of −65.75 dBm. At 07:47:36.99 NACp and SIL indicators decreased to zero. The delay in comparison to NIC occurred due to a longer repetition period of the ADS-B message containing the NIC indicator. The ADS-B quality indicators when approaching the jammer during the first overflight are displayed in Fig. 7.
Evolution of ADS-B quality indicators for measurement B
 $350_1$
.

During the second overflight, further referred to as B
 $305_2$
, the NACp, NIC, and SIL indicators all decreased to a value of zero at 07:54:21.14 which corresponds to a jamming signal power level of −72.99 dBm. Prior to that, the NACp parameter had already dropped from a level of 10 to 9 at a power level of −73.53 dBm indicating a position error larger than 30 meters, which could be indicative of the interference as such an error should not normally occur when utilising SBAS.
After directly passing over the jammer, a partial regeneration of the NACp parameter to a value of nine was noticed, followed by a drop to zero and subsequent complete regeneration with NACp gradual increase to ten at 7:56:42. The SIL parameter during both overflights returned to a value of three immediately when NACp acquired a value other than zero. The changes in ADS-B quality indicators when approaching the jammer during the second overflight are displayed in Fig. 8.
Evolution of ADS-B quality indicators for measurement B
 $350_2$
.

Right after passing the jammer in B
 $350_1$
, still within the jammer impact area, position information was re-obtained for a short period. This was likely due to the aircraft antenna being shielded from the jamming signal fuselage. This is also reflected in the ADS-B quality indicators, showing a temporary increase in NACp to 10. However, within a few seconds, the NACp indicator dropped again to 0. Only after this sequence, the aircraft receiver regenerated and returned to normal operation. The same phenomenon occurred during B
 $350_2$
as well. The changes in the NACp indicator during both overflights are visualised on a map in Fig. 9.
Flight trajectory with NACp values colour-coding for measurements B
 $350_1$
and B
 $350_2$
(scale 1:65,000).

3.4 Tecnam P2006T results
During the first overflight, further referred to as
 ${\mathrm{P2006T}_1}$
, the calculated power of the jamming signal at the aircraft location, at which the position information was lost, was −75.6 dBm. At this power level, NACp decreased from 10 to 0, NIC decreased from 9 to 0, and SIL decreased from 3 to 0. Values of all quality indicators during
 ${\textrm{P2006T}_1}$
are displayed in Fig. 10. Shortly after entering the jammer impact area, the aircraft’s GPS antenna was partially obstructed by the aircraft’s airframe, resulting in the increase of NACp to eight and SIL returning to three. However, the NIC value remained at zero during the entire overflight.
ADS-B quality indicators values for measurement
 ${\textrm{P2006T}_1}$
.

During the second flight through the jammed area, further referred to as
 ${\textrm{P2006T}_2}$
, the ability to provide position data was lost at a power level of −69.3 dBm. At this moment, the NIC indicator decreased from 8 to 0, SIL decreased from 3 to 0, and NACp decreased from 9 to 0. This most likely indicates that the receiver did not fully regenerate after the previous interference as NACp did not reach ten and NIC did not reach nine which were values preceding the first impact of jamming. Changes in ADS-B quality indicators from
 ${{P2006T}_2}$
are displayed in Fig. 11.
ADS-B quality indicators values for measurement
 ${\textrm{P2006T}_2}$
.

3.5 Aircraft resilience comparison
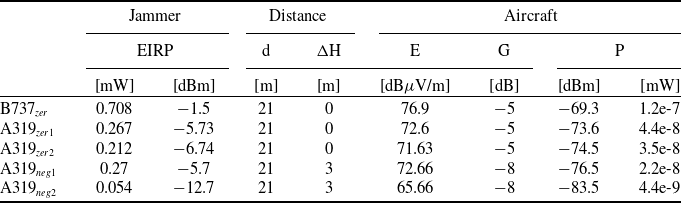
Table 1 summarises and compares the power values at which the tested aircraft GPS receivers lost the GPS L1 signal indicated by the NACp indicator dropping to 0. The mean value of the jamming power is −68.44 dBm, with a standard deviation of 2.61 dBm. Table 1 also includes all the values necessary to compute the jamming signal power at the aircraft antenna.
Measured/calculated values at which the GNSS receiver stopped providing position data in ADS-B messages across all conducted measurements

EIRP – jammer effective isotropic radiated power; d – horizontal and
 ${\rm{\Delta }}$
H – vertical distance between the aircraft antenna and the jammer; E – intensity of the electric field at the aircraft antenna location; G – gain of the aircraft antenna in the direction of the jammer; P – power of the jamming signal
The re-acquisition of the previously lost GPS L1 signal does not occur immediately upon reaching the power at which re-acquisition is possible. There is a time delay involved in the receiver regeneration. Thus, when the aircraft is airborne, it is not possible to exactly determine the interference signal power that prevents the receiver from re-acquiring the GPS L1 signal. Therefore, only the results from stationary measurements are included in Table 2 which displays values at which the GNSS receiver was able to re-acquisition the GPS signal, re-establish position in ADS-B data, and ADS-B quality parameters returned to nominal values. The mean value of the jamming power sufficient to prevent the GPS L1 signal acquisition is −75.48 dBm, with a standard deviation of 4.95 dBm.
Measured/calculated values at which the GNSS receiver was able to re-establish the provision of positional data

EIRP – jammer effective isotropic radiated power; d – horizontal and
 ${\rm{\Delta }}$
H – vertical distance between the aircraft antenna and the jammer; E – intensity of the electric field at the aircraft antenna location; G – gain of the aircraft antenna in the direction of the jammer; P – power of the jamming
3.6 Logistic regression model outcomes
Using the methodology described in Section 2.5, a logistic distribution displayed in Fig. 12 was obtained. The distribution has the following parameters: mean value
 $\mu $
= −70.10 dBm, standard deviation
 $\sigma $
= 3.14 dBm, corresponds to the scale parameter s = 1.88. Given this logistic distribution, the jamming signal power level corresponding to the 95% probability that the receiver is jammed is −64.55 dBm. Analogously, the jamming power level at which there will be a 95% probability that the receiver will not be jammed in other words 5% probability the receiver is jammed corresponds to −75.63 dBm.
The classification matrix (sometimes called confusion matrix) was used for the assessment of the goodness-of-fit for the logistic regression model. A 50% cut-off point on the probability scale was used to classify all values. The logistic model with above-specified parameters has accuracy = 0.84, sensitivity = 0.75, and specificity = 0.88.
3.7 Aircraft critical jamming to signal ratio and jamming impact area
Based on the presented experimental measurements, the value of
 ${(J/S)_c}$
signifying when the loss of an already acquired GPS L1 signal occurs, was calculated to be 55 dB at the aircraft GNSS antenna location. The
 ${(J/S)_c}$
= 55 dB value was derived from the mean critical value of the jamming signal power level
 ${J_c}$
= −70.10 dBm in the logistic regression model and based on the assumption that the average power level of the GPS L1 signal at the Earth’s surface is −125 dBm. The −125 dBm value was chosen as the midpoint of the power range according to ICAO Annex 10 document (2018) after subtracting the 3dB aircraft antenna gain. The result of
 ${(J/S)_c}$
= 55 dB must be understood in the context of the jamming signal type used in the measurements. Both GNSS jammers used in the presented measurements transmit chirp-type jamming signal which is the most common type of jamming signal used in commercial off-the-shelf jammers. The
 ${(J/S)_c}$
for other types of jamming signals like the white noise of sawtooth may slightly differ.
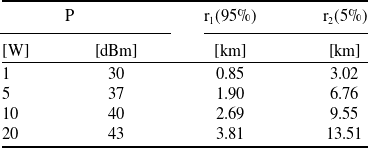
Table 3 and Fig. 13 illustrate the size of the GNSS interference impact area in relation to the jammer output power. The radiuses
 ${\textrm{r}_1}$
and
 ${\textrm{r}_2}$
of the impact areas in Table 3 were calculated for
 ${J_c}$
values of −64.55 dBm and −75.63 dBm. These
 ${J_c}$
values were derived from the logistic regression representing the 95% and 5% probability of position information degradation based on ADS-B quality indicators. The values in Table 3 and Fig. 13 do not account for any antenna gains on the transmitting or receiving side, nor do they include losses in the cabling.
Jamming impact area radiuses for 95% and 5% position information degradation probabilities in relation to different jammer output

Probability of GNSS position loss as a function of jamming signal power based on logistic distribution.

Dependence of received jamming signal power on distance for 1 W, 5 W, 10 W and 20 W GNSS jammers. The two dashed lines represent the boundaries of 95% and 5% probability of GNSS position information being impacted by jamming.

4.0 Discussion
Regarding ADS-B quality indicators in the ground measurements with a very slowly increasing jamming power level, we see a gradual degradation of the NACp and NIC parameters. The lowest recorded value for both was six after which both dropped to zero. In the flight measurements on the other hand the increase in jamming signal power level is much faster given the cruising speed of an aircraft, resulting in a rapid drop in quality indicators from normal operational levels straight to zero. The SIL indicator follows the NACp indicator in the sense that NACp drops to zero SIL also goes to zero. SDA did not drop in any experiments regardless of setup or aircraft model.
When comparing the intensity of the electric field at the aircraft antenna location necessary to deny tracking of the GNSS signal, devoted as E in Table 1 we see a significant increase in ground measurement where the jammer is in negative elevation in comparison to the zero elevation configurations. Two factors contribute to this, the first being the lower aircraft GPS antenna gain the negative elevations. The second is due to the aircraft’s airframe shielding the GPS antenna. Additionally, when we compare the two overflights of each measurement we see big differences around 7 to 8 dBm in the jamming signal power necessary to deny GPS position. The explanation behind this inconsistency is not understood at the moment.
Moving on to a comparison with a previous GNSS jamming vulnerability study conducted on Airbus A320 [Reference Osechas, Fohlmeister, Dautermann and Felux17]. Results of the Osechas et al. [Reference Osechas, Fohlmeister, Dautermann and Felux17] paper state that the jamming signal power must be at least 30 dB over the noise floor upon reception at the aircraft to impact the aircraft’s GPS receiver. Given the noise floor at GPS L1 frequency considering two MHz bandwidth is around −110 dBm [28] that leads to −80 dBm of necessary jamming power to impact the receiver. Although, they say at least. In the presented results, there were exactly two instances of jamming impact at slightly over −80 dBm which were found statistically irrelevant. Differing from the Osechas et al. [Reference Osechas, Fohlmeister, Dautermann and Felux17] paper, the potential for jamming impact equivalent to a 5% probability of position information unavailability was observed at a higher jamming power level of around −75 dBm.
Additional result comparison may be done with the Truffer et al. [Reference Truffer, Scaramuzza, Troller and Bertschi18] study. When compared with the impact of similar jamming signal type from (confusion paper), which measured that continuous wave (CW) jamming must be 60 dB over received GPS signal to impact signal reception. This result was obtained in laboratory conditions. When we consider −125 dBm as the midpoint of the GPS L1 power range (with 3 dBi antenna gain included) according to the ICAO document [21] to be the GPS signal at power Earth’s surface that leads to about −75 dBm jamming power level necessary for impact. This result is comparable to the presented result of −75.63 dBm indicative of a 5% GPS outage probability.
The results presented provide a quantitative and valuable insight into the aircraft vulnerability to GNSS jamming. Thanks to the expensive testing campaign involving both of the two biggest commercial aircraft manufacturers as well as representatives of general aviation aircraft the results are a valid generalisation of aircraft resilience to GNSS jamming. Taking into account the computed mean
 ${(J/S)_c}$
value of −70.10 dBm derived from the logistic regression model we may see that even a moderately powerful jammer with an output power around 1W has a potential impact on aircraft receivers up to three kilometres afar.
5.0 Conclusion
The presented results describe the vulnerability of aircraft GPS receivers to jamming signals. Specifically, the jamming power level required to lose an already acquired GPS L1 signal, and the power sufficient to prevent the re-acquisition of the GPS L1 signal were investigated. A statistical description as well as logistic distribution of the dependency between GNSS position outage and the jamming signal power were provided. The impact of jamming on position quality indicators (NIC, NACp, SIL and SDA) transmitted in ADS-B messages was also examined in all impact phases, meaning when the receiver enters the jammed area, experiences complete GPS loss and then recovers.
The mean value of the jamming signal power necessary to prevent GPS signal tracking in aircraft receivers obtained from the logistic regression model was −70.10 dBm, with a variance of 9.86 dBm. To recover/re-acquisition the GPS L1 signal, a jamming signal power has to go under −75.48 dBm on average. Test measurements also showed that the position of the aircraft relative to the jammer is crucial, specifically in terms of the antenna placement on the aircraft and its directional characteristics. In some configurations, the aircraft’s fuselage can completely shield the aircraft’s GNSS antenna from the jamming signal.
The study was limited to one type of jamming signal. In the future, a comparison with jamming signal types other than the chirp sawtooth signal may be carried out and compared. Though the testing campaign was extensive in scope flight measurements with commercial aircraft and ground measurements with general aviation aircraft were not included for organisational and timely reasons. Such a complementary study would enhance the results by jamming power levels denying GNSS signal re-acquisition for general aviation aircraft. Furthermore, jamming from multiple directions may also be included in future research to analyse the effect of antenna polarisation.
The presented results provide valuable insight into the dependency of ADS-B quality indicators on specific values of GNSS jamming signal power. Thus, bringing a necessary quantification for further development and improvements in the performance of interference localisation algorithms based on ADS-B. Such algorithms may even be combined with other interference detection technologies such as professional detectors or IoT devices to create a denser network of sensors and overall better GNSS interference detection capabilities. Furthermore, knowing the exact
 ${(J/S)_c}$
value for aircraft receivers will improve defining the size of impact areas surrounding conflict zones or military training grounds which should be avoided by air traffic operations.
Acknowledgements
This work was supported by the Technology Agency of the Czech Republic, grant No. CK01000183 Research of the GNSS signal interference in the domain of air transport.
Competing interests
The authors declare none.