Clay and marly soils have the potential to exhibit undesirable geotechnical properties, such as swelling and high water sensitivity (Holtz & Gibbs, Reference Holtz and Gibbs1956; Seed et al., Reference Seed, Woodward and Lundgren1962; Diamond & Kinter, Reference Diamond and Kinter1965; Eades & Grim, Reference Eades and Grim1966; Sakr et al., Reference Sakr, Shahin and Metwally2009). The main factor triggering such swelling is the nature of the clay fraction. In particular, a high smectite content with the presence of water induces soil swelling. Swelling soils exist in many regions in Algeria, particularly in the Batna region (N’Gaous, Boumagueur) and Oum El-Bouaghi (Ain El Beida), leading to difficulties during building construction and the construction of major pieces of infrastructure, such as railways and motorways. Previous studies have shown that treatment with lime and hydraulic binders improves the geotechnical properties of many soils (e.g. Ashraf & Walker, Reference Ashraf and Walker1963; Le Runigo et al., Reference Le Runigo, Cuisinier, Cui, Ferber and Deneele2009; Al-Mukhtar et al., Reference Al-Mukhtar, Khattab and Alcover2012; Zhao et al., Reference Zhao, Gao, Zhang and Wang2016; Etim et al., Reference Etim, Eberemu and Osinubi2017, etc.), making them suitable for construction applications in civil engineering works. Lime causes particle flocculation, which is mainly responsible for improving the engineering properties of soil (reducing its plasticity and swelling), and it also leads to pozzolanic reactions by forming cementitious compounds such as calcium silicate hydrates (CSHs), calcium aluminate hydrates (CAHs) and calcium aluminosilicate hydrates (CASHs), which provide low plasticity and low swelling potential to these soils. The evolution of pozzolanic activity strongly depends on the mineralogy of the <2 μm clay fraction (Deneele et al., Reference Deneele, Le Runigo, Cui, Cuisinier and Ferber2016; Vitale et al., Reference Vitale, Deneele, Russo and Ouvrard2016a, Reference Vitale, Russo and Deneele2016b, Reference Etim, Eberemu and Osinubi2017; Maubec et al., Reference Maubec, Deneele and Ouvrard2017). The dissolution of clay minerals and formation of pozzolanic materials yields the main cementing agents CSHs, CAHs and CASHs, which are responsible for solidification and give high mechanical resistance to the treated soils (Bell, Reference Bell1996). Clay minerals show different dissolution rates in alkaline environments depending on their layer charge, structure and chemical composition (Elert et al., Reference Elert, Azañón and Nieto2018). Previous studies have focused on the reaction of clay minerals with lime (Bauer & Berger, Reference Bauer and Berger1998; Rozalen et al., Reference Rozalen, Huertas, Brady, Cama, Garcia-Palma and Linares2008). Maubec et al. (Reference Maubec, Deneele and Ouvrard2017) studied the effects of lime on two different clays: kaolin and bentonite. They showed that improvements are achieved more rapidly with Ca2+ bentonite; the performance achieved for kaolinite was greater, but required a longer period of time. Vitale et al. (Reference Vitale, Deneele, Paris and Russo2017) have shown that flocculation due to cation-exchange reactions controls the microstructural characteristics of kaolin and the low reactivity of kaolinite-type clay minerals to pozzolanic reactions. Regarding lime-treated bentonite, the physicochemical evolution depends on the combined effect of cation-exchange reactions and pozzolanic reactions that develop on a comparable timescale (Vitale et al., Reference Vitale, Deneele, Paris and Russo2017).
Few studies have been carried out on the influence of Ca-rich solutions on the mineralogy of clays. Vitale et al. (Reference Vitale, Deneele, Russo and Ouvrard2016a) studied the influence of porewater chemistry on the short-term behaviour of a kaolin treated with lime, and they showed that lime increased the average aggregate size of soil particles over the short term. Chemeda et al. (Reference Chemeda, Deneele and Ouvrard2018) looked at the interface chemistry of a lime solution and kaolinite over the short term and its effect on pozzolanic activity over the long term. The adsorption of Ca increased with increases to its initial concentration, and the higher the adsorbed Ca amount, the lower the measured Si and Al concentrations. This showed that the low reactivity of kaolinite clay is compatible with the consumption of portlandite and the formation of new hydrated phases (Chemeda et al., Reference Chemeda, Deneele, Christidis and Ouvrard2015; Vitale et al. Reference Vitale, Deneele, Paris and Russo2017). Chemeda et al. (Reference Chemeda, Deneele, Christidis and Ouvrard2015) showed that Ca ions at higher pH (CaOH+) mainly favour the establishment of face-to-face contact between kaolinite particles, which is effective for forming tight flocs with lower deformation. These flocs behave like individual coarse-grained materials. Thus, their reactivity with water should be reduced during exposure to humidity, which in turn reduces the swelling–shrinkage potential and improves their workability. In addition, Bauer & Berger (Reference Bauer and Berger1998) reported that in an alkaline solution, the dissolution of kaolinite was greater than that of montmorillonite. According to Maubec et al. (Reference Maubec, Deneele and Ouvrard2017), this contradiction can be explained by positing the existence of another mechanism that occurs in parallel with kaolinite dissolution.
The stabilization and improvement of clay soils have been widely studied by several researchers (e.g. Diamond & Kinter, Reference Diamond and Kinter1965; Eades & Grim, Reference Eades and Grim1966; Bell, Reference Bell1996, Hatim & Mostafa, Reference Hatim and Mostafa2017, Amri et al., Reference Amri, Akchiche, Bennabi and Hamzaoui2019, etc.). However, the chemo-mineralogical mechanisms of these processes, in particular the effect of the treatment on clay minerals (smectite, illite, kaolinite, muscovite, etc.), are not yet fully understood. In this experimental work, we study the influence of a solution rich in Ca on the mineralogy of the clay and non-clay fractions as well as on the swelling of marly soils of Miocene age, which outcrop in the N’Gaous, Boumagueur and Ain el Beida regions. These marly soil layers poses engineering problems during the construction of civil engineering works. The study also considers the chemo-mineralogical evolution of the treated samples, and it focuses on the relationships between the mineralogical evolution and the macroscopic behaviour (swelling) of the studied soils.
Materials and methods
Soil used and admixtures
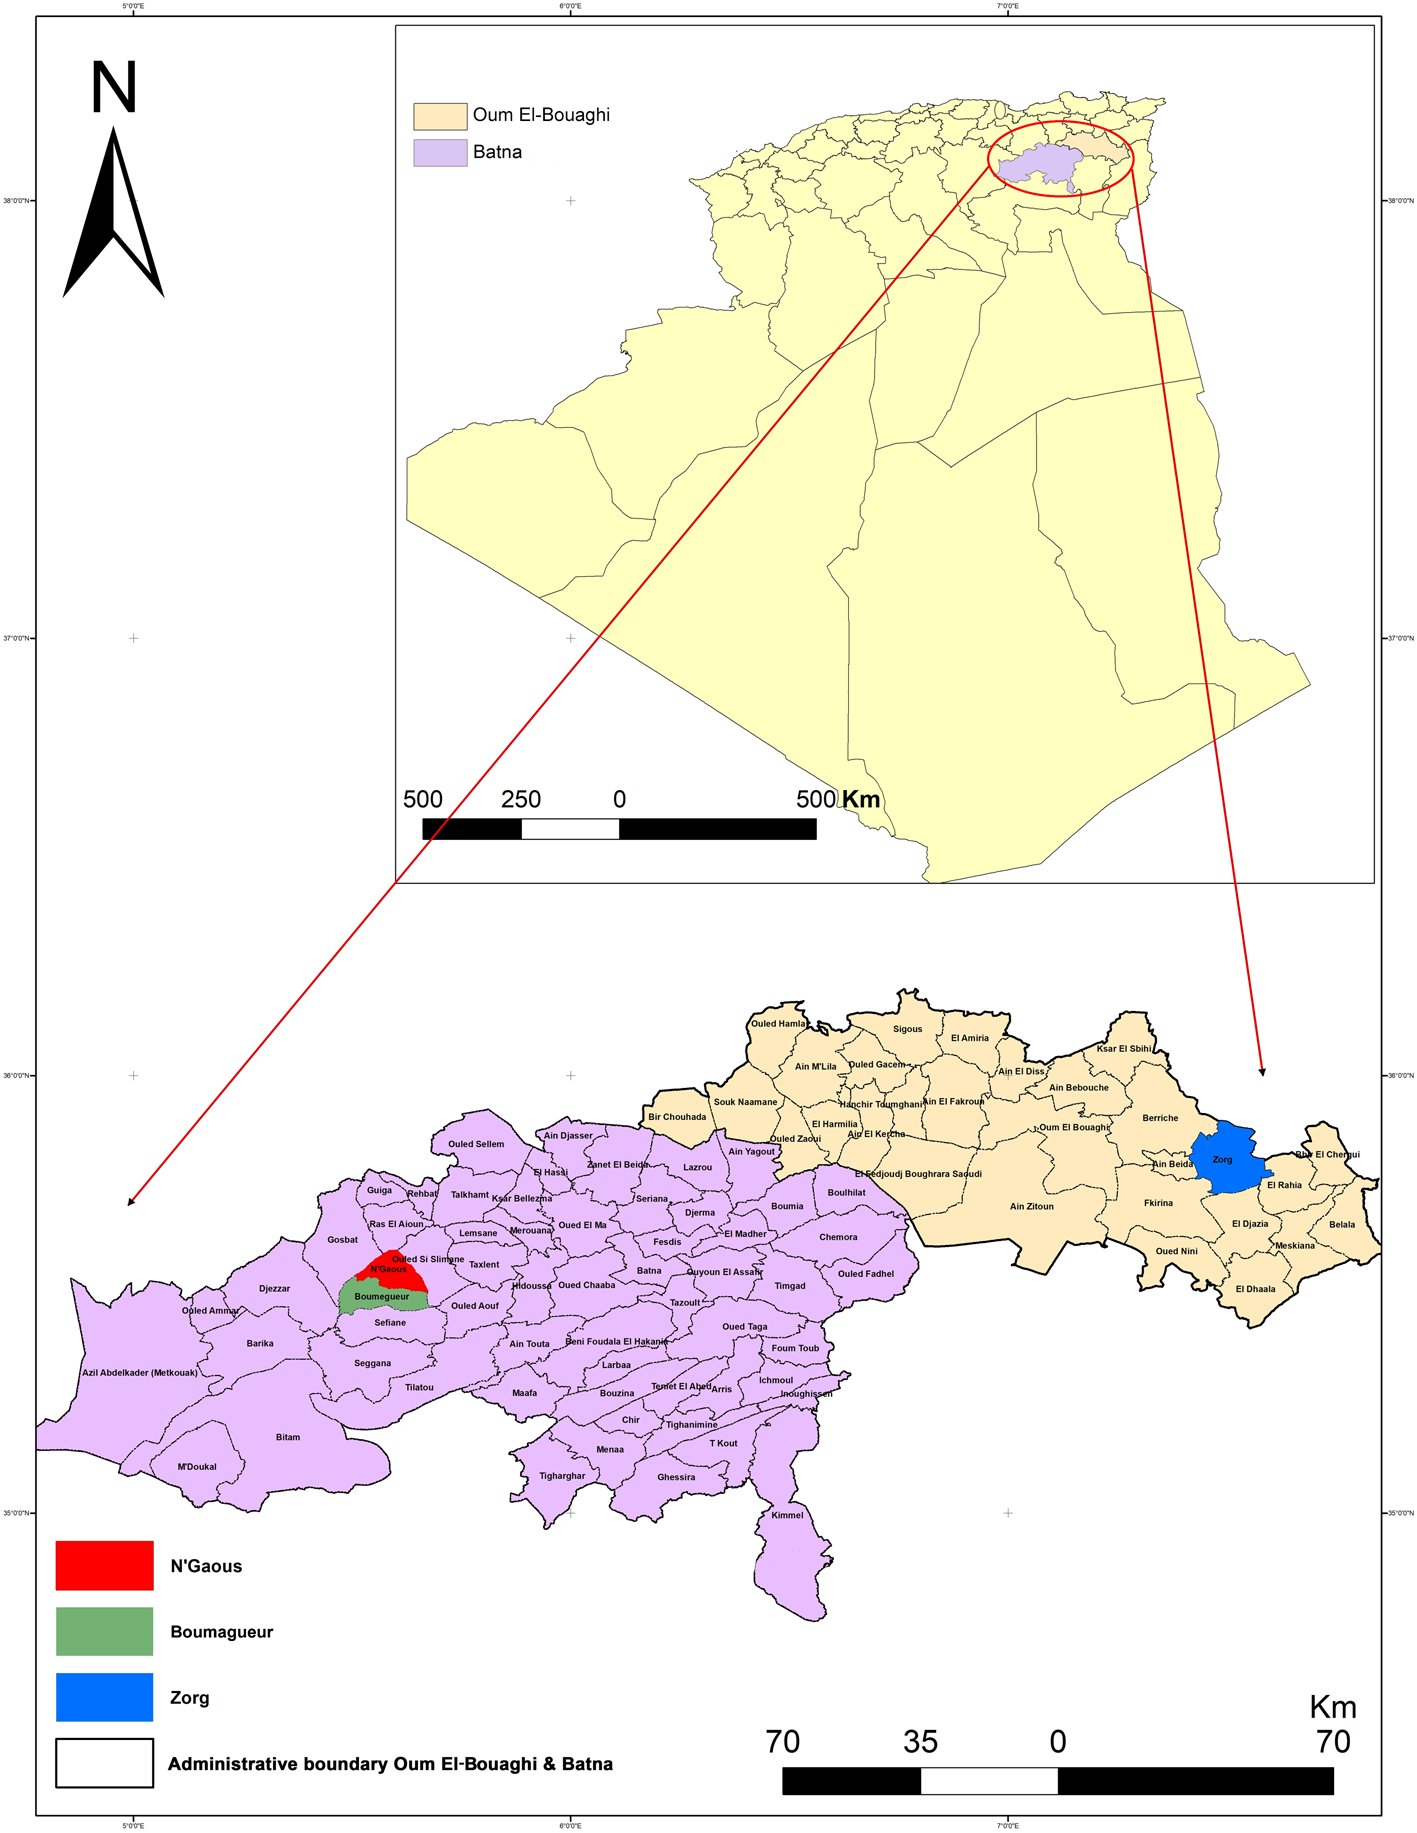
The soil used in this study is a Miocene green marl collected from three different localities in Algeria, in particular in the regions of N’Gaous, Boumagueur (Wilaya of Batna) and Zorg (Wilaya of Oum El-Bouaghi). The region of N’Gaous is a commune of the Wilaya of Batna (Algeria), located 92 km south-west of the capital of the Wilaya of Batna. Boumagueur is located 5 km south of the Daïra of N’Gaous and 85 km west of the Wilaya of Batna. The commune of Zorg is part of the high plains of Constantine, located 47 km north-east of the Wilaya of Oum El-Bouaghi (Fig. 1). The presence of the Miocene green marl makes these areas sensitive to swelling phenomena and creates difficulties during the construction of civil engineering structures.
Geographical location of the sampled soil area.

Sample preparation
The soil was dried at 50°C, then ground and sieved through a 2 mm sieve. Marl soil and the adjuvant (Ca solution prepared by mixing slaked lime with distilled water) were mixed and homogenized for 10 min. The percentages of the Ca solution used in the mixtures were 0%, 2%, 3%, 5%, 7% and 9% for the three samples. The mixture was statically compacted with a California Bearing Ratio (CBR) press at a slow speed (2 mm min–1) in rigid steel rings (70 mm diameter and 19 mm height). The samples were then immediately wrapped in both cellophane and aluminium paper, and then they were coated with paraffin wax to reduce the loss of humidity before being stored at 20°C for 28 days.
In the case of the treated soils, a quantity of the admixture corresponding to the dosage in question was added to the soil. This quantity was calculated using Equation 1:
 \begin{align}{\text{Admixture \% }} = \frac{{{\text{Mass of admixture}}}}{{{\text{Mass of admixture }} + {\text{ Mass of dry soil}}}}\end{align}
Geotechnical analysis
Physical tests
A set of laboratory tests were conducted to define the physical properties of the soil. These tests include a test of volumetric mass (apparent density). The samples were subjected to the water immersion method to determine their volumetric mass, in accordance with French standard NF P 94-053. The density ρ is calculated by dividing the mass (m) of the sample by its volume (V). In order to be waxed with paraffin, the sample to be tested must have a simple shape. After cutting the sample, it is weighed (m), then waxed immediately, weighed (mp) in the open air, placed in a basket suspended from a balance support and immersed to be weighed (mp’) with a hydrostatic balance. The three weights make it possible to determine the density according to Equation 2:
 \begin{align} \unicode{x03C1} = \frac{m}{V}\end{align}
where V = (mp – mp’) × ρp/ρw – (mp – m), for which ρw is volumetric mass of water and ρp is the volumetric mass of paraffin.
The granulometric analysis was conducted after removing grains >80 μm by sieving using a sedimentation test for particles <80 μm (NF P 94-056 and NF P 94-057). Particles <80 μm were dispersed in sodium hexametaphosphate and stirred to achieve homogenization of the sample. The sedimentation rate of particles varies according to their size, and Stokes’ Law was used to determine particle size. The dimensional distribution curve of soil elements often allows the geological characterization of the soil and offers a first approach to determining its geotechnical properties, particularly via understanding the relative importance of the clay phase.
The Atterberg limits were determined according to the NF P 94-051 standard. The plasticity index was determined in different states of consistency, being a function of the quantity of interstitial water and of the adsorbed water. The Atterberg limits, namely the liquid limit (WL) and the plastic limit (WP), were determined according to the Casagrande (Reference Casagrande1947) method.
The Methylene Blue value (VBS) was determined according to the NF P 94-068 standard. The VBS represents the quantity of Methylene Blue necessary to saturate a suspension of water, or the quantity of Methylene Blue that can be adsorbed on soil particles. As clay particles have a greater capacity to adsorb Methylene Blue compared to coarse particles such as sands, this test provides an overall estimate of the quantity and activity of the clays contained in the soil. The VBS is expressed in grams of Methylene Blue per kilogram of dry soil.
Free-swelling and expansion pressure tests
Swelling pressure was determined via the free-swelling method using an oedometer cell. The sample was assembled in the oedometer cell and then progressed to the imbibition process under stress corresponding to the weight of the piston, varying between 0.7 and 6.3 kPa. The vertical deformation of the sample was measured. The maximum deformation related to the initial height corresponds to the swelling potential. Once sample expansion was stabilized, the loading was carried out gradually, step by step, according to a chosen loading rate. The swelling pressure corresponds to the load that needs to be applied to return the sample to its initial height.
Mineralogical, chemical and microstructural analyses
The mineralogical composition of the total sediment (disorientated powder) and the composition of the clay fraction (<2 μm) were analysed by X-ray diffraction (XRD) with a Bruker D8 Advance diffractometer (Department of Geology, AGE, University of Liège, Belgium) operating at 40 kV and 25 mA using Cu-Kα1 radiation (λ = 1.5406 Å). Random powders were prepared by drying the samples at 40°C, manually grinding them in a mortar and then sieving them to 250 μm, before placing them on a polyvinyl chloride (PVC) sample holder and then lightly compacting them. The supports were closed so as to avoid preferential orientation of the mineral grains. The powders were X-rayed in the range 2–45°2θ for the determination of the bulk mineralogical composition.
The orientated mounts were prepared by direct deposition of a diluted suspension of <2 µm particles on a ground glass slide, followed by drying in the open air. The clay suspension prepared for XRD had been previously decalcified, and the <2 μm clay fraction was extracted after decantation based on gravitational sedimentation according to Stokes’ Law (Moore & Reynolds, Reference Moore and Reynolds1989). The clay minerals were identified from three preparations: open-air drying (natural state), solvated with ethylene glycol (EG) for 24 h (highlighting the swelling of clays) and heating at 500°C for 4 h (H; highlighting the destruction of kaolinite). Qualitative identification was carried out according to the basal space (Brown & Brindley, Reference Brown, Brindley, Brindley and Brown1980) and to the intensity values of the main reflections between the three XRD traces characteristic of each mineral. Semi-quantitative estimates were based on the measurement of the intensity of characteristic peaks on the XRD traces using the correction factors of Cook et al. (Reference Cook, Johnson, Matti, Zemmels and $1975) and Boski et al. (Reference Boski, Pessoa, Pedro, Thorez, Dias and Hall1998) for random powders and those of Fagel et al. (Reference Fagel, Thamó-Bózsó and Heim2007) for clay minerals.
Differential thermal and thermogravimetric analysis (DTA-TG) was performed on the samples using a DTA-TG device (TGA 2000, Department of Geology, AGE, University of Liège, Belgium). The surface state modifications and fabric changes of soil particles were examined using scanning electron microscopy (SEM) with a JEOL JSM-U3 scanning electron microscope with a secondary electron detector.
The chemical composition of samples was determined by X-ray fluorescence (XRF) spectroscopy with a Panalytical PW4600 (Axios FAST) apparatus. The loss on ignition (LOI) was determined by heating the samples to 1000°C for 2 h.
Results and discussion
Mineralogical, physicochemical and geotechnical characteristics of the natural samples
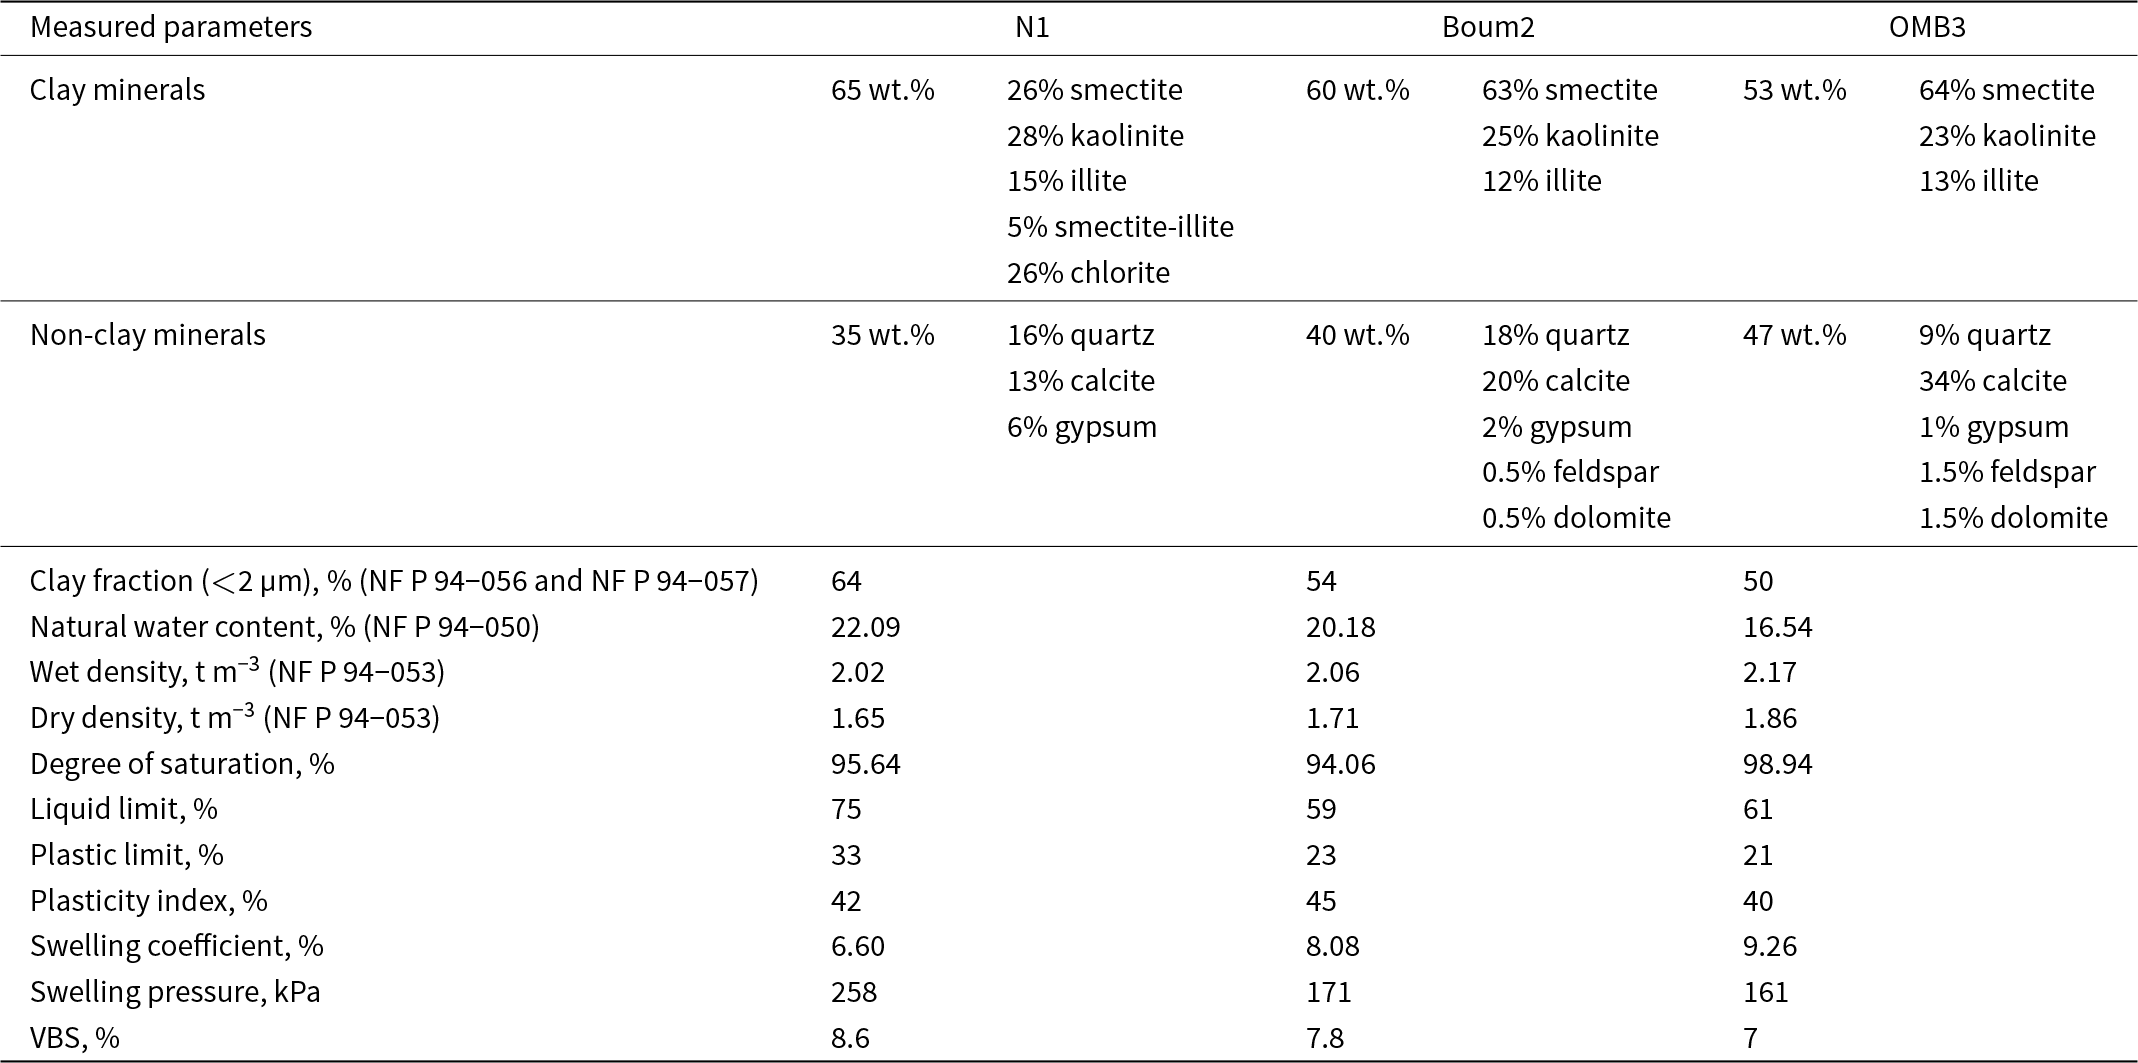
The soils from the N’Gaous area (N1), Boumagueur (Boum2) and Oum El-Bouaghi (OMB3) have comparable mineralogical compositions, consisting of quartz, feldspars, calcite, dolomite and gypsum, identified from the principal reflections at 3.33, 3.20, 3.03, 2.89 and 7.50 Å, respectively, and phyllosilicates detected by the lines at ∼4.6 Å. Phyllosilicates include smectite and kaolinite, with minor illite (Table 1). Illite was identified from the diffraction lines at 10, 5 and 0.34 Å, which remained unaffected after EG solvation and heating at 550°C. Kaolinite could be distinguished by the basal (001) and (002) reflections at 7.15 and 3.50 Å in the natural state, which were not modified by EG treatment but disappeared after heating at 550°C (dehydroxylation of kaolinite). The smectitic component could be identified by the migration of the (001) reflection from 12.5–15.0 to 17.0 Å after EG solvation, which shifted to 10 Å after heating to 550°C due to the release of interlayer water. Chlorite could be identified by the reflection at 14 Å in the natural and/or EG diffractogram. The intensity of the 14 Å reflection increased or decreased upon heating, depending on the degree of degradation.
Mineralogical and geotechnical characteristics of the three samples.

Boum2 = Boumagueur; N1 = N’Gaous area; OMB3 = Oum El-Bouaghi.
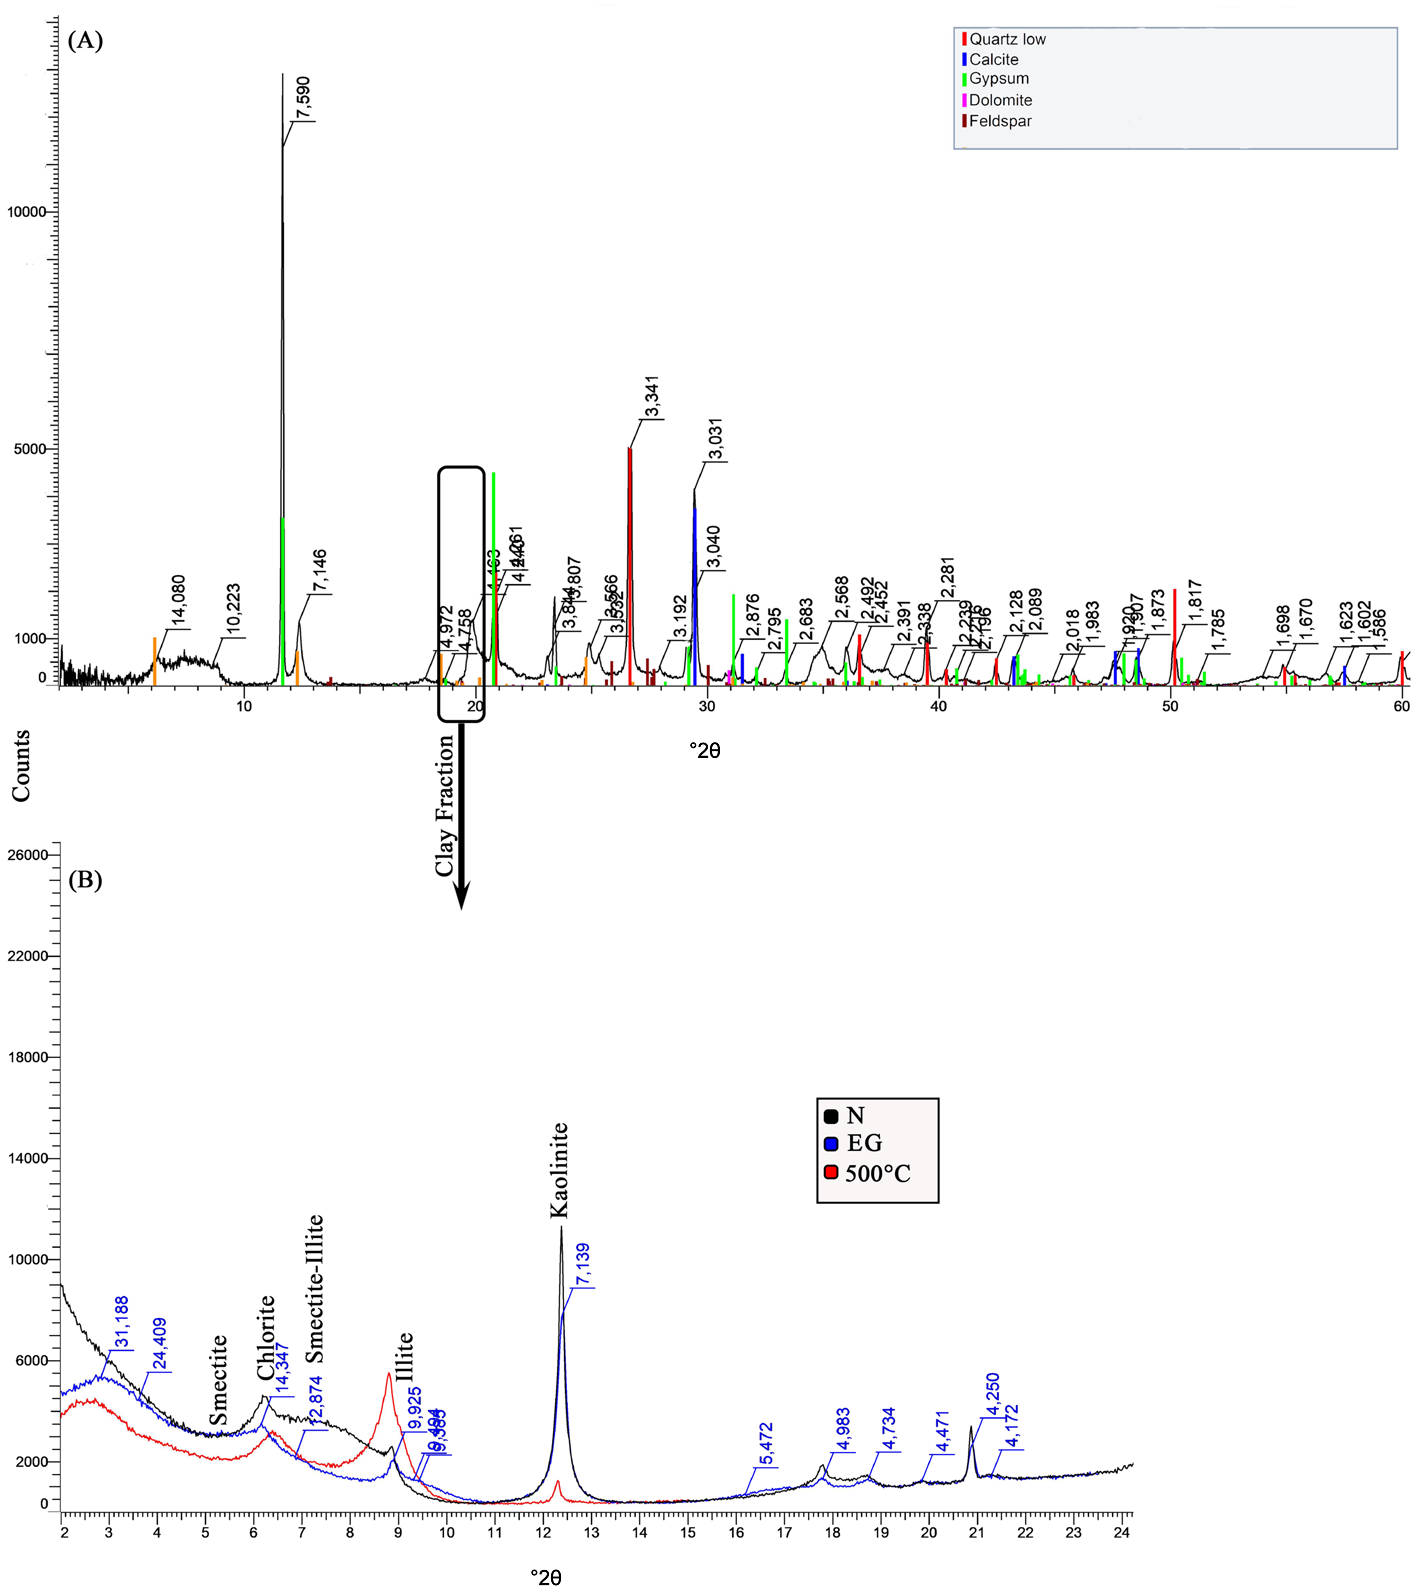
Figure 2 illustrates the XRD traces of the <2 μm fraction of the untreated sample (N1). The 7.1 Å reflection disappeared after heating to 500°C, confirming the presence of kaolinite. The 10 Å peak, which was not affected by the treatments, can be attributed to illite. The 001 reflection at 14 Å can be attributed to chlorite and remained stable after EG solvation and heating at 500°C. The reflection at 12.8 Å can be attributed to an interstratification (smectite-illite), and the reflection at 16 Å can be attributed to smectite.
XRD traces of N1 sample. (A) Total clay sample; (B) treated clay fraction. N = untreated sample.

Table 2 lists the chemical compositions of samples. The chemical compositions of the three samples are in line with the mineralogical analysis. Samples N1 and Boum2 are richer in SiO2 and Al2O3 and poorer in CaO than sample OMB3. The high SiO2 and Al2O3 contents and the low CaO content in samples N1 and Boum2 indicate the high proportion of aluminosilicates in these two samples compared to the OMB3 sample, which has a lower phyllosilicate content and a higher calcite content.
Chemical compositions of the studied soil samples (wt.%).

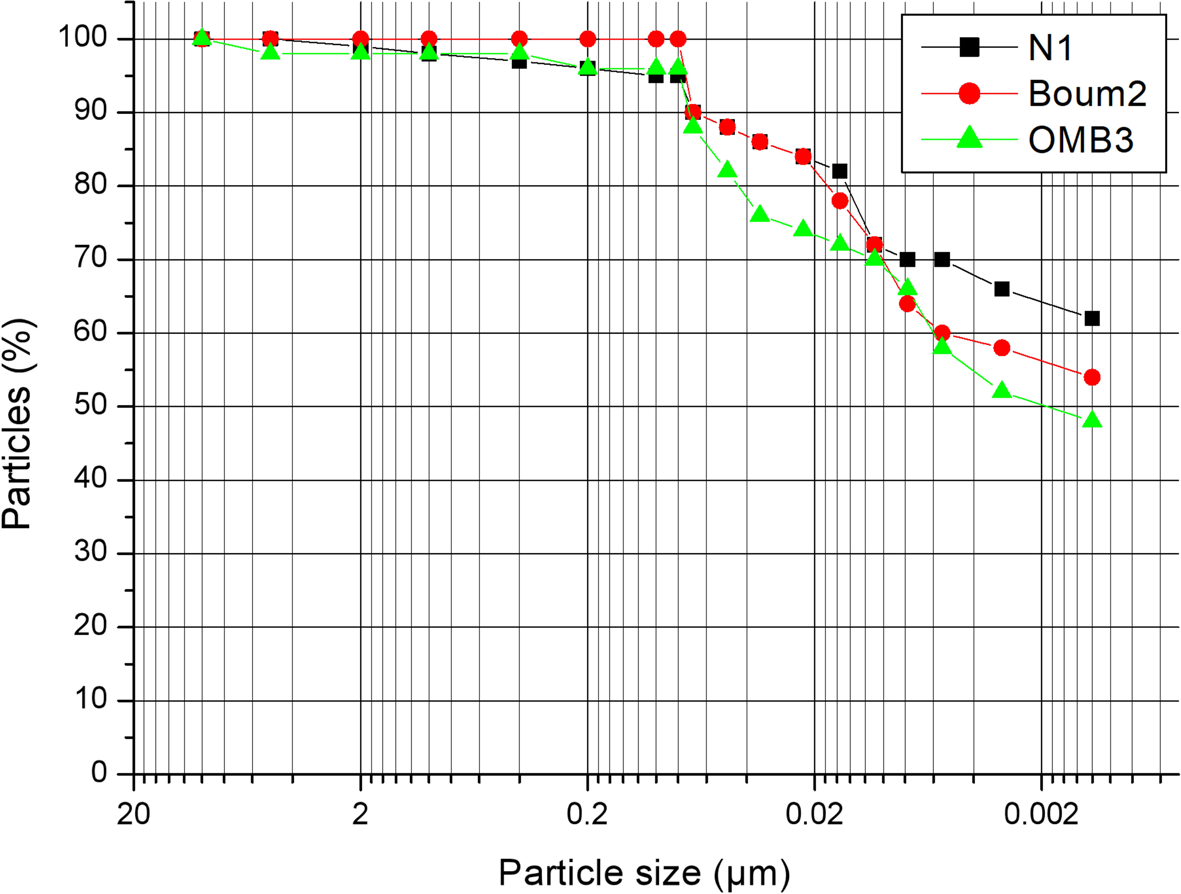
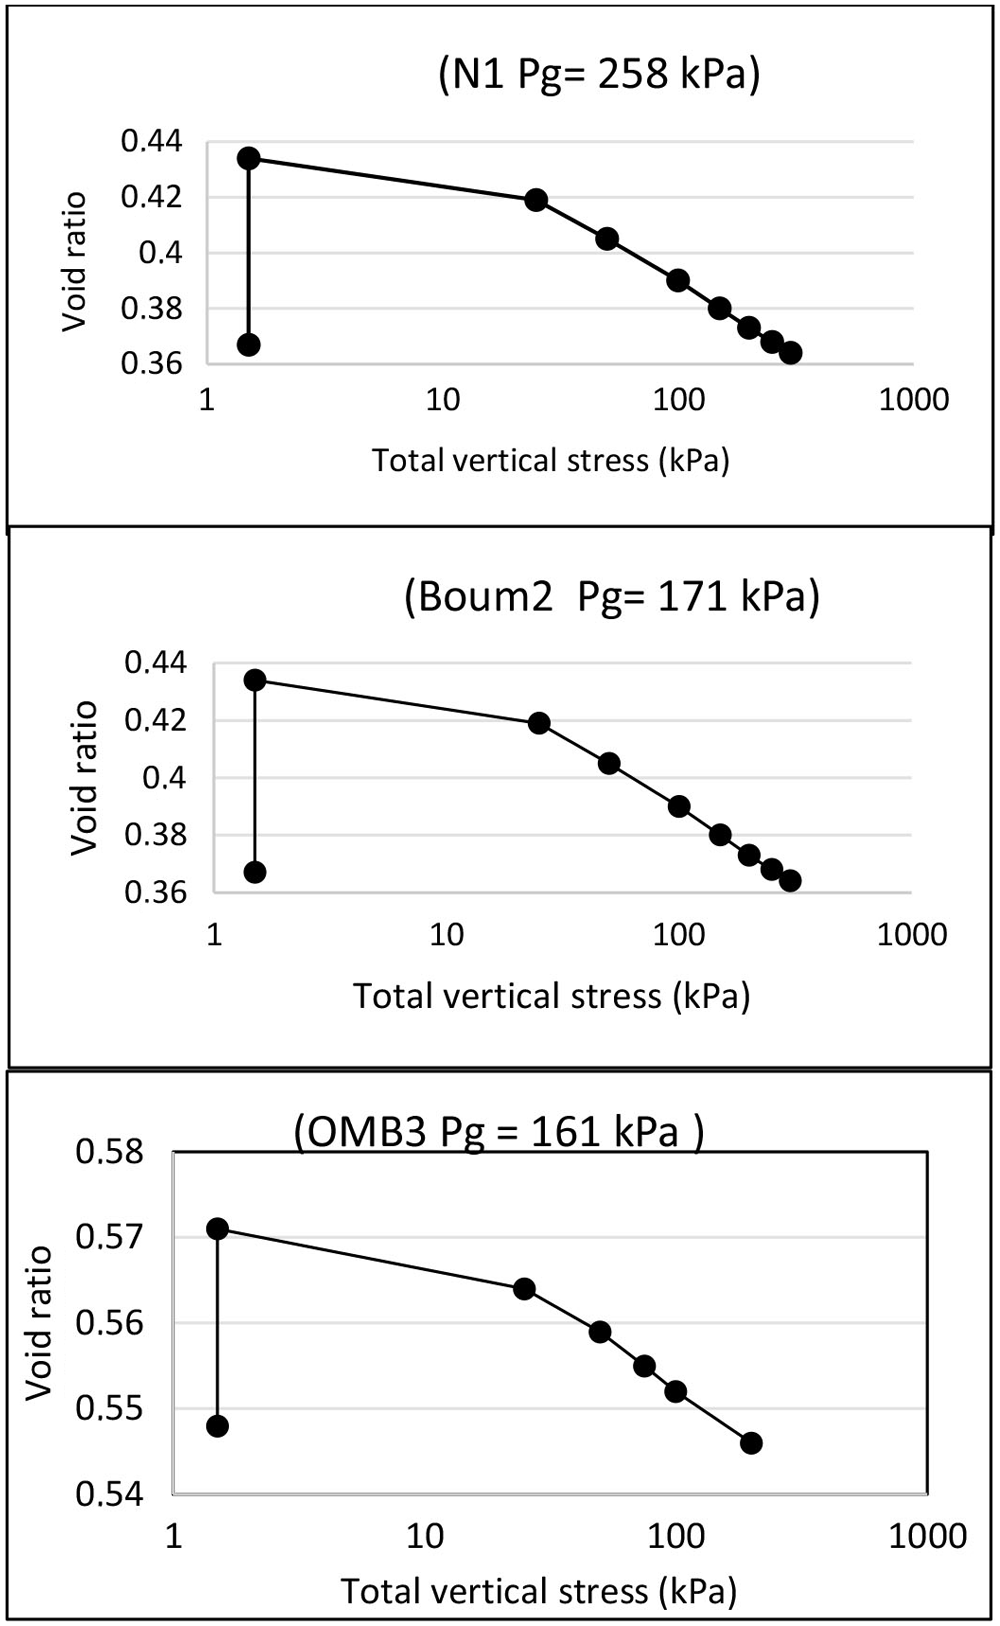
The three soil samples have a fine grain size (Fig. 3). They are very plastic and are classified as very expansive soils (Fig. 4 & Table 1).
Particle-size distribution of the studied soil samples.

Swelling pressure values of the studied soil samples. Pg = swelling pressure in kPa.

Effects of the calcium solution on the swelling of the samples
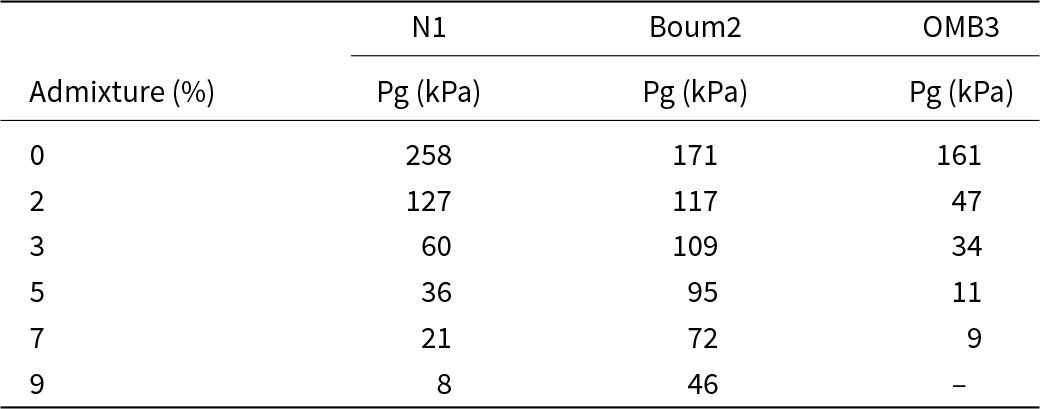
The swelling pressure evolution results of the untreated and treated samples cured for 28 days are given in Table 3. Five solution contents were used in this study: 2%, 3%, 5%, 7% and 9%. The treated samples were compared to an untreated sample considered as a reference. The test specimens prepared for swelling pressure measurements were fabricated to have conditions closely resembling their natural state.
Influence of Ca solution addition on the swelling of the samples.

Pg = swelling pressure in kPa.
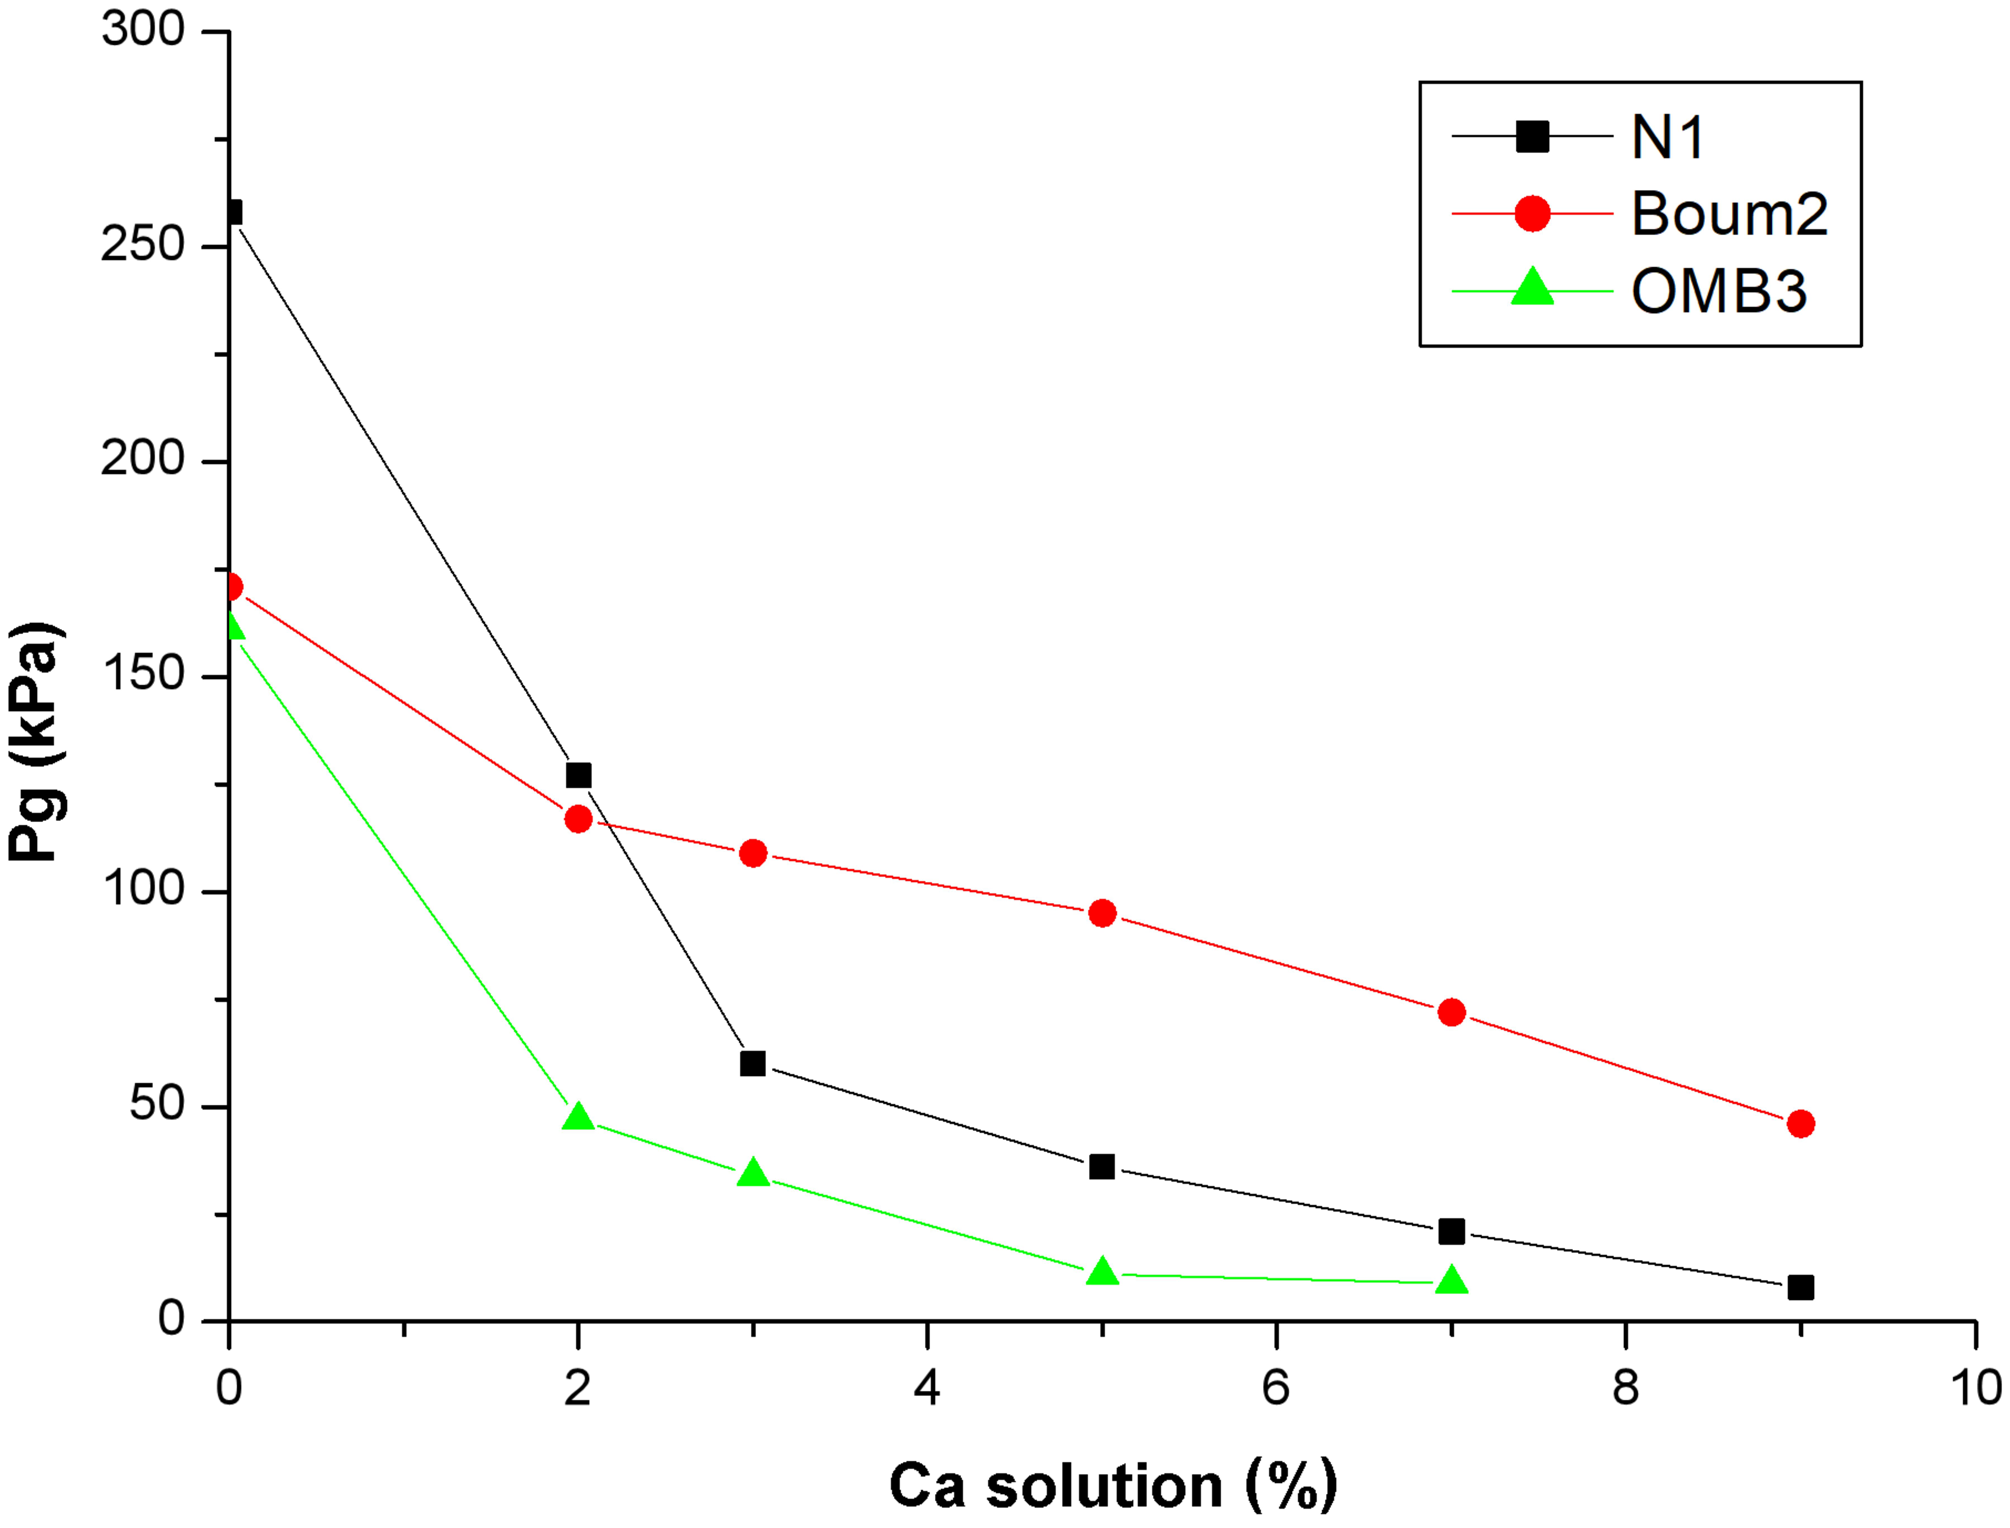
Sample N1 in its natural state is classified as a highly swelling soil with a swelling pressure of 258 kPa. The swelling reductions obtained were proportional to the amount of Ca solution added (Fig. 5). At low Ca solution dosages of 2% and 3%, the swelling pressure decreased from 258 to 127 and 60 kPa, respectively. For higher dosages of 5%, 7% and 9%, significant reductions in swelling pressure were observed, and the samples showed swelling pressure values of 36, 21 and 8 kPa, respectively. Therefore, an increase in the addition of the Ca solution significantly reduced the swelling pressure of the studied soils.
The influence of the addition of Ca solution on the swelling pressure of the three studied samples.

The responses of the Boum2 samples to the treatment with Ca solution were comparable to those of the N1 samples. The addition of 2%, 3%, 5%, 7% and 9% Ca solution to the sample produced swelling pressure values of 117, 109, 95, 72 and 46 kPa, respectively.
Concerning the OMB3 sample, the influence of the Ca solution was more significant than that observed for the other two soils. The swelling pressure decreased significantly with a small percentage increase of the added Ca solution (from 2% to 3%). At higher Ca concentrations, the swelling was negligible and the swelling pressure stabilized.
The stabilization method of adding Ca solution appeared to be very effective at reducing swelling pressure because using solutions with low Ca solution additions significantly reduced the swelling pressure. The maximum reductions were recorded after small Ca solution additions (2–3%).
Effects of the calcium solution on the mineralogical and microstructural properties of the samples
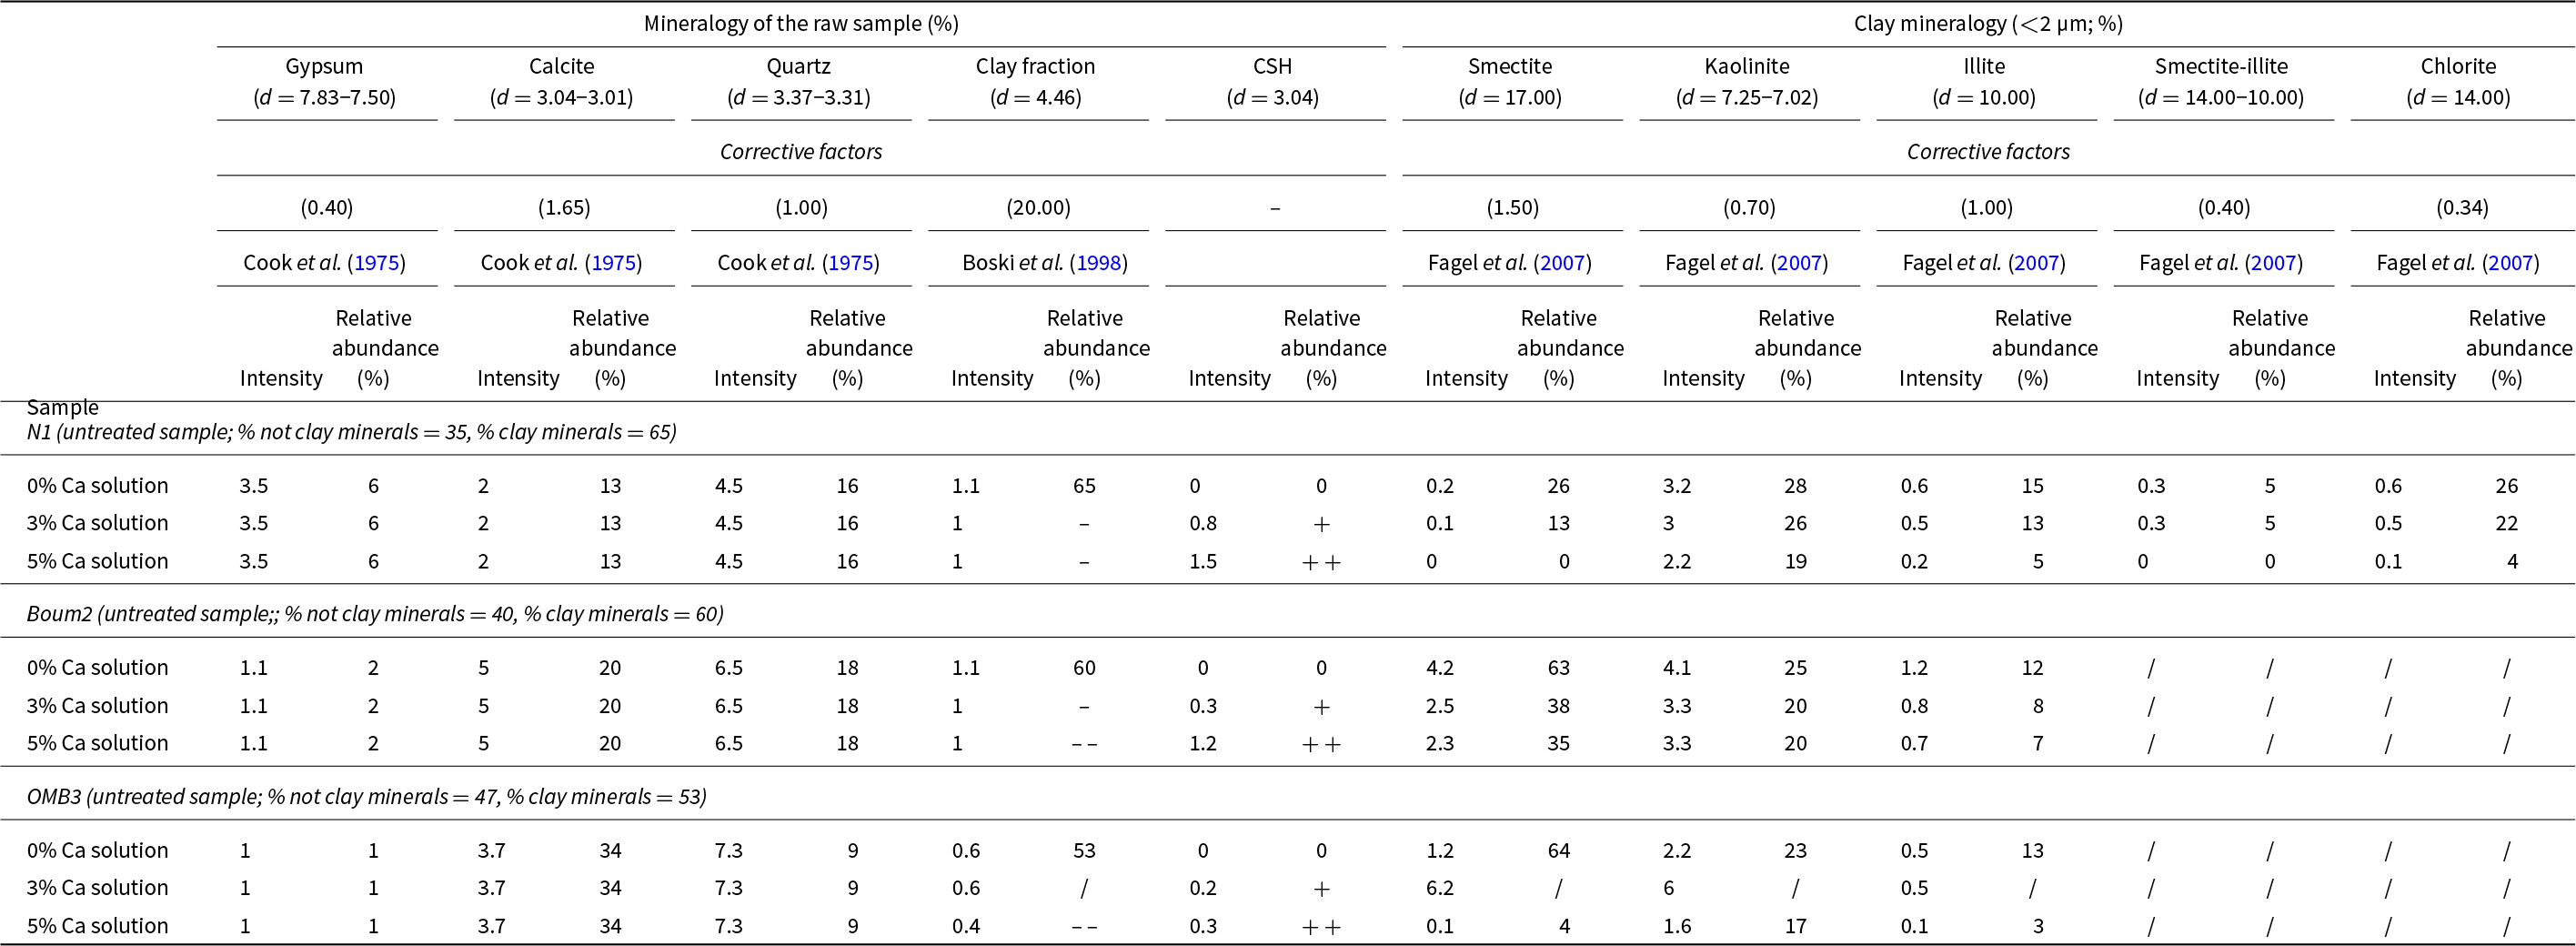
Table 4 shows the results regarding the effects of the Ca solution on the mineralogical and microstructural properties of the samples.
Mineralogy of the treated and untreated samples.

++ = present in large quantities; + = present in small quantities; – = present in very small quantities; – – = absent; /= not assessed.
Effects of calcium solution treatment on the bulk clay samples
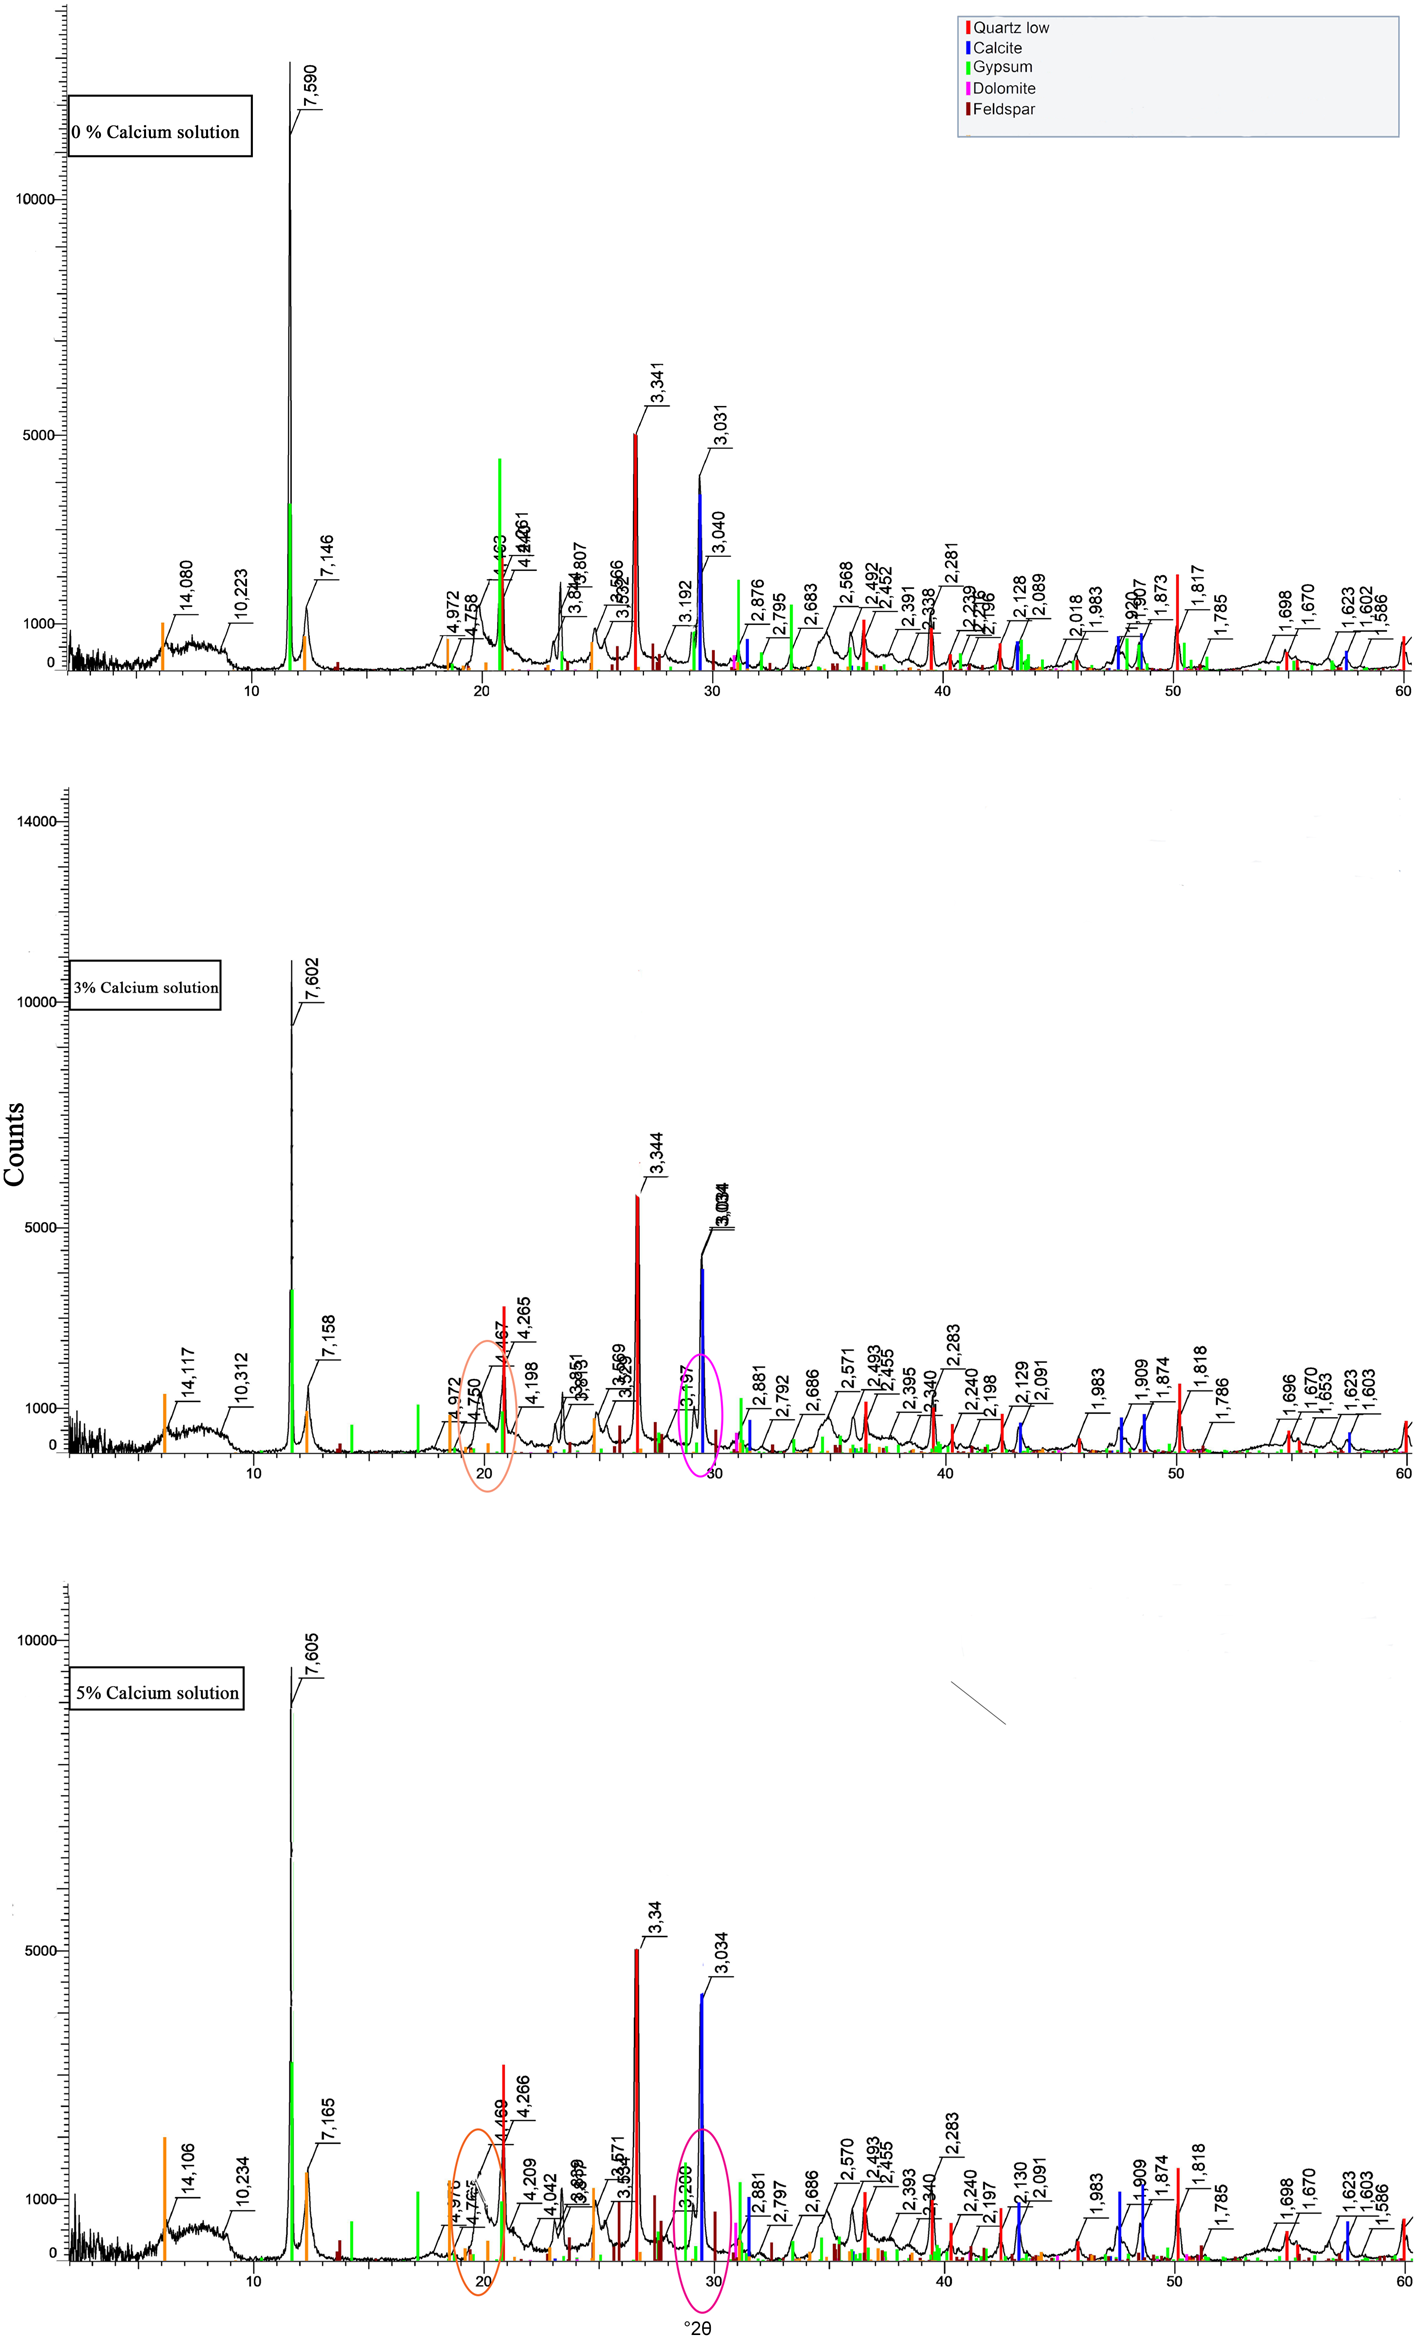
Figure 6 shows XRD traces of sample N1 in its natural state and after treatment with 3% and 5% Ca solutions for 28 days. The natural sample is essentially composed of 65% clay, 16% quartz, 13% calcite and 6% gypsum. The XRD traces of the treated sample demonstrate the appearance of new peaks attributed to pozzolanic products (CSHs). The small peak corresponding to CSHs is observed in the treated soil spectra next to the calcite peak (at 29–30°2θ). The presence of phyllosilicates is generally confirmed by the reflection at 4.46 Å. The absence of portlandite (Ca(OH)2 at 18.00°2θ) in the samples treated with 3% and 5% Ca solutions confirms the total consumption of this calcium-rich solution by the reactions.
XRD traces of the untreated bulk N1 sample and the samples treated with Ca solution. The magenta circles denote the peaks corresponding to CSH and the orange circles indicate the phyllosilicate (clay mineral) phases.

There are variations in intensity and relative abundance of the clay minerals (d = 4.46 Å) during the treatment, which decrease with increasing Ca solution percentage, indicating that this fraction is reactive during treatment. Alongside this reduction, the reflection attributed to cementitious compounds (CSHs) appears. The relative abundance of the remaining non-clay minerals (16% quartz and 6% gypsum) was not reduced during treatment, suggesting that these two minerals were not influenced by the treatment (Table 4). Other cementitious compounds (CAHs and CASHs) did not form in the treated samples.
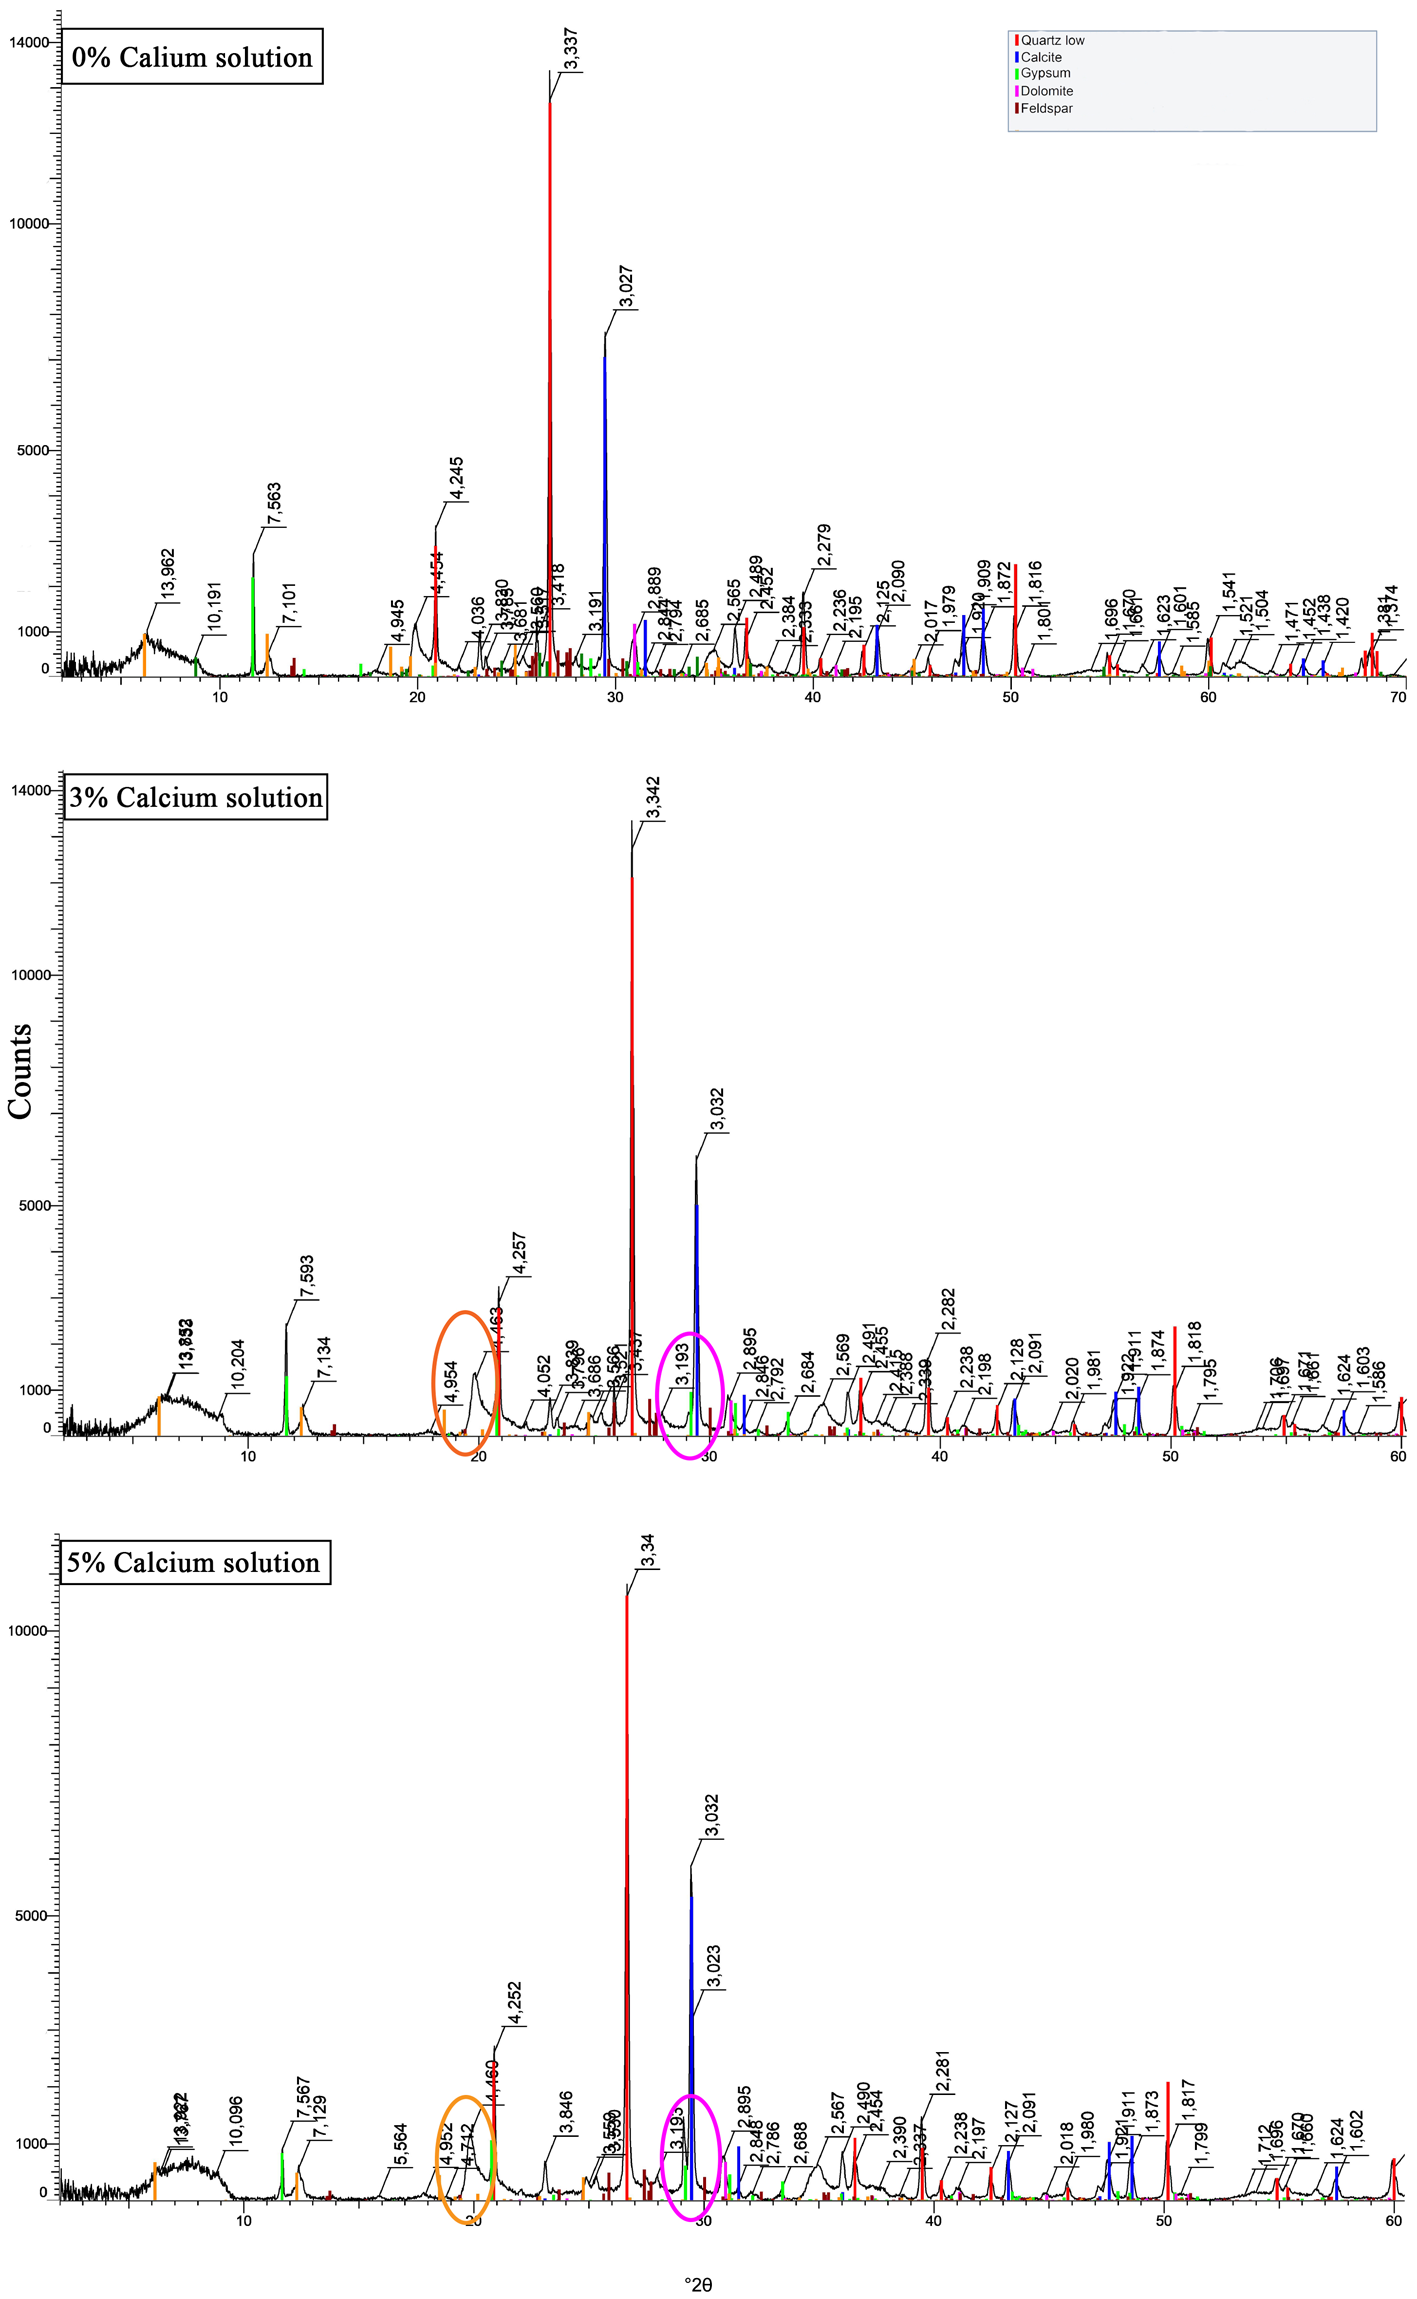
The Boum2 sample (Fig. 7 & Table 4) consists of 60% clay, 18% quartz, 20% calcite, 2% gypsum and traces of feldspars and dolomite. The sample was subjected to mineralogical changes as new minerals, namely CSH-type cementitious compounds, formed after solution treatment. The peak linked to cementitious compounds is more pronounced with 5% Ca solution addition; conversely, CAH- and CASH-type cementitious compounds were not detected in the treated samples.
XRD traces of the untreated bulk Boum2 sample and the samples treated with Ca solution. The magenta circles denote the peaks corresponding to CSH and the yellow circles indicate the phyllosilicate (clay mineral) phases.

The peak intensity of the clay fraction decreases with increasing Ca solution percentage. The relative abundance of non-clay minerals was not reduced during treatment, indicating that these minerals were not influenced by the treatment.
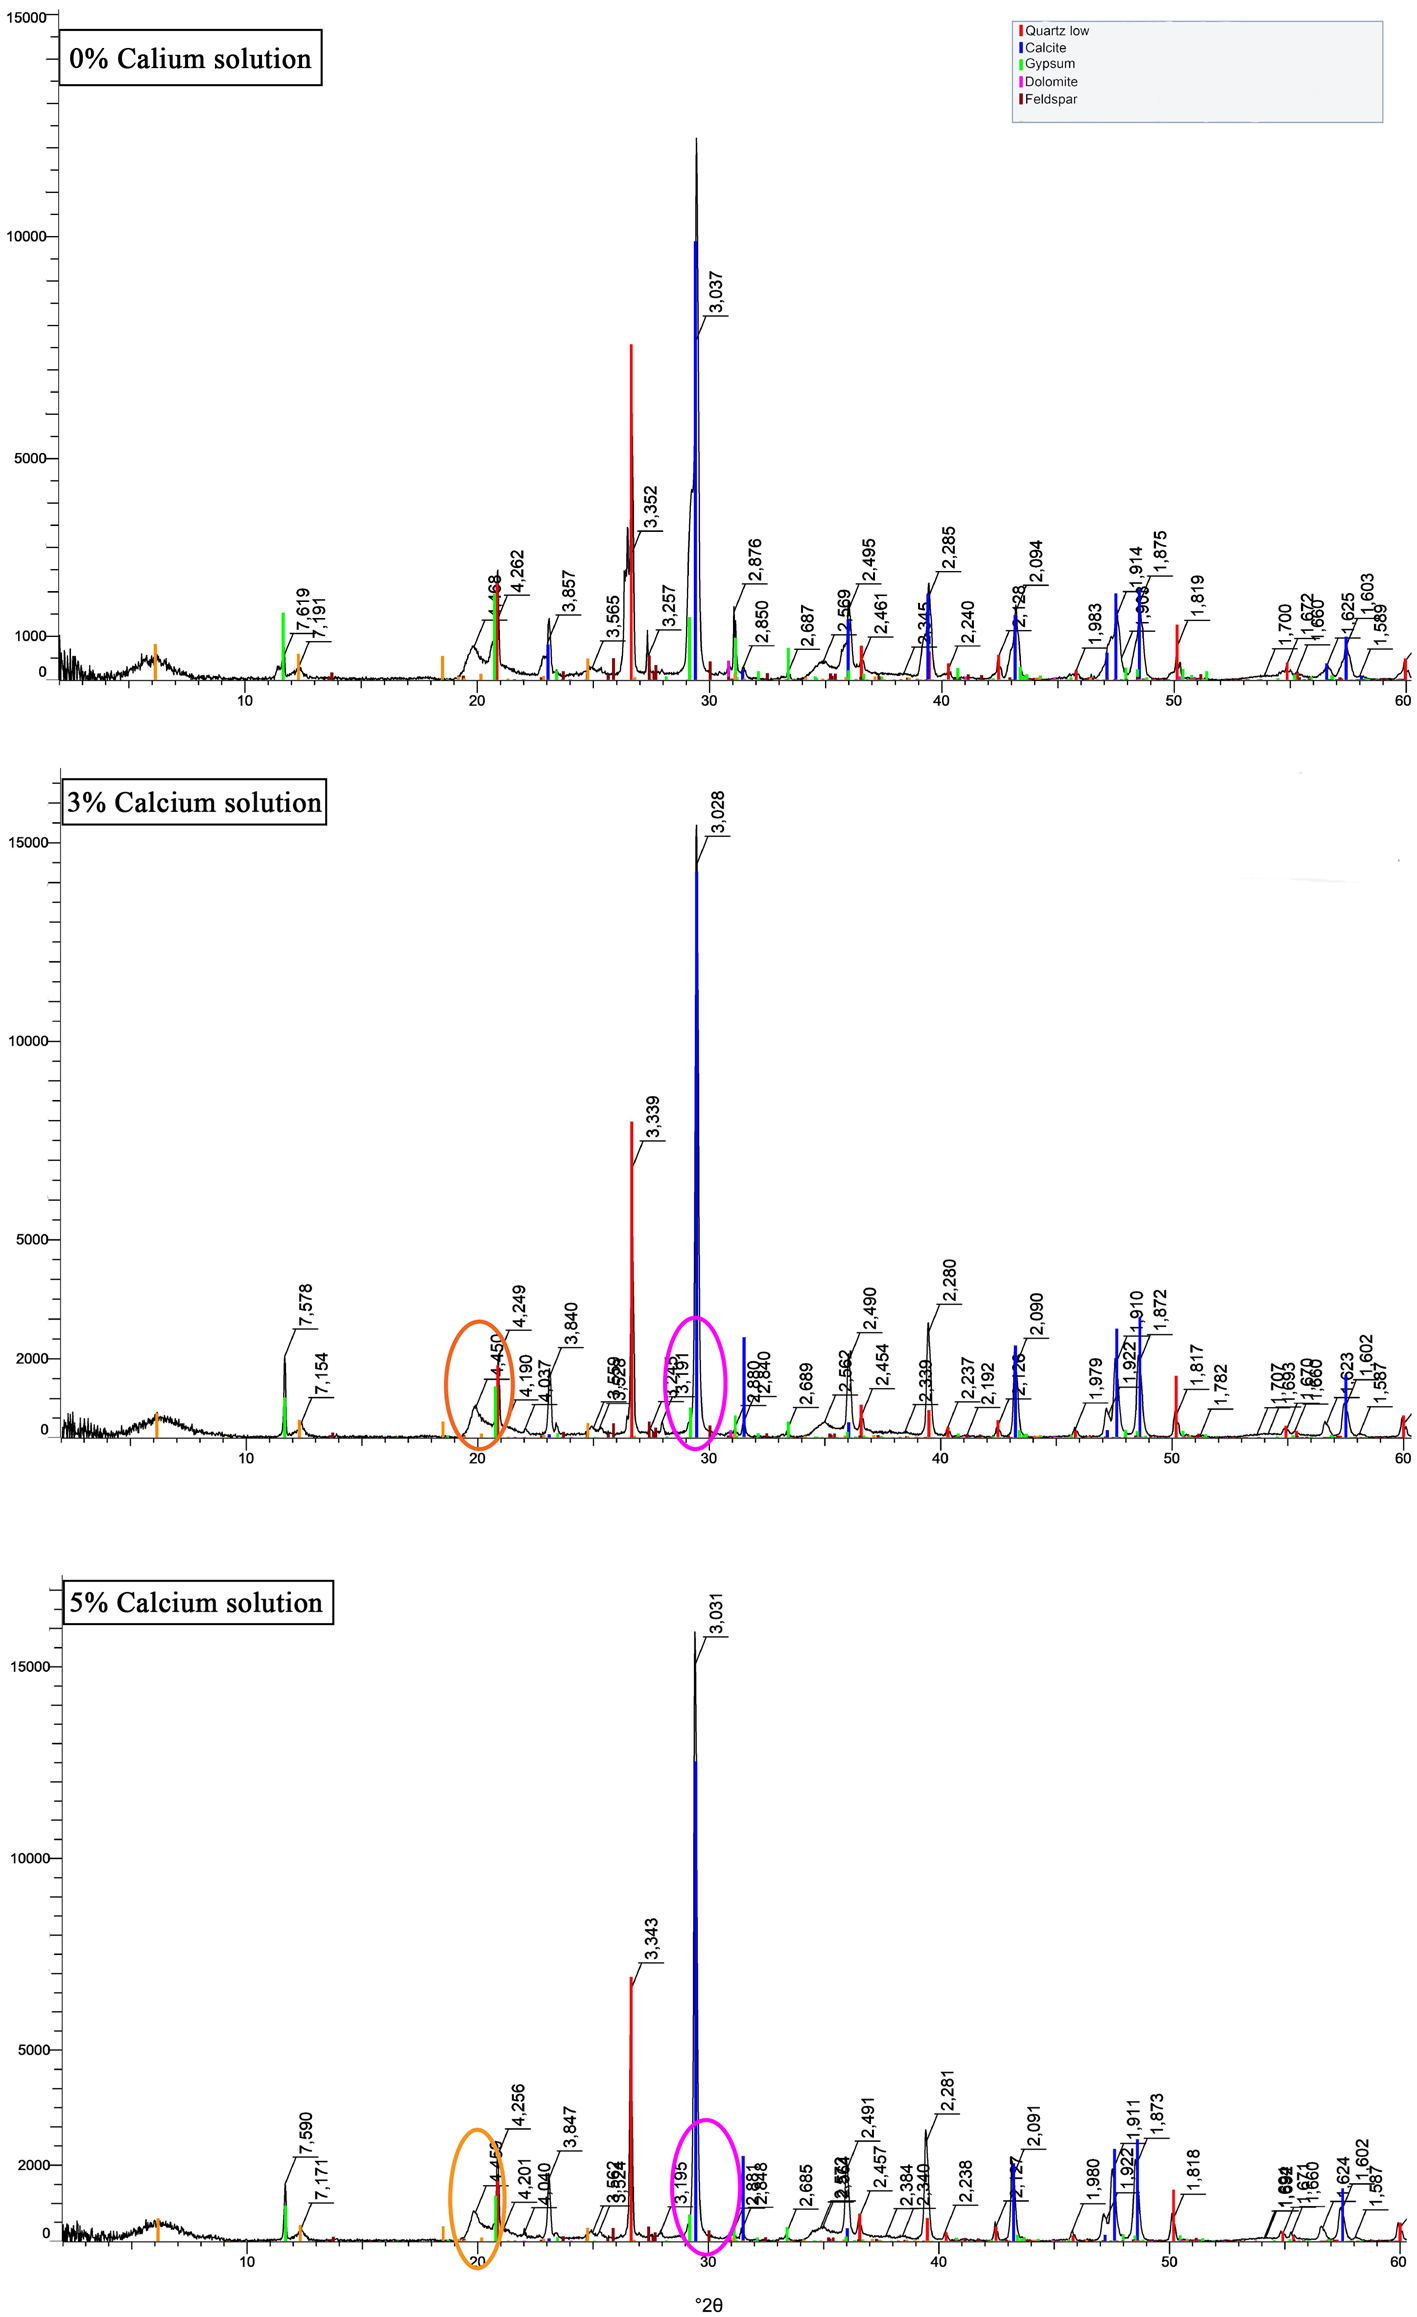
The OMB3 sample (Fig. 8 & Table 4) is similar to the two previous samples. Low-intensity peaks of the CSH compounds are observed for the samples with the addition of 5% Ca solution (Fig. 8). The intensity of the peaks attributed to the phyllosilicates decreases with increasing Ca solution percentage. The decrease of intensity of the clay minerals results from the reaction with these stabilizing additions, and the main mineralogical modification was observed after the addition of 5% Ca solution. The absence of a portlandite peak in the XRD traces of the treated samples indicates the complete consumption of the added calcium.
XRD traces of the untreated bulk OMB3 sample and the samples treated with Ca solution. The magenta circles denote the peaks corresponding to CSH and the yellow circles indicate the phyllosilicate (clay mineral) phases.

Effects of the treatment on the clay fraction (<2 µm)
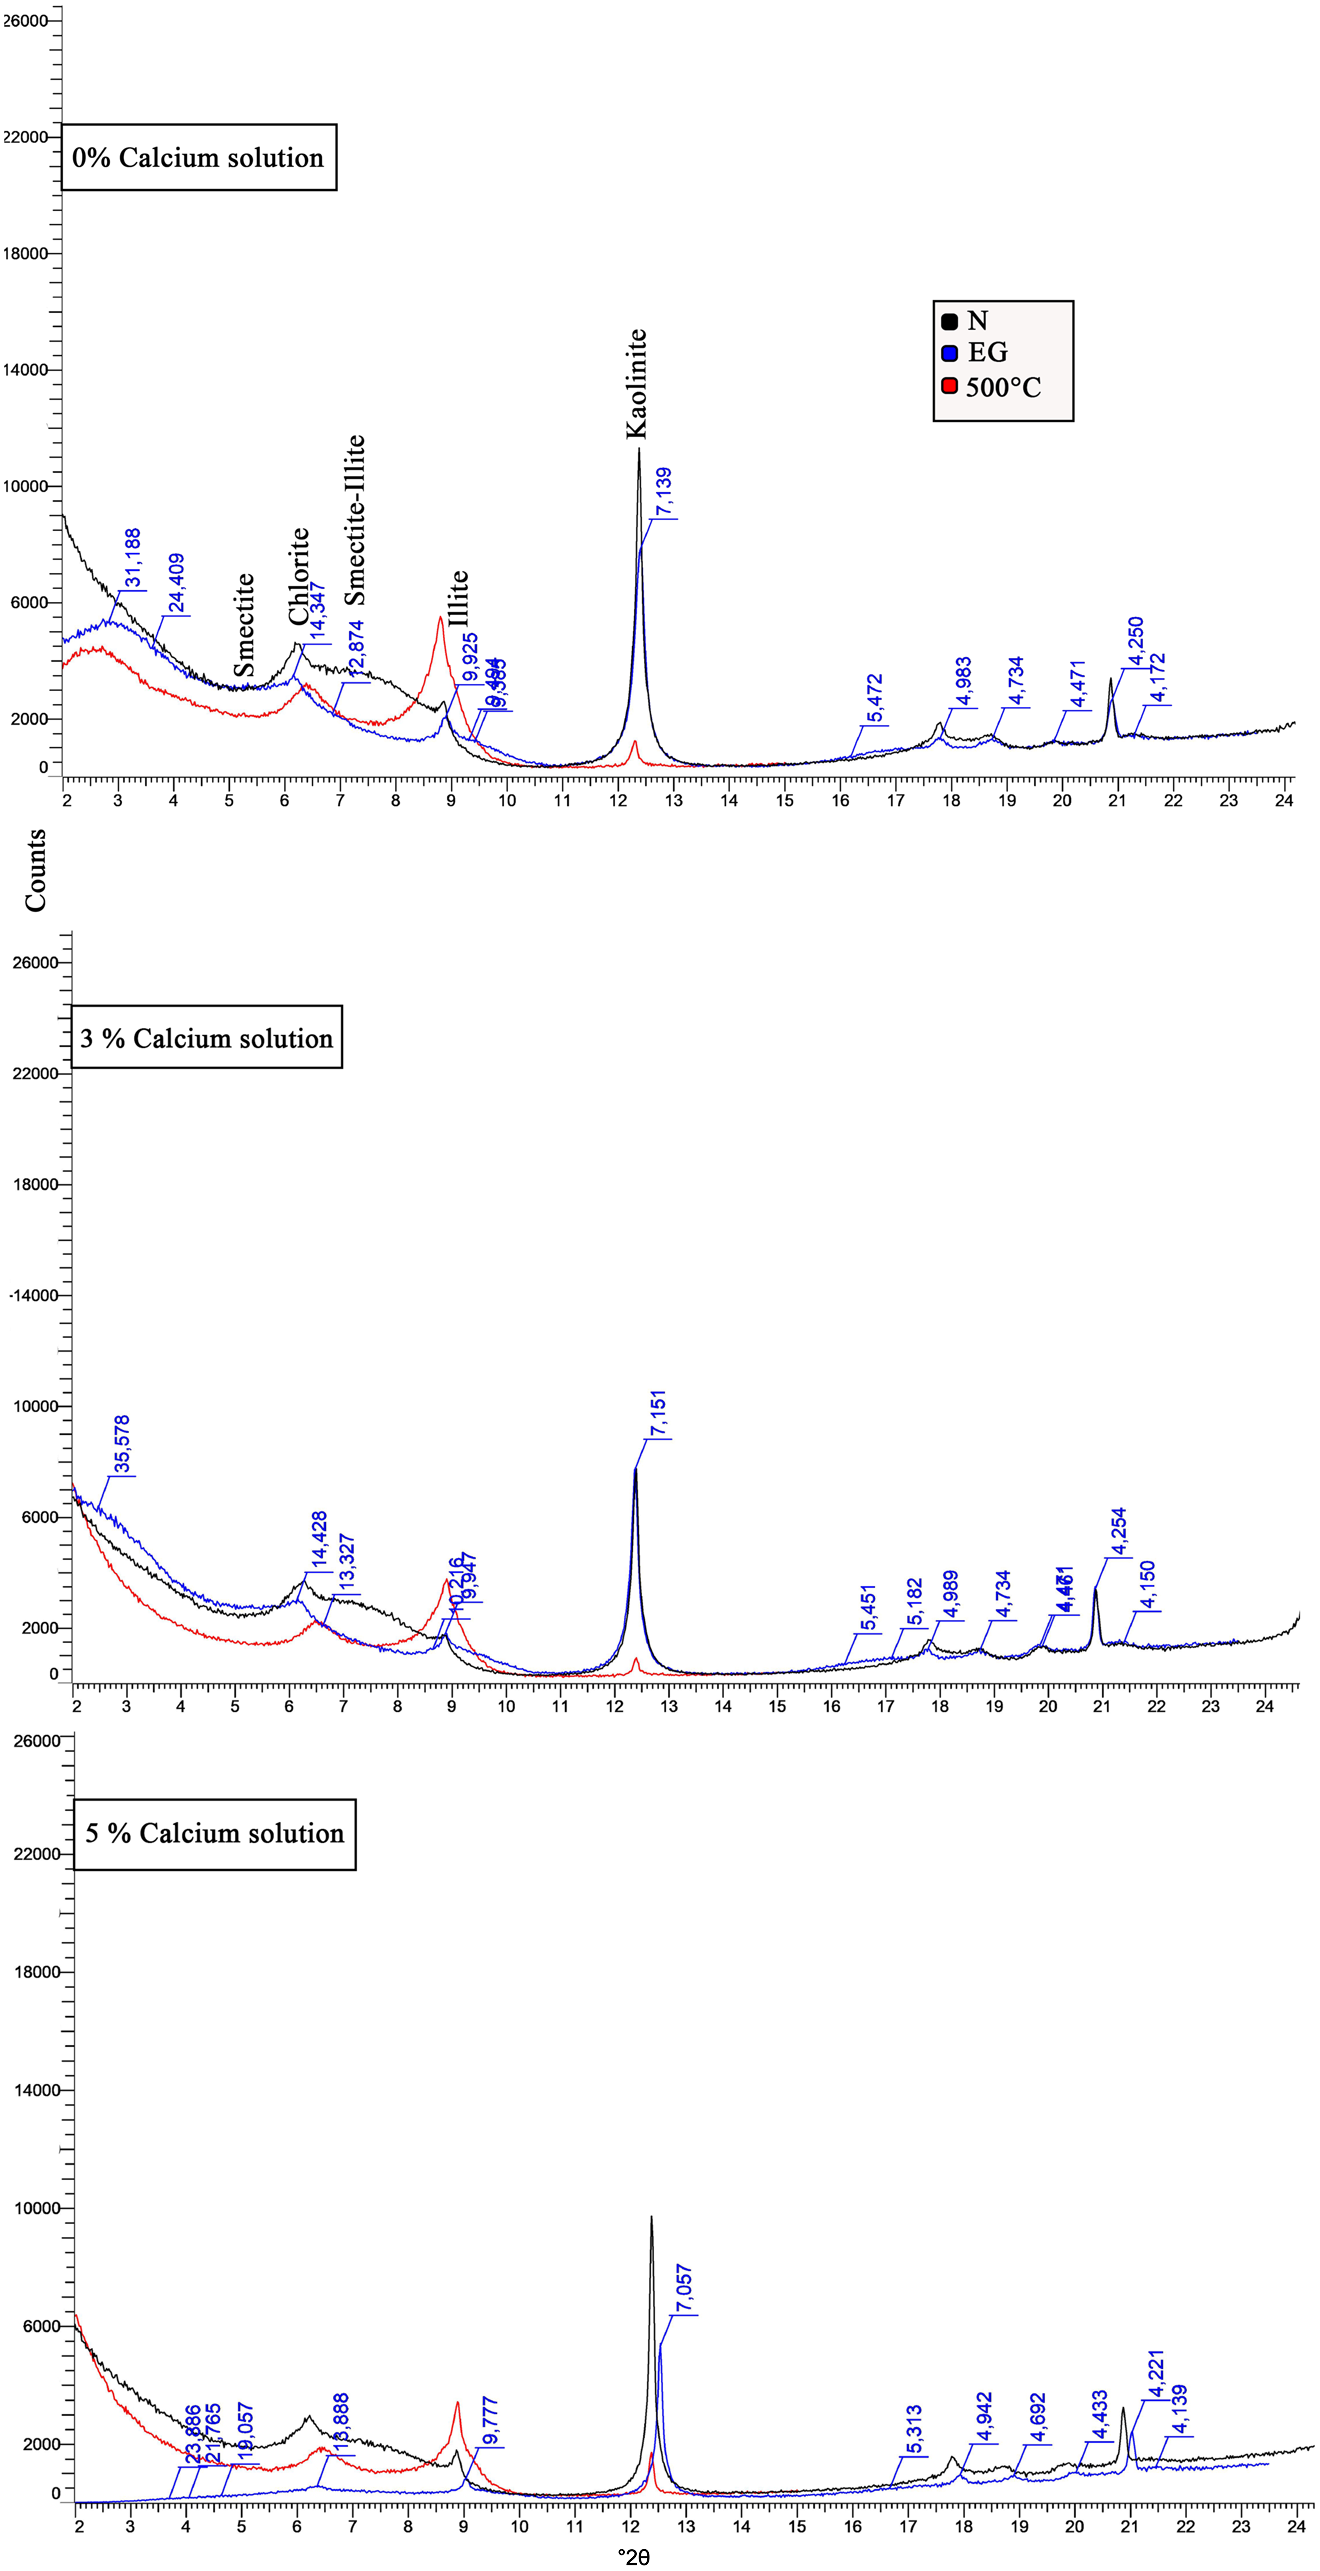
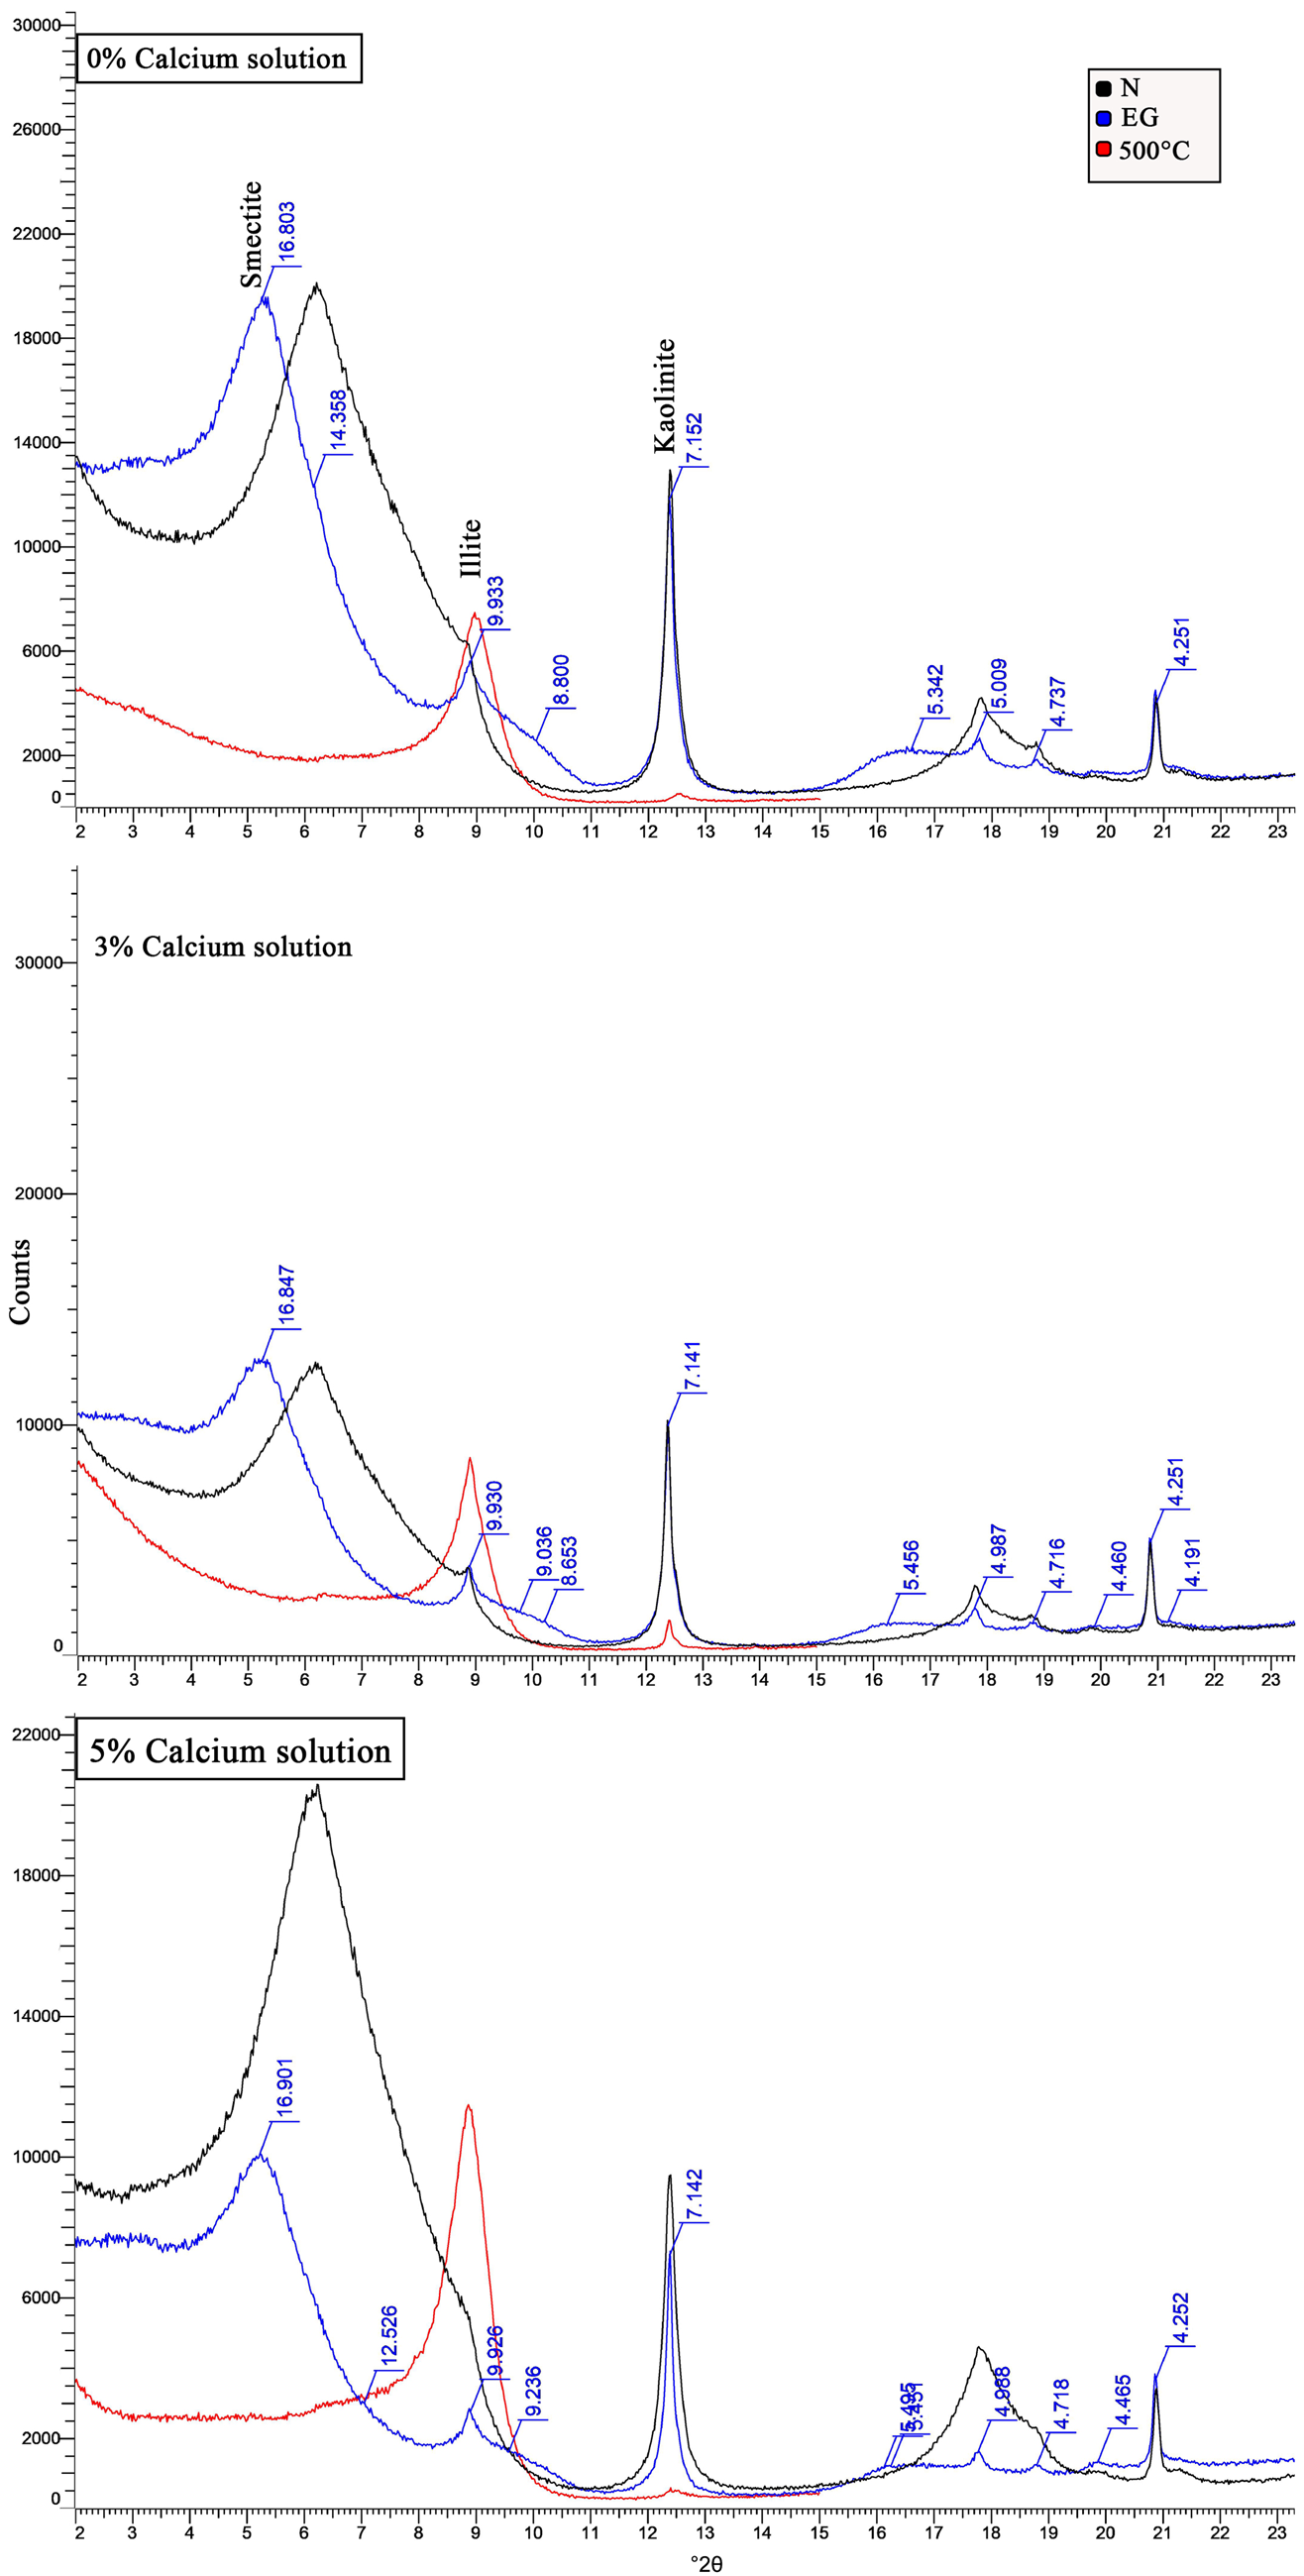
The XRD traces of the orientated clay fractions of the untreated and treated N1 sample with 3% and 5% Ca solution are shown in Fig. 9, and the results are given in detail in Table 4.
XRD traces of orientated clay fractions from untreated sample N1 and N1 samples treated with Ca solution.

Stabilizing the sample with a Ca-rich solution results in a reduction in the intensities of all clay mineral peaks. The clay mineral peaks decrease with increasing Ca solution percentage. At 3% Ca solution addition, the smectite intensity decreased from 26% to 13%, the illite intensity decreased from 15% to 13% and the chlorite intensity decreased from 26% to 22%. These decreases were significant, and all of these minerals virtually disappeared at a 5% Ca solution addition. The kaolinite peak is not affected, which indicates the low reactivity of this mineral during this treatment. Hence, the Ca solution has a significant effect on the mineralogy of this marl sample.
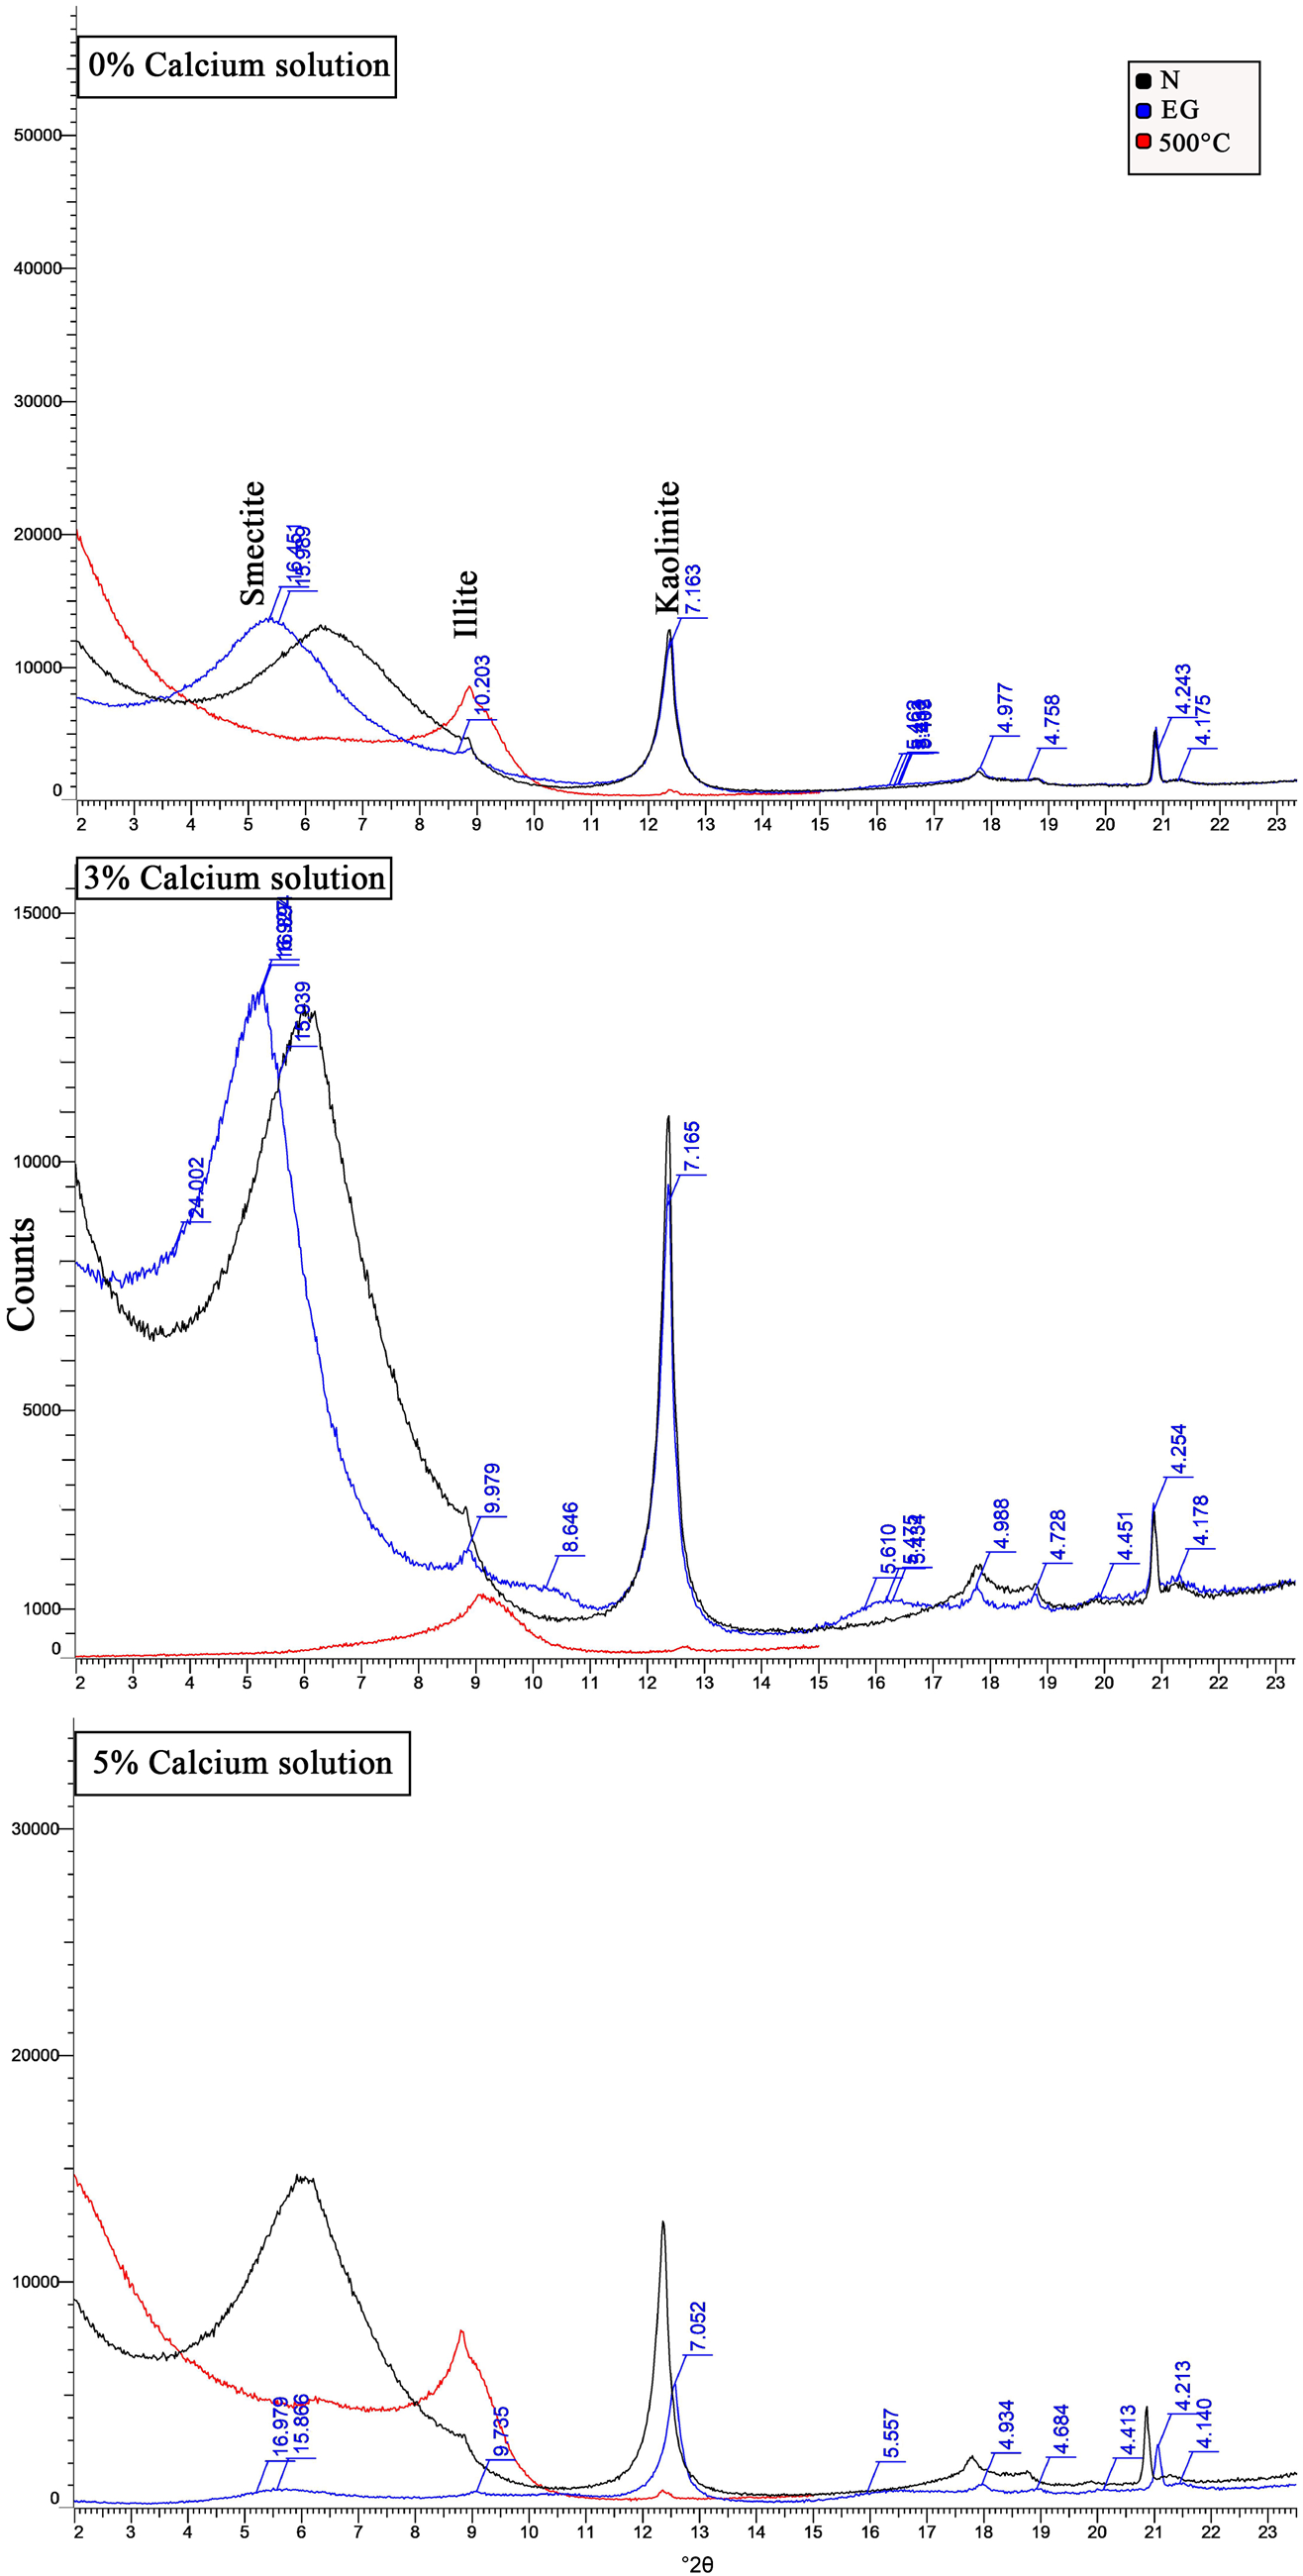
The XRD traces of orientated clay fractions of the untreated and treated Boum2 sample with 3% and 5% Ca solution are shown in Fig. 10, and the results are given in detail in Table 4. The clay fractions display variations in the peak intensity and relative abundance of the clay minerals during treatment, which decrease with increasing Ca solution percentage. At 3% Ca solution, there are significant decreases in the abundances of smectite (from 63% to 38%) and illite (from 12% to 8%) compared to that of kaolinite, which decreased only slightly (from 25% to 20%). At a higher dosage of Ca solution (5%), the reductions in intensity of these three minerals (smectite, illite and kaolinite) is significantly greater than for 3% Ca solution (Fig. 10 & Table 4).
XRD traces of orientated clay fractions from untreated sample Boum2 and Boum2 samples treated with Ca solution.

Addition of 5% Ca solution reduces the peak intensity of all clay minerals in sample OMB3 (Fig. 11 & Table 4). The reductions in the relative abundance of smectite (from 64% to 4%) and illite (from 13% to 3%) are significant. These minerals almost disappeared with the addition of 5% Ca solution, with only the kaolinite peak persisting at a lower intensity than in the untreated sample (from 23% to 17%). In contrast, addition of 3% Ca solution did not reduce the peak intensity of the minerals.
XRD traces of orientated clay fractions from untreated sample OMB3 and OMB3 samples treated with Ca solution.

DTA-TG analyses
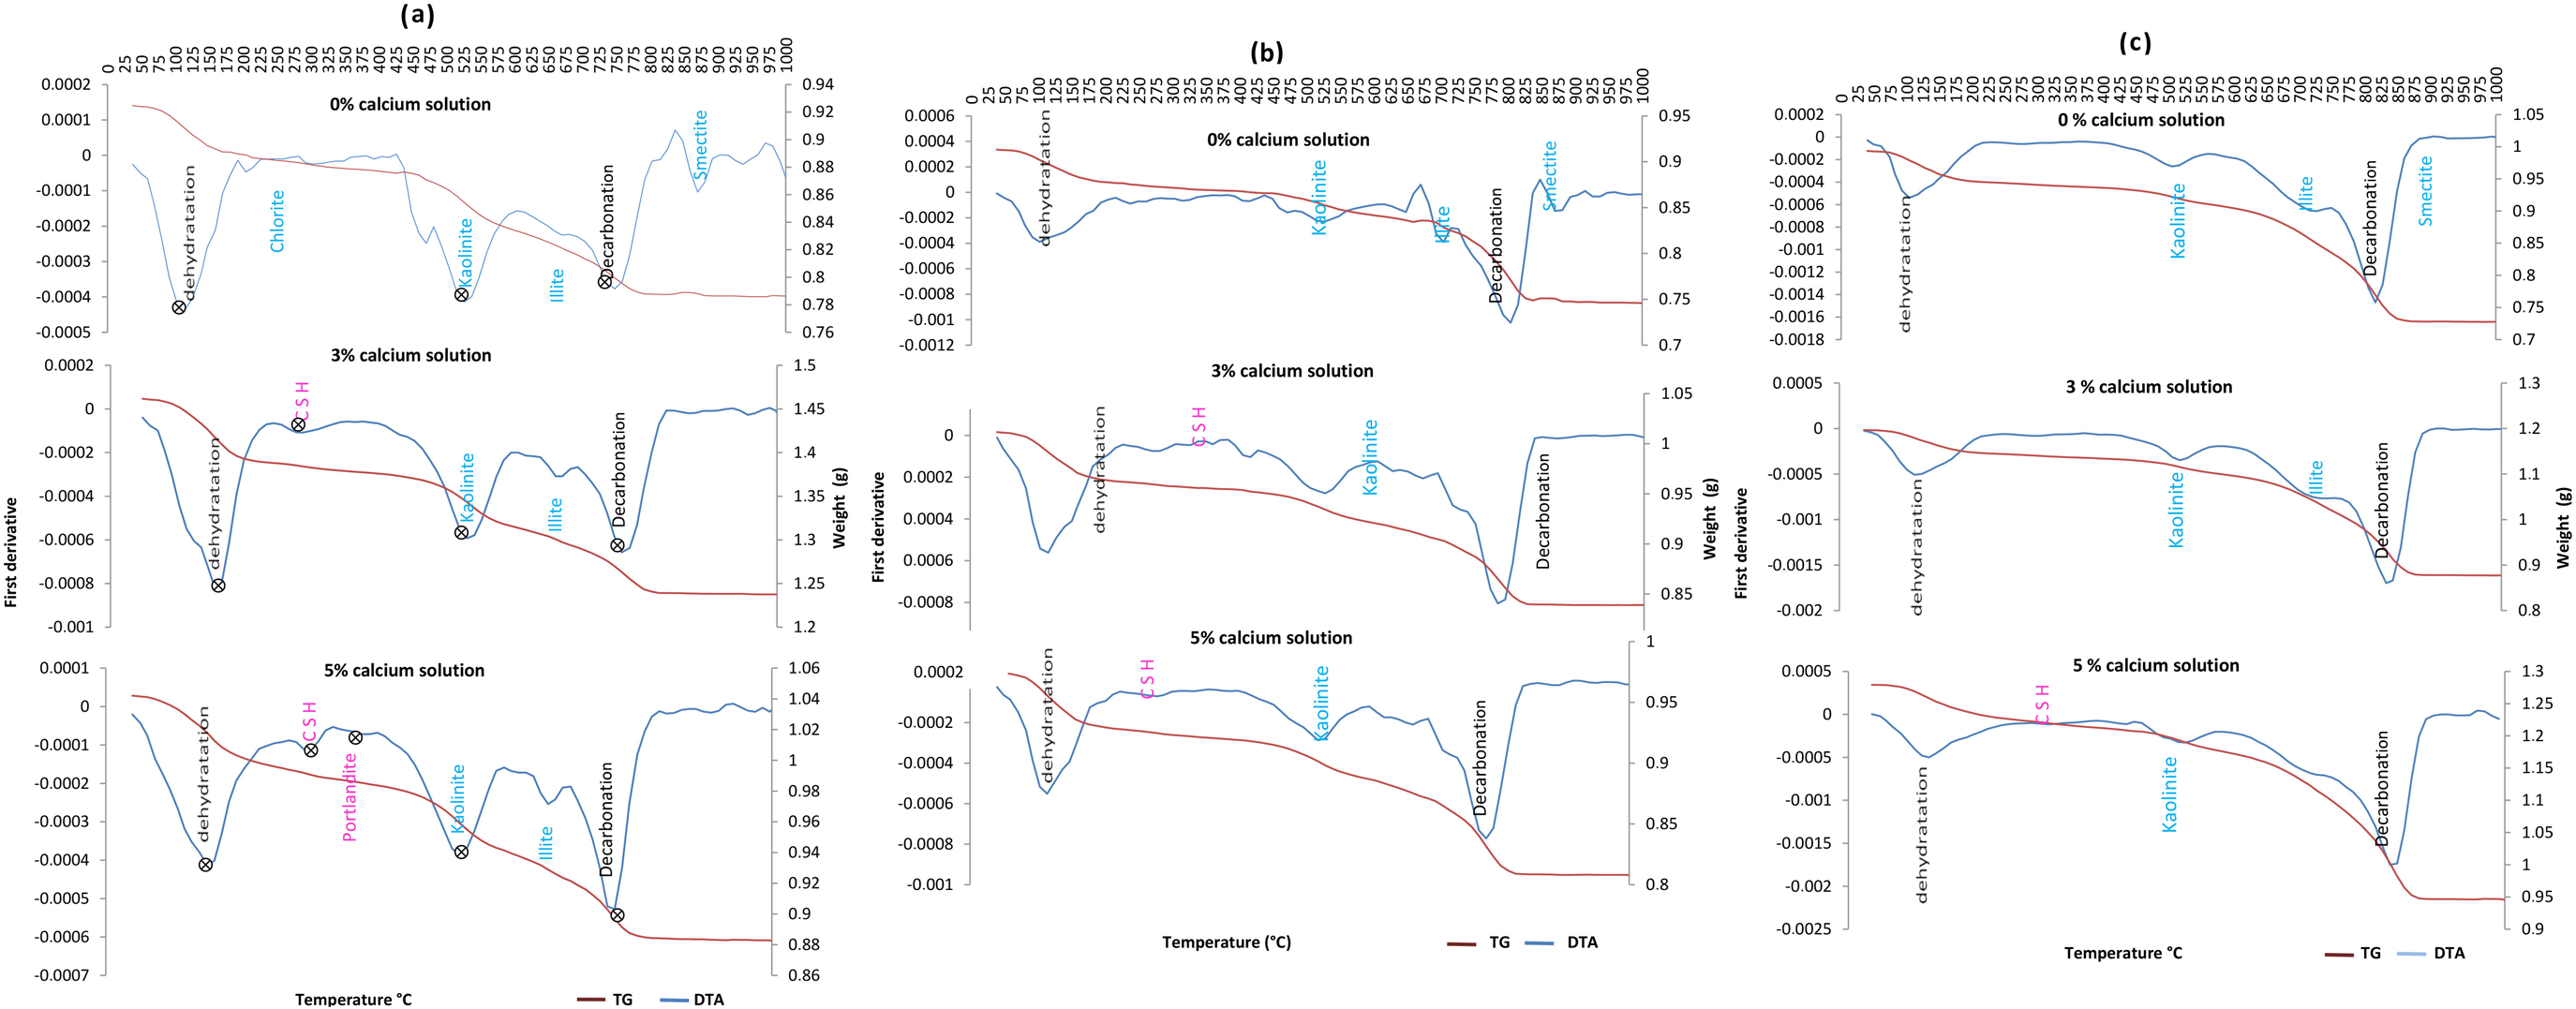
The results of the DTA-TG analysis agree with the XRD results and with previous similar studies (Guidobaldi et al., Reference Guidobaldi, Cambi, Cecconi, Deneele, Paris, Russo and Vitale2017; Maubec et al., Reference Maubec, Deneele and Ouvrard2017). The thermograms of sample N1 in its natural state demonstrate the existence of three endothermic peaks. The first peak between 100°C and 200°C is due to the release of adsorbed water from the particle surface (dehydration). The second peak at 475–550°C corresponds to the dehydroxylation of clay minerals. The last peak, at 700–800°C, corresponds to the decomposition of carbonates. The thermograms of the treated samples are characterized by a new event at 250–300°C corresponding to CSH compounds. The mass loss associated with the formation of CHS compounds increases with increasing Ca solution percentage. The mass loss of clay minerals (smectite, chlorite, illite and kaolinite) decreases with increasing Ca solution percentage (Fig. 12a).
DTA-TG curves of the untreated and treated samples: (a) N1, (b) Boum2 and (c) OMB3.

The thermograms of sample Boum2 are shown in Fig. 12b. The sample displays three mass-loss steps. The first one at 90–125°C corresponds to both the removal of water physically adsorbed on the particle surface and the removal of the interlayer water of the clay minerals. The second mass loss at 475–900°C is linked to the dehydroxylation of smectite, illite and kaolinite. The third mass loss at 775–825°C is linked to the decomposition of carbonates. The samples with the addition of 3% and 5% Ca solution showed rapid and complete consumption of the added stabilizers as well as rapid formation of new hydrated phases between 250°C and 300°C. The mass loss of the clay minerals, especially smectite and illite, decreased with increasing Ca solution percentage.
Two temperature ranges are observed in the thermograms of the OMB3 samples after the addition of 3% and 5% Ca solution (Fig. 12c). The first one is in the temperature range of 250–350°C, in which the processed samples displayed greater mass losses than the original sample. These mass losses are due to the decomposition of hydrated phases such as CSH, as identified by the XRD analysis. The second temperature range of 850–900°C is that corresponding to the dehydroxylation of smectite. The absence of portlandite confirms the consumption of portlandite and the formation of new cementitious phases (CSHs) during the 28 day curing period.
In summary, the DTA-TG results for the three treated samples are comparable. The XRD study of the bulk clays highlighted the reactions triggered by the Ca solution addition, showing that the intensity of portlandite peaks decreased over time, suggesting the strong reactivity of this phase within the material. Cementitious compounds such as CSHs were identified after 28 days of curing. The peak intensities of the clay minerals in the clay fraction decreased with increasing Ca solution percentage, probably due to the reaction of the clay fraction with the calcium in the solution.
Effects of the treatment on the microstructure of the samples
The surface of the treated samples observed at large scale appeared to be covered with cementitious products such as CSHs, as detected by XRD. These products are due to the reaction of Ca with the Si released by clay minerals, as this reaction is a basic attack that promotes the progressive destruction of phyllosilicates, and so their quantity would increase with time. These CSHs lead to greater cohesion inside the material (Al-Mukhtar et al., Reference Al-Mukhtar, Khattab and Alcover2012; Maubec et al., Reference Maubec, Deneele and Ouvrard2017). Micropores filled with these cementitious products were observed to develop inside the agglomerates.
The SEM images of untreated N1, Boum2 and OMB3 samples show that the samples had a discontinuous structure, and the pores appeared to have a quasi-circle shape and to be black in colour. Upon treatment with a Ca solution, a change in the size of the aggregates was observed. The presence of Ca ions and a high pH increased the size of the clay particle aggregates due to cation-exchange reactions and flocculation. The exchange and attraction effects of the cations brought the clay particles closer together, forming flocs, and resulting in agglomeration of the clay particles. The treatment resulted in a more compact structure in the treated samples.
The sulfate contents of samples N1, Boum2 and OMB3 were 6, 2 and 1 wt.%, respectively (Table 1). Lime treatment could be effective at stabilizing gypsum soils containing small amounts of gypsum (≤5%) and at improving their swelling properties (Aldaood et al., Reference Aldaood, Bouasker and Al-Mukhtar2014). The mineralogical results of this study (Figs 6–8) are in accord with Aldaood et al. (Reference Aldaood, Bouasker and Al-Mukhtar2014). Sample N1 contained cementitious minerals such as CSHs when treated with 9% CaO (Benyahia et al., Reference Benyahia, Boumezbeur, Lamouri and Fagel2020), but it was free of ettringite. Ettringite is known for its potential to cause swelling. Aldaood et al. (Reference Aldaood, Bouasker and Al-Mukhtar2014) reported that the intensities of all kaolinite reflections decrease during hardening, regardless of the gypsum content. This behaviour is attributed to the fact that kaolinite is consumed by the pozzolanic reaction in accordance with the pozzolanic behaviour of kaolinite. According to Aldaood et al. (Reference Aldaood, Bouasker and Al-Mukhtar2014), the main cementitious compounds present were CSHs, CAHs and ettringite. The same authors did not report ettringite crystals on samples cured at 20°C for any of the gypsum percentages used. Ettringite crystals began to appear at 180 days of curing and for 25% gypsum. The average length of these crystals did not exceed 5 µm. In the samples cured at 40°C, the results were identical to those cured at 20°C, but an early appearance of ettringite crystals was observed after 28 days for 25% gypsum (Aldaood et al., Reference Aldaood, Bouasker and Al-Mukhtar2014). In addition, the ettringite crystals were larger than those observed at 28 and 180 days when the curing temperature was 20°C. This increase in the size of ettringite crystals can be explained by the effect of thermal activation when the temperature increases from 20°C to 40°C (Al-Mukhtar et al., Reference Al-Mukhtar, Lasledj and Alcover2010).
In the present study, ettringite crystals were not observed on the SEM images for sample N1 treated with 5% Ca solution. This can be explained by the rapid infiltration of Ca in solution form inside the clay particles leading to the formation of the CSH cementitious compounds, and that Ca in solution form penetrates much faster and so does not allow sufficient time for the formation of ettringite crystals in the presence of gypsum. This therefore gives this type of treatment an advantage over other treatments (e.g. lime treatment).
Similarly in sample N1 treated with 9% lime (Benyahia et al., Reference Benyahia, Boumezbeur, Lamouri and Fagel2020), the absence of ettringite can be explained by the low sulfate content (6 wt.%), which is not sufficient for ettringite to form.
Discussion
Addition of a Ca solution to the clays used in this study triggered chemo-mineralogical reactions, namely cation exchange between Ca ions and the clay mineral surface (smectite, illite, kaolinite, chlorite, etc.) and pozzolanic reactions, which develop over time due to the availability of Ca, Al and Si in the soil–adjuvant system. There were variations in the relative abundance of the minerals in the clay fraction during the treatment (Figs 9–11), which decreased with increasing Ca solution percentage, suggesting that there is reactivity with this fraction. In addition, cementitious compounds (i.e. CSHs) appeared. The reduction in the intensity of the clay fraction during treatment was due to the development of pozzolanic reaction products (CSHs) during curing, which are associated with the reaction of Ca with the Si released from clay minerals.
The non-clay minerals were not significantly influenced by the treatment. The intensity of the main quartz peak was not reduced, suggesting that the quartz was not influenced by the reactions to become an additional source of Si. In the OMB3 sample, an increase in the calcite peak intensity was observed during the treatment, which can be explained by the carbonation of this sample. Carbonates may form shortly after the treatment of silt with lime (Deneele et al., Reference Deneele, Le Runigo, Cui, Cuisinier and Ferber2016). Carbonation disrupts this treatment because it consumes part of the calcium intended for pozzolanic reactions without improving the mechanical performance of the treated materials (Maubec, Reference Maubec2010).
In the presence of clay minerals with ion-exchange properties, Ca2+ cations made available by dissolution can be exchanged with cations present in untreated minerals (Bell, Reference Bell1996; Al-Mukhtar et al., Reference Al-Mukhtar, Lasledj and Alcover2010a, Reference Al-Mukhtar, Khattab and Alcover2012; De Windt et al., Reference De Windt, Deneele and Maubec2014; Chemeda et al., Reference Chemeda, Deneele, Christidis and Ouvrard2015), inducing flocculation and modification of the particle-size distribution. In addition, the pozzolanic activity is linked to the presence of an SiO2-rich phase in the clays and of Al2O3, induced by the presence of calcium in the water (Guidobaldi et al., Reference Guidobaldi, Cambi, Cecconi, Comodi, Deneele and Paris2018). The evolution of pozzolanic activity is strongly dependent on the clay mineralogy (Deneele et al., Reference Deneele, Le Runigo, Cui, Cuisinier and Ferber2016; Vitale et al., Reference Vitale, Deneele, Russo and Ouvrard2016a, Reference Vitale, Russo and Deneele2016b, Reference Vitale, Deneele, Paris and Russo2017; Maubec et al., Reference Maubec, Deneele and Ouvrard2017).
The intensities of all smectite reflections decreased during treatment. This behaviour is attributed to the fact that smectite is most affected by pozzolanic activity and illite is less influenced by the pozzolanic reaction than smectite. In addition, the kaolinite and chlorite peaks were not affected significantly during treatment. These results are in agreement with early studies on the reaction of hydrated lime with clay minerals including kaolinite, halloysite, calcium and sodium bentonite and montmorillonite, which showed that clay minerals display various reactivities for lime and that illite and montmorillonite are more easily dissolved than kaolinite and halloysite (Eades & Grim, Reference Eades and Grim1966).
The pozzolanic activity of lime-treated clays strongly depends on the mineralogy of the clay, with the continuous dissolution of montmorillonite via pozzolanic reactions being the source of the silica that forms CSHs (De Windt et al., Reference De Windt, Deneele and Maubec2014). The treated bentonite samples rapidly consumed portlandite at lime contents up to 20%, with the high reactivity of the smectite and illite favouring the formation of CSH compounds over the very short term (Vitale et al., Reference Vitale, Deneele, Paris and Russo2017). By contrast, adsorption of calcium or Ca(OH)2 as coatings on the kaolinite surface prevents such dissolution at high pH, thereby reducing the release of Si and Al and delaying the kinetics of pozzolanic reactions (Chemeda, Reference Chemeda, Deneele, Christidis and Ouvrard2015). This would slow down the dissolution of kaolinite and explain the greater Ca2+ reactivity of bentonite. The high reactivity of bentonite is attributed to the rapid and total consumption of portlandite (Vitale et al., Reference Vitale, Deneele, Paris and Russo2017), which can be attributed to the greater cation-exchange capacity of montmorillonite and its large specific surface area (Boardman et al., Reference Boardman, Glendinning and Rogers2001).
The differences observed between the dissolutions of kaolinite, chlorite, illite and montmorillonites are generally due to their structural differences. Precipitation of secondary phases such as CSHs and CAHs is more pronounced in the case of Ca2+ bentonite treatment, supporting faster dissolution (Maubec et al., Reference Maubec, Deneele and Ouvrard2017). However, the arrangement of kaolin particles is strongly dependent on pH, with a split face-to-face arrangement at pH 4.6 that changes to a dispersion at high pH. Moreover, the addition of suspended Ca ions induces the formation of larger particle aggregates, formed by the stacking of multiple particles with face-to-face arrangements (Vitale et al., Reference Vitale, Deneele, Russo and Ouvrard2016a). In the case of the swelling soils treated with a Ca solution in this study, it seems that the Ca2+ ions significantly affected the mineralogy of clays because all clay minerals were influenced, with traces of smectite and illite and small amounts of chlorite and kaolinite remaining in samples N1 and OMB3. The nearly complete disappearance of smectite-type minerals upon reaction with the calcium solution was probably due to the high pH of the porewater, because the increase in pH accelerated this alteration due to the high exchange-cationic capacity and large specific surface area of smectite.
Thermal analysis results demonstrate the appearance of a new endothermic event in the temperature range 250–300°C due to the formation of CSH compounds. The formation of these compounds generally increased with increasing solution addition. The mass loss (wt.%) of clay minerals decreased with increasing Ca solution percentage, which is in accordance with the results of the XRD analysis and of similar previous studies (Guidobaldi et al., Reference Guidobaldi, Cambi, Cecconi, Deneele, Paris, Russo and Vitale2017; Maubec et al., Reference Maubec, Deneele and Ouvrard2017).
In summary, the main cementitious compounds found in the treated soil samples were CSHs. The absence of CAHs and CASHs may be due to the mineralogy of the clay fraction, in particular the presence of smectite, which provides the silicon to form CSH compounds. These hydrated compounds connect the clay grains together by forming solid bridges, leading to their stiffening and, consequently, a reduction in swelling. Similar stabilization results were obtained previously using 5% lime on the same N1 sample (Benyahia et al., Reference Benyahia, Boumezbeur, Lamouri and Fagel2020). When lime (CaO) is added to soil, an exothermic reaction occurs within the first few hours. This reaction involves the hydration of lime, yielding portlandite (Ca(OH)2).
The solubility of portlandite in pure water decreases with temperature, and this reaction results in the release of Ca2+ and hydroxyl ions into the solution. The latter will lead to an increase in soil pH depending on the quantity of added lime (Maubec, Reference Maubec2010). In the present study, the satisfactory improvement of soil properties with the addition of a small percentage of Ca solution can be explained by the solubility of Ca(OH)2 in water and the release of Ca2+ ions, which come into direct contact with the soil, unlike in the experiments using lime.
The treatment of soils with a Ca solution effectively reduces the swelling pressure compared to a lime treatment. The results obtained regarding the significant reduction of soil swelling in these areas with the addition of low percentages of Ca solution indicate that this treatment constitutes a practical solution to be considered in order to overcome the problems of using swelling soils during civil engineering works. This technique is advantageous particularly with regard to the cost and the ease of application compared to other treatment methods.
The SEM images of samples N1, Boum2 and OMB3 before any treatment showed a loose structure with several scattered open pores. After treatment, however, only few pores were preserved and cementation seemed to have taken place. Consequently, the structure became denser, and the cementing material appeared as white lines and aggregates. In addition, the absence of ettringite was noted in samples Boum2 and OMB3, as well as for sample N1 (which contains 6% sulfates) treated with 9% lime (Benyahia et al., Reference Benyahia, Boumezbeur, Lamouri and Fagel2020).
Conclusions
The results given in this article make it possible to comment on the influence of treatment with a Ca solution on the swelling and mineralogy of clay soils, focusing mainly on the dissolution of minerals from the clay fraction, which is considered to be the main swelling factor.
The effectiveness of the treatment with a Ca solution on soil swelling is attributed to the chemo-mineralogical evolution of the treated materials. The changes in the geotechnical properties of soils after the addition of a Ca solution are due to the dissolution of clay minerals, which are considered to be the main factor in the swelling of these soils, and to the formation of cementitious CSH compounds, as identified by XRD. The formation of a CSH cement phase is related to the presence of smectite in the clay minerals of these soils.
The treatment reduced the peak intensities especially of smectite compared with illite. However, kaolinite and chlorite were not affected significantly. Characterization by thermal analysis confirmed the formation of new CSH phases from the dissolution of the clay minerals. The treated samples showed a decrease of porosity, as the structure became denser and the cementing material covered the aggregates. Ettringite crystals were absent from the samples, including sample N1 (which contains 6% sulfates) when treated with 9% lime.
The addition of Ca solution represents an effective method for reducing swelling pressure because even with the addition of only a 2% Ca solution there was a significant reduction in swelling pressure.
Acknowledgements
None.
Financial support
None.
Competing interests
The authors declare none.