1. INTRODUCTION
Social scientists have been inquiring about the determinants of black–white differences for decades, focusing on educational attainment, health status, labor market, and family outcomes, among others.Footnote 1 One of these lines of research has explored the evolution of black–white marriages over time and its striking rarity, which persists in the 21st century, possibly providing policy recommendations on how to reduce the racial divide in the US. For one thing, black–white inter-marriage rates are commonly viewed as an indicator of the health of race relations in a society [Fryer (Reference Fryer2007)].
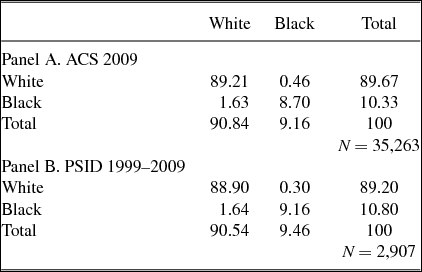
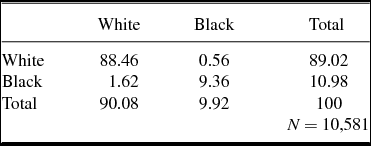
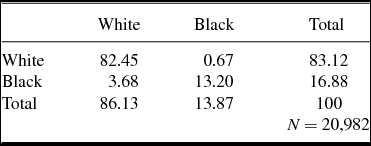
Table 1 reports matching patterns between blacks and whites in the US for recently married couples (4 years or less) aged 23–50 years, based on the 1% Census sample (American Community Survey, ACS, 2009), in the top panel, and on several waves of the Panel Study of Income Dynamics (PSID) 1999–2009, in the bottom panel. Two stylized facts emerge from this table. First, in 2009, only 2.1% of couples are black–white, while if race were an irrelevant trait in marriage, this percentage would amount to about 18%. In addition, 78% of these inter-racial couples correspond to white wife–black husband ones, whereas, under random matching, the expected 18% would be almost evenly split.Footnote 2 Remarkably, although the PSID 1999–2009 has a much smaller sample size than the ACS 2009, its tabulation closely matches the Census one.Footnote 3
Matching patterns by race

Notes: Recently married couples (⩽4 years), both spouses aged 23–50 years. Sampling weights are used.
The marriage market literature has traditionally focused on socioeconomic indicators, such as education or wage [e.g., Qian (Reference Qian1998)]. Recent studies have also highlighted the role of physical characteristics, such as body mass index,Footnote 4 in understanding matching patterns [e.g., Ali et al. (Reference Ali, Rizzo, Amialchuk and Heiland2014); Averett and Korenman (Reference Averett and Korenman1996); Chiappori, Oreffice and Quintana-Domeque (Reference Chiappori, Oreffice and Quintana-Domeque2012); Oreffice and Quintana-Domeque (Reference Oreffice and Quintana-Domeque2010)]. However, no attempt has been developed to incorporate such dimensions in the analysis of inter-racial marriages. Given the well-known large disparities in black–white BMI distributions, in particular, for women [Johnston and Lee (Reference Johnston and Lee2011)], physical characteristics are likely to be relevant in the formation of black–white couples.
The goal of this paper is to document who inter-racially marries whom along physical and socioeconomic attributes of blacks and whites in the US. In particular, using PSID data from 1999 to 2009, which contain not only socioeconomic characteristics but also anthropometric information for both spouses, we establish the following set of stylized facts. First, we uncover that, among black women, those who marry a white man are (on average) thinner and more educated. Conversely, white women who inter-marry are (on average) fatter and less educated than those who intra-marry. Second, among men, those who inter-marry tend to be poorer and thinner. As to spousal characteristics in inter-marriages, we find that the black men who inter-marry match with a wife who is more educated than the black wife that other similar black men marry, while for white men their black wife is thinner than the white wife the other white men match with. Those women who inter-marry face thinner but poorer mates than the women who marry within their racial group. Finally, among black women, those who remain single are fatter and less educated. Instead single white women tend to be more educated than those who inter-marry.
As illustrated in the seminal work by Becker (Reference Becker1991), race is definitely a relevant aspect in the marriage market. However, only few economic studies have been devoted to analyze inter-racial marriages. Wong (Reference Wong2003) considers black husband–white wife couples and their socioeconomic status, also using PSID data, for the waves 1968–1997. She estimates a structural model with search costs where an individual’s quality in the marriage market depends on education and race, assuming away relevant observed differences in the distribution of characteristics by race and gender. Her explanation for the low prevalence of the inter-marriages of black men and white women is whites’ distaste to marry outside own race, rather than the racial income gap or lack of meeting opportunities. More recently, Fryer (Reference Fryer2007) describes the increasing trends in inter-racial marriages over the 20th century using Census data, considering regional variation and socioeconomic determinants, suggesting that equilibrium sorting and higher socioeconomic characteristics can explain inter-marriage in the presence of an “inter-marriage cost”.
Grossbard, Giménez and Molina (Reference Grossbard, Nadal and Molina2014) link racial discrimination to household chores with US time use data (ATUS), showing that in inter-racial couples, the black spouse provides more hours of housework due to discrimination. In addition, there is a body of research focusing on the black marriage market linking unfavorable sex-ratio imbalances for black women to family, marital, and labor market outcomes [e.g., Banks (Reference Banks2011); Charles and Luoh (Reference Charles and Luoh2010); Neal (Reference Neal2004); Seitz (Reference Seitz2009)]. Finally, in sociology, Kalmijn (Reference Kalmijn1993) emphasizes that better economic conditions of black men are associated to a higher rate of inter-racial marriages, while Fu (Reference Fu2001) explicitly refers to a “racial status hierarchy” to explain the rare crossing of racial boundaries in marriages, showing how higher education of the minority spouse makes inter-racial marriages happen, through a “social status exchange” [Fu and Heaton (Reference Fu and Heaton2008); Merton (Reference Merton1941); Qian and Lichter (Reference Qian and Lichter2007); Spanier and Glick (Reference Spanier and Glick1980)].
Are our findings consistent with the “social status exchange” hypothesis? We find that white women who marry black men tend to be fatter and less educated than white women who marry white men. This is consistent with the “status exchange” hypothesis. Black men who marry white women tend to be poorer than black men who marry black women. This is not consistent with the “status exchange” hypothesis. However, black men who marry white women tend to be thinner than black men who marry black women. Since lower BMI increases attractiveness for both men and women in the marriage market [at least among white individuals, e.g., Chiappori et al. (Reference Chiappori, Oreffice and Quintana-Domeque2012)], if thinness in a (black) man is perceived as a quality by a (white) woman, this would be consistent with the “exchange” hypothesis in terms of lower body weight. Finally, white men who marry black women tend to be poorer than white men who marry white women, and black women who marry white men tend to be thinner and more educated than black women who marry black men. These patterns are consistent with the “status exchange” hypothesis.
Perhaps, the studies most related to our work are those of Hitsch, Hortaçsu and Ariely (Reference Hitsch, Hortaçsu and Ariely2010), and Fisman, Iyengar, Kamenica, and Somonson (Reference Fisman, Iyengar, Kamenica and Simonson2006, Reference Fisman, Iyengar, Kamenica and Simonson2008). These authors consider several mate characteristics including race and non-socioeconomic attributes, the former also providing anthropometric information, and state that women exhibit strong same-race preferences in dating, and that this dating pattern cannot be explained by education or income differences. However, they work with online and speed dating, respectively, so that they lack the relevant information on the matches and families actually formed in the marriage market. Finally, Baccara et al. (Reference Baccara, Collard-Wexler, Felli and Yariv2014) provide an innovative analysis of matching in the adoption market documenting preferences against black children by prospective adoptive parents in the US.
The main message of the present paper is that measurable differences in both socioeconomic and physical attractiveness across groups are important in explaining the observed matches. We believe that this represents a necessary step in building a comprehensive understanding of two still open questions: Why so few inter-racial marriages are observed? And, perhaps more importantly, why do we find an asymmetry in the prevalence of inter-marriages depending on whether the husband or the wife is black?
The paper is organized as follows. Section 2 describes the data. Section 3 provides the main empirical results. Section 4 considers some extensions. Finally, Section 5 concludes.
2. DATA DESCRIPTION
The PSID is a longitudinal household survey collecting a wide range of individual and household demographic, income, and labor-market variables. In addition, since 1999, the PSID provides the weights (in pounds) and heights (in feet and inches) of both household heads and wives, which we use to calculate the BMI of each spouse, defined as an individual’s body weight (in kilograms) divided by the square of his or her height (in meters).Footnote 5
In each of the survey years under consideration, the PSID comprises about 4,500 married households. We select households with a household head and a wife where both are actually present. In our sample years, all the married heads with spouse present are males, so we refer to each couple as husband and wife, respectively. We confine our study to those couples where both spouses are between 23 and 50 years old, i.e., prime-age couples. Our analysis incorporates spouses with working husbands, so that we include couples with both working and non-working wives. We focus on men and women whose BMI lies between 18.5 and 35, thus excluding underweight and severe and morbid obese (obese class II and III) individuals [World Health Organization (2003)].Footnote 6
Because the PSID main files do not contain any direct question concerning the duration of the marriages, we rely on the “Marital History File: 1985–2009” Supplement of the PSID to obtain the year of marriage and number of marriages, to account for the duration of the couples’ current marriage. We merge this information to our main sample using the unique household and person identifiers provided by the PSID. We establish a threshold of less than or equal to 4 years of marriage, as a proxy for how recently a couple formed. This demographic group is particularly adequate for studying matching patterns, because the marriage market assessment of BMI (which changes over time) should arise through sorting at the time of the match. Clearly, the price to pay is a serious reduction in the sample size.
In the PSID, all the variables, including the information on the wife, are reported by the head of the household. Reed and Price (Reference Reed and Price1998) found that family proxy-respondents tend to overestimate heights and underestimate weights of their family members, so that family proxy-respondent estimates follow the same patterns as self-reported estimates. The authors suggest that the best proxy-respondents are those who are in frequent contact with the target. Since we are considering married couples, the best proxy-respondents are likely to be the spouses.Footnote 7
The other characteristics we use in our empirical analysis are age, log hourly wage, education, and race. Education is defined as the number of completed years of schooling and is top-coded at 17 for some completed graduate work. We consider only blacks and whites, where an individual’s race is determined according to the PSID variable “race first mention”. State dummy variables are included to capture constant differences in labor and marriage markets across geographical areas in the US, as well as geographical racial segregation [Cutler, Glaeaser, and Vigdor (Reference Cutler, Glaeser and Vigdor1999)]. Year fixed effects are also included.
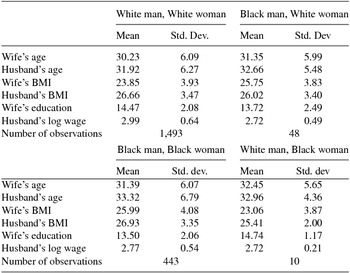
The main characteristics of the four types of couples in our sample are described in Table 2. Among same-race couples, the mean age difference between spouses is about 2 years [Chiappori, Iyigun, and Weiss (Reference Chiappori, Iyigun and Weiss2009)], although we note that white couples are younger. This reflects the fact that age at first marriage is higher for blacks than for whites [e.g., DaVanzo and Rahman (Reference DaVanzo and Rahman1993)]. In “mixed” couples with a white woman the age gap is around 1.5 years, while in those with a black woman the gap falls to half a year.
Descriptive statistics by type of couple

Notes: Sampling weights are used.
Looking at education, white women in white couples have on average 14.5 years of education, while black women in black couples have 1 year less. Interestingly, these magnitudes and the corresponding gap are reversed when comparing black with white women in “mixed” couples. A quick inspection of wages reveals the well-known white–black wage gap [e.g., Western and Pettit (Reference Western and Pettit2005)]. Within same-race couples, the average hourly wage of whites is 22% higher than that of blacks. However, we do not find a wage gap between blacks and whites in “mixed” couples.
As to weight, male BMI is on average larger than female: White women are, on average, in the normal-weight range (18.5 ⩽ BMI < 25), around 24 if they are married to a white man, and overweight (25 ⩽ BMI < 30), around 26, otherwise. Black women are on average overweight, around 26, if married to a black man, and in the normal-weight range, around 23, when married to a white man. Men are overweight in all the four types of couples. A salient feature is that while on average a black man married to a white woman is poorer than his white counterpart, he is nevertheless thinner. Conversely, on average, his white wife is fatter and less educated than the white woman who married a white man. Comparing black couples to white husband–black wife ones, one can see that on average the inter-married black women are thinner and more educated that those who intra-marry, while their white husbands are thinner and poorer than the black ones.
We also inquire about how the distributions of BMI and years of education (wages) of married men and women compare between blacks and whites. We first compute the raw correlation between education (log wage) and BMI, for both blacks and whites, by gender. The correlation is negative for women: − 0.14 (p-value < 0.01) for both blacks and whites. Interestingly, the correlation is virtually zero for white men (0.03, p-value = 0.20), and positive for black men (0.10, p-value < 0.05). These estimates are in line with previous studies, confirming the existing heterogeneity in the BMI–SES relationship by gender and race [e.g., Houle (Reference Houle2010)].
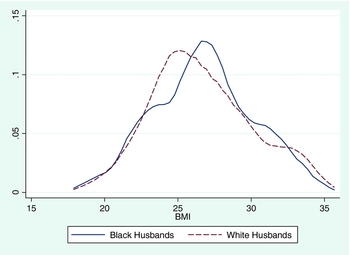
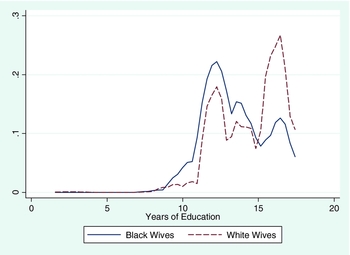
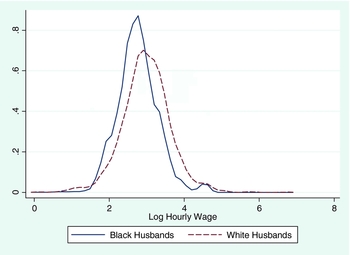
Figure 1 plots the densities of the BMI distributions for black and white women: Blacks have a right-shifted BMI distribution relative to whites [Houle (Reference Card and Rothstein2010)], which is consistent with the findings in the literature that the distributions of BMI and waist-to-height ratio for black women lie to the right of those of white women, and that they exhibit more density at higher values [e.g., Johnston and Lee (Reference Johnston and Lee2011)]. Indeed, black women exhibit higher BMI than whites also after controlling for differences in socioeconomic attributes [e.g., Burke and Heiland (Reference Burke and Heiland2008)]. In Figure 2, we plot the BMI densities for black and white males: The distributions look more similar and symmetric around their respective means than those for females. In Figures 3 and 4, we explore the distributions of years of education and log(wage). White women are more likely than black women to have 16 or more years of education. Similarly, white men are (in general) more likely to earn higher (log)wages than black men.
BMI distributions of married women: Black and White.

BMI distributions of married men: Black and White.

Education distributions of married women: Black and White.

Log Wage distributions of married men: Black and White.

The most natural socioeconomic indicator is probably wage; not only does wage directly measure a person’s ability to generate income from a given amount of input (labor supply), but it is also strongly correlated with other measures of socioeconomic attractiveness, such as prestige or social status. However, it is only observed for people who actually work. This is a relatively minor issue for men, since their participation rate, at least in the age category 23–50 years, is close to one; but it may be a serious problem for women. One solution could be to estimate a potential wage for non-working women as in Wong (Reference Wong2003), the drawback of this strategy being to introduce an additional layer of measurement error. In practice, however, potential wages are predicted from a small number of variables: age, education, number of children, and various interactions of these (plus typically time and geographical dummy variables). In addition, female education may also capture ability to produce quality household goods, which is likely to be valued by men. We use education as a proxy for female socioeconomic attractiveness, as for instance in Chiappori et al. (Reference Chiappori, Oreffice and Quintana-Domeque2012), who show that among white couples, men (women) prefer educated (rich) partners.Footnote 8
Regarding physical characteristics, there exists a considerable literature in which body mass index is widely used as a proxy for socially defined physical attractiveness [e.g., Gregory and Rhum (Reference Gregory and Ruhm2011)]. For instance, Rooth (Reference Rooth2009) found that photos that were manipulated to make a person of normal weight appear to be obese caused a change in the viewer’s perception, from attractive to unattractive. More recently, Oreffice and Quintana-Domeque (Reference Neal2016) show that BMI strongly contributes to male and female attractiveness when attractiveness is rated by opposite-sex interviewers. In their analysis of white couples, Chiappori et al. (Reference Chiappori, Oreffice and Quintana-Domeque2012) find that both men and women prefer thinner partners.Footnote 9 Therefore, we think of BMI as a measure of physical attractiveness. In principle, we would expect that an individual’s socioeconomic attractiveness positively depends on her wage or education, regardless of her race. However, this may not be the case for physical attractiveness. In particular, experiences of beauty and aesthetic standards may vary by gender and race [e.g., Wolf (Reference Wolf1992); Banks (Reference Banks2000); Craig (Reference Craig2006)]. We thus remain agnostic as whether blacks prefer a thinner or a fatter partner.Footnote 10
3. ESTIMATING MATCHING PATTERNS ACROSS SOCIOECONOMIC, ANTHROPOMETRIC, AND RACIAL DIMENSIONS
3.1. Who Does Inter-marry?
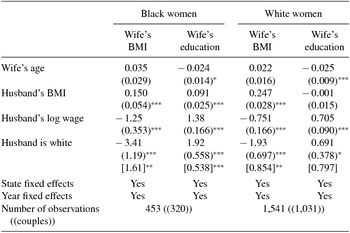
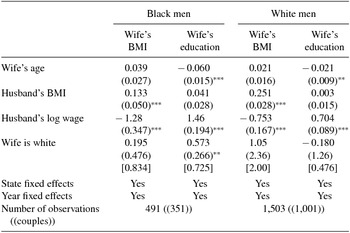
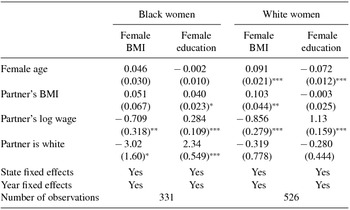
Table 3 displays the estimates corresponding to simultaneous regressions of female BMI and education on a spousal race indicator (1 if white, 0 if black) controlling for own age, spousal log wage, spousal BMI, and state and year fixed effects, for black women, on the left, and white women, on the right.
Simultaneous regressions: Wife’s characteristics on husband’s characteristics

Notes: Standard errors in parentheses. Robust standard errors clustered at the couple level from individual regressions in brackets. Sampling weights are used. *** Significant at the 1% level. ** Significant at the 5% level. * Significant at the 10% level.
Among black women, those who marry black men are (on average) fatter and less educated than those who marry white men. Similarly, white women who marry black men are (on average) fatter and less educated than those who marry white men. The higher socioeconomic status of the black woman in inter-racial marriages is consistent with the “status exchange” explanation given by sociologists [e.g., Fu (Reference Fu2001); Qian and Lichter (Reference Qian and Lichter2007)]. The corresponding magnitudes are large, indicating differences of 2–3 BMI units, and 0.7–2 years of education between the inter- and the intra-married women.
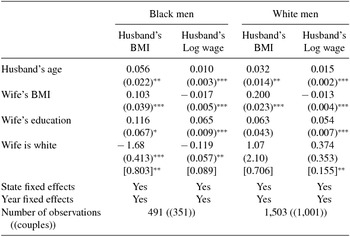
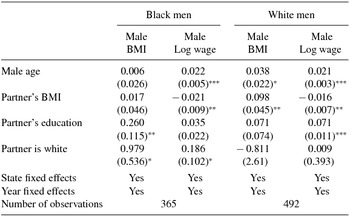
Table 4 contains the corresponding estimates of the simultaneous regressions of husbands’ characteristics on their wives’. The panel on the left shows that, among black men, those who marry white wives are (on average) thinner and poorer. Hence, black men who inter-marry are (on average) of lower socioeconomic status within their group, and they have a lower BMI. This is not consistent with the “status exchange” explanation given by sociologists [e.g., Fu (Reference Fu2001); Qian and Lichter (Reference Qian and Lichter2007)], unless the “exchange” happens in terms of lower body weight. When looking at white men, we find that those who marry white females are (on average) heavier and richer, if anything, albeit the results on BMI are not statistically significant. Thus, white men who marry black women are (on average) of lower socioeconomic status within their group. In the male population as well, these differences are large, corresponding to 1–1.5 units of BMI and 12–37% in wage.
Simultaneous regressions: Husband’s characteristics on wife’s characteristics

Notes: Standard errors in parentheses. Robust standard errors clustered at the couple level from individual regressions in brackets. Sampling weights are used. *** Significant at the 1% level. ** Significant at the 5% level. * Significant at the 10% level.
Inter-racial matches may be rare simply because members of different races interact relatively infrequently as rates of inter-racial marriage capture both preferences and sociogeographic segregation. However, weak social interaction between blacks and whites would lead to the highest educated black women matching with the highest educated white men if, for example, they met in college, which is actually in contrast with our findings. On the other hand, these patterns are not obvious to rationalize in terms of racial prejudices against blacks, especially the fact that black men who inter-marry are poorer than the ones who intra-marry, unless (low educated) white women have strong preferences for thinner individuals, and therefore match with these black men. We address now the second question on inter-racial marriages: Whom do you inter-marry?
3.2. Comparing Spouses’ Characteristics by Race Given Individual “Quality”
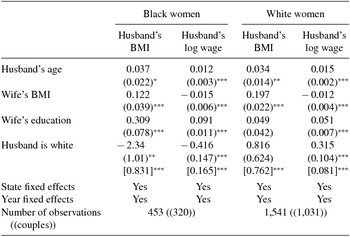
Suppose we have two women of the same race and with the same body mass index and education, one married to a black man and the other one to a white man. How do the characteristics of these men compare? We now address this question in Table 5 – for black women (panel on the left) and white women (panel on the right) – by running simultaneous regressions of husband’s BMI and log wage on a husband’s race indicator (1 if white, 0 if black), controlling for wife’s qualities (body mass index and education), husband’s age, year, and state fixed effects.
Simultaneous regressions: Husband’s characteristics on his race controlling for spousal quality

Notes: Standard errors in parentheses. Robust standard errors clustered at the couple level from individual regressions in brackets. Sampling weights are used. *** Significant at the 1% level. ** Significant at the 5% level. * Significant at the 10% level.
According to the estimates reported in Table 5, among those who marry black women, white men are (on average) poorer and thinner than black men (42% difference in wages and 2.3 BMI units). Moreover, among those who marry white women, black men are poorer and thinner than white men (32% and 0.8 BMI units), although the difference in BMI is not statistically significant. Performing a similar exercise for women, Table 6 reveals that, among those who marry black men, white women are (on average) more educated (by half a year) than black women. In addition, among those who marry white men, black women are (on average) thinner by one unit of BMI than white women, although the estimated coefficient is not statistically significant at conventional levels.
Simultaneous regressions: Wife’s characteristics on her race controlling for spousal quality

Notes: Standard errors in parentheses. Robust standard errors clustered at the couple level from individual regressions in brackets. Sampling weights are used. *** Significant at the 1% level. ** Significant at the 5% level. * Significant at the 10% level.
To summarize:
-
• Black women who marry white men tend to be thinner and more educated than black women who marry black men.
-
• White men who marry black women tend to be poorer than white men who marry white women.
-
• White women who marry black men tend to be fatter and less educated than white women who marry white men.
-
• Black men who marry white women tend to be thinner and poorer than black men who marry black women.
-
• Controlling for women’s BMI and education, black women of white men tend to have heavier and richer husbands than those married to black men.
-
• Controlling for women’s BMI and education, white women of black men tend to have thinner and poorer husbands than those married to white men.
3.3. Never-Married, Intra-Married, or Inter-Married?
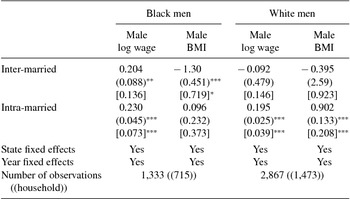
We now investigate whether there are differences by gender and race in terms of who remains single (defined as never married) rather than inter- or intra-marrying, and complement our analysis of who inter-marries and how it is perceived in the population.Footnote 11 We are interested in estimating whether those who inter-marry rather than remaining single are distinctively more or less “physically different” and of higher or lower socioeconomic status, in an attempt to understand the average perception of inter-racial marriages, accounting for the fact that the outside option of remaining single is always available.
Table 7 presents the estimates from seemingly unrelated regressions of male BMI and log wage on individual age, state, and year fixed effects, and two dummy variables for being inter- or intra-married, where the reference category is being never-married, for black men on the left and white men on the right. The estimated coefficients show that black men who remain single are 20% poorer than those who marry. Regarding physical characteristics, black men who inter-marry are thinner than those who intra-marry or remain single. The patterns for white men are different. White men who intra-marry tend to be richer than those who inter-marry or remain single. They tend to have a higher BMI than those who inter-marry or remain single.
Simultaneous regressions: Male characteristics on inter-married and intra-married indicators

Notes: Standard errors in parentheses. Robust standard errors clustered at the household level from individual regressions in brackets. Sampling weights are used. *** Significant at the 1% level. ** Significant at the 5% level. * Significant at the 10% level.
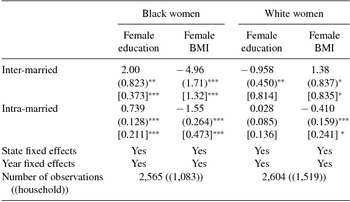
Table 8 shows that those women who remain single are fatter and less educated than any other married woman in the black population, whereas single white women are thinner and more educated than those who inter-marry. Black women who inter-marry are those on the “bottom” and the “top” of their BMI and education distributions, respectively, exhibiting a difference of almost 2 years of schooling and five BMI units with respect to the never married women, who are confirmed to be those at the bottom of the distribution of black women, consistently with the unfavorable sex ratio they face.
Simultaneous regressions: Female characteristics on inter-married and intra-married indicators

Notes: Standard errors in parentheses. Robust standard errors clustered at the household level from individual regressions in brackets. Sampling weights are used. *** Significant at the 1% level. ** Significant at the 5% level. * Significant at the 10% level.
3.4. Discussion
The evidence presented above allows us to establish the following stylized facts. Among black women, the thinner and the more educated are those who marry a white man. Conversely, the white women who inter-marry are the fatter and the less educated in their racial group. The striking racial differences among women significantly hold in both the physical and the socioeconomic dimensions, and may indicate that black women need to provide top “qualities” to achieve an inter-racial marriage, or that this specific type of women value white husbands, while for white women an inter-racial marriage may be the least desirable outcome.
As to spousal characteristics in inter-marriages, we find that the black men who inter-marry match with a wife who is more educated than the black wife married to other similar black men, while for white men their black wife is thinner than the white wife the other white men match with. These results seem to suggest that black men may be more eager to inter-marriage than women. The opposite, however, seems true for white men: Not only are they less likely to marry a black woman, but when they do she must be of higher “quality” than the white wife one would expect them to marry.
In the female population, on average, the lower “quality” (fatter and less educated) women marry within race. For black males, those richer and fatter marry within the same race group, while those poorer but thinner inter-marry. This may be compatible with black men having same race-preferences rather than preferring white partners, given that those who inter-marry are those of lower socioeconomic quality.
Given the unfavorable sex-ratio imbalance that black women face, one may expect to find more white man–black woman than white woman–black man marriages. In contrast, the observed differences in socioeconomic and physical characteristics may explain the higher prevalence of white woman–black man than white man–black woman marriages. There may be more fat and low-educated white women than thin and educated black women, the former being more amenable to accept poorer black spouses than top “quality” black women. Black men in particular “benefit” from inter-marriage by matching with a more educated spouse, so that they may be willing to inter-marry more than white men, who do not “gain” in their wife’s socioeconomic status. Finally, it is interesting to compare this evidence to the economic studies analyzing multiple attributes in mates, including race. Hitsch et al. (Reference Hitsch, Hortaçsu and Ariely2010) and Fisman et al. (Reference Fisman, Iyengar, Kamenica and Simonson2008) emphasize that in speed dating women exhibit strong racial preferences. Our evidence from the marriage market does not reflect any in-group racial preferences, at least for black women, as those who inter-marry are high “quality” types. White women, instead, may reflect the preferences found in the speed dating experiment, although our results are not directly comparable as men and women may behave differently when choosing “sexual” rather than “life” partners.
4. EXTENSIONS
4.1. Cohabitation Rather than Marriage
One may wonder whether the rare prevalence of black woman–white man couples is only found in marriages but not among cohabiting unions. Table A2 shows that this is not the case.Footnote 12 If anything, the prevalence of this type of couples is still below 1%, while the percentages of the other inter-racial and black–black couples are higher among cohabitants than among married individuals. Black women are rarely matched to white men, no matter the type of relationship.
Results on the sorting patterns by BMI and socioeconomic status in cohabiting unions are reported in Tables A3 and A4. We find that the black women with a white partner are still higher educated and thinner, while the white women in inter-racial relationships are neither fatter nor less educated than the other white female cohabitants, as instead it was the case among married white women. On the other hand, black men with a white partner tend to be richer than the black men who live with a black woman. In the US, cohabitation is seen as a surrogate of marriage or as an initial step toward it, so that these results may suggest that inter-racial unions are not frowned upon by white women, provided that those unions are not as binding as marriage. Instead, for black women, even cohabitation with a white man could be hard to achieve.
4.2. Controlling for Observed Heterogeneity
The following variables are considered to control for sources of observed heterogeneity: health status (1 if excellent, very good, or good; 0 if fair or poor); an individual dummy variable for being a smoker; number of children in the household under 18 years; recent pregnancy (previous 2 years); and height. Our results accounting for differences in these dimensions are very similar.
The exclusion of observations from the “immigrant sample” does not affect our results. This amounts to dropping 3.4% of observations in our married sample. Given the original purpose and set-up of the PSID survey, specific information on being Hispanic was not collected until the 2005 wave, so that excluding the sample that the PSID had added to incorporate immigrants who entered the US after 1968 is the only available way to include only non-Hispanic blacks and whites in our analysis.
Finally, we have investigated whether including obese class II individuals (35 ⩽ BMI < 40) affects our findings, obtaining very similar results.Footnote 13
4.3. The Relevance of Physical Characteristics
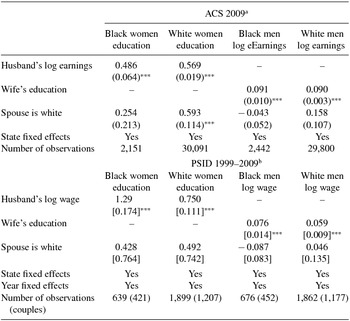
What is the relevance of physical characteristics in understanding matching patterns? To answer this question, we re-estimate the regressions of Tables 3 and 4 without BMI information using ACS 2009, on the one hand, and PSID 1999–2009, on the other. Table A5 highlights that BMI is crucial to understand who inter-marries whom: While the patterns in this table are very similar between data sets, including underweight (BMI < 18.5) or extremely obese (BMI ⩾ 40) individuals contaminates the estimated socioeconomic patterns. These results confirm the need of richer data sources to observe the inter-racial matches not only through the socioeconomic but also the anthropometric lens.
4.4. Additional Physical Characteristics
We run the same regressions as for BMI and socioeconomic status for height, as an additional anthropometric measure. This physical dimension may also be relevant in the marriage market [e.g., Herpin (Reference Herpin2005); Oreffice and Quintana-Domeque (Reference Oreffice and Quintana-Domeque2010); Sohn (Reference Sohn2015)]. Interestingly, in the black population, those women who inter-marry are on average almost 3 inches taller than the other married to black men. As to black men those with a white wife tend to be 1.4 inches taller than those who marry within their race. Results available upon request.
5. CONCLUSIONS
We estimate who inter-racially marries whom along physical and socioeconomic characteristics of black and white men and women in the US, showing that both their body mass index and their education (wage) matter in the formation of matches. Using PSID data from 1999–2009 and the Census ACS 2009 data, we establish several stylized facts on the characteristics of black and white men and women in these inter-racial unions, as compared to spouses in same-race marriages and to never-married individuals. We believe that this represents a necessary step in building a comprehensive understanding of two still open questions: Why so few inter-racial marriages are observed? And, perhaps more importantly, why do we find an asymmetry in the prevalence of inter-marriages depending on whether the husband or the wife is black?
APPENDIX
Matching patterns by race in newly-wed couples (⩽1 year), ACS 2009

Matching patterns by race in cohabiting unions, ACS 2009

Simultaneous regressions: Female characteristics on partner’s characteristics, cohabitants

Simultaneous regressions: Male characteristics on partner’s characteristics, cohabitants

Regressions of individual socioeconomic status on spousal characteristics