In order to understand why some ethnic groups launch a civil war, we need to answer the following questions: why are leaders of some groups willing to engage in a costly conflict against the state? How are they able to overcome collective action problems and forge powerful rebel groups? and why do citizens choose to leave their homes and join armed rebellion—an activity associated with enormous risks to personal safety? Although there is no shortage of answers to these questions in the civil war literature, most research focuses either exclusively on opportunity mechanisms (i.e., logistical and power-related arguments) (e.g., Fearon and Laitin Reference Fearon and Laitin2003; Collier and Hoeffler Reference Collier and Hoeffler2004) or on factors associated primarily with willingness (i.e., political and economic grievances) (e.g., Paige Reference Paige1975; Cederman, Wimmer and Min Reference Cederman, Wimmer and Min2010; Cederman, Weidmann and Gleditsch Reference Cederman, Weidmann and Gleditsch2011). In particular, the participation and rebel recruitment process—the key causal mechanism linking explanatory factors to conflict initiation—is often ignored or formulated in vague terms. In the early civil war literature, participation was the self-evident mechanism connecting various independent variables, such as economic inequality, to conflict (e.g., Russett Reference Russett1964; Huntington Reference Huntington1968; Gurr Reference Gurr1971; Paige Reference Paige1975). Since then, aside from few noteworthy exceptions (e.g., Wood Reference Wood2003; Weinstein Reference Weinstein2007), little has changed. Among today’s most frequently cited formal models of civil war onset (e.g., Fearon Reference Fearon1993; Powell Reference Powell2006), mobilization processes remain exogenous and most quantitative empirical research has failed to include variables directly linked to participation and rebel recruitment or relied on proxies plagued by problems of equifinality.Footnote 1
This paper examines why some ethnic groups rebel, focusing on both their leaders’ willingness to do so and their ability to mobilize and create a powerful rebel organization. It does so by distinguishing between different types of inequalities. Although political and economic inequalities between a country’s ethnic groups provide the necessary motives for ethnic elites and their followers, the level of economic inequality within groups affects the elites’ mobilization capacity. Leaders of ethnic groups with strong economic motives (wealthier or poorer than the average national group) and political motives (excluded from political power) have greater incentives to form rebel organizations and initiate conflict. The extent to which they are able to do so, however, depends on their group’s level of economic inequality. The greater the level of economic inequality within a group, the more concentrated the wealth within the hands of the elites and the greater the number of poor- and less-educated citizens, which loosens the mobilization constraint and enables willing leaders to mobilize a sufficient number of fighters to create a powerful rebel organization. Therefore, we expect the positive association between intra-group economic inequality and conflict initiation to be significantly larger if an ethnic group is excluded from power and/or is significantly better or worse off economically than the average ethnic group in that country.
As an illustrative example consider the onset of the 2002 civil war in the Ivory Coast.Footnote 2 Both the Baoulé and the alliance of northern ethnic groups, which formed the popular basis of Félix Houphouët-Boigny’s rule, were on average equally wealthy and had both suffered from the decline in production and the drop of world market price on cocoa—the Ivory Coast’s main export. In the 1990s, virgin forest land became scarce and the production cost associated with aging cocoa trees increased (Woods Reference Woods2003, 649–50). In addition, members of both ethnic groups had limited access to political power under the Gbagbo regime (2000–2010), a political opponent of Houphouët-Boigny. His agricultural policies tended to benefit his own ethnic group, the Bété, who until 1999 had been politically excluded. Using a definition of citizenship and identity that closely paralleled his own ethnic and regional identity (Collett Reference Collett2006, 621–6), he established that indigenous land could not be alienated from the community on a permanent basis, giving Bété the right to reclaim their land from members of other ethnic groups to which they had previously sold or given the land in return for their labor (Woods Reference Woods2003, 651). In this situation, existing theories of conflict initiation provide little guidance on whether the Baoulé or the northern alliance is more likely to launch a rebellion. Both groups feel economically disadvantaged and have limited political power. However, when taking into consideration the degree of economic inequality within each group, a clear prediction emerges. The Baoulé are considerably more equal than the northern ethnic groups, as most of them are farmers that own land suitable for cocoa production. In contrast, the northern ethnic groups live in the Savannah and herd cattle, goats, or sheep or work as seasonal workers on the cocoa plantations in the south. In addition, they face a large number of migrants from similar ethnic background arriving from Burkina Faso in search of work and a better life. Hence, based on our argument, it is no surprise that the northern ethnic alliance and not the Baoulé seized the opportunity provided by the disorder after the failed coup in September 2002 to gain control of the country.
In order to move beyond illustrative case studies and evaluate our predictions more systematically, we develop a spatial measurement approach of economic inequality. Following existing economic research that uses nightlights as a proxy of wealth (e.g., Hodler and Raschky Reference Hodler and Raschky2010; Henderson, Storeygard and Weil Reference Henderson, Storeygard and Weil2011), we combine geocoded data on ethnic settlement areas with high-resolution satellite imaginary of nightlights and population estimates to create the first global proxy of within-group inequality. We validate our measurement approach against existing measures of economic inequality at the country level and with geocoded survey data at the group level for Sub-Saharan Africa. We then add our proxy of intra-group economic inequality to an existing statistical model of conflict initiation and find considerable support for our theoretical predictions.
The paper offers several important insights for conflict research. First, it highlights the importance of unpacking the concept of economic inequality and shows that different types of economic inequality may affect conflict initiation in different ways. Although inter-group inequality affects the group elites’ motivation, intra-group inequality (IGI) affects their opportunity to fight via their ability to mobilize a sufficiently strong rebel army. Second, our findings suggest that these components of economic inequality interact in such a way that is not well captured by measures of overall economic inequality at the country level, offering an explanation for why previous quantitative studies using overall national inequality measures have failed to find significant correlations. Finally, this paper provides a possible explanation for why price and trade shocks do not seem to have a consistent impact on conflict initiation (e.g., Bazzi and Blattman Reference Bazzi and Blattman2011). Our finding suggests that the effect of these economic shocks will, among other things, depend on the underlying distribution of economic wealth, both between and within ethnic groups.
The remainder of the paper is organized as follows. The next section reviews and situates the paper within the previous literature on inequality and conflict. We then link the different types of inequalities theoretically to ethnic elites’ willingness and opportunity of conflict initiation. The fourth section presents our measurement approach and evaluates our measure of economic inequality against a variety of existing measures. The penultimate section discusses the data and our empirical research design, before we present and discuss our findings. Finally, we conclude and discuss some avenues for future research.
Inequality and Conflict
The connection between inequality and violence has long been at the center of conflict studies. Grounded theoretically in the writings by Plato, Marx, de Tocqueville, and others, the proponents of this relationship claim that unequal nations are more likely to experience political violence of various forms. The key concept linking inequality to conflict is relative deprivation, which captures the extent to which people’s expectations about what they should achieve exceeds their actual levels of achievement. Relative deprivation leads to frustration and aggression, which motivate individuals to participate in rebellion (Davies Reference Davies1962). The greater the level of relative deprivation, the stronger the motivational base for political violence, and the greater the magnitude of violence (Gurr Reference Gurr1971, 9).
Decades of subsequent empirical research on the inequality political conflict nexus have produced mixed results. Although political and economic grievances have been repeatedly linked to conflict processes in the qualitative literature on civil wars (e.g., Gurr Reference Gurr1971; Davies Reference Dhillon and Peralta1997; Sambanis Reference Sambanis2005), the plethora of quantitative studies (over 43 according to Lichbach Reference Lichbach1989) found no robust correlation between economic inequality and conflict (Midlarsky Reference Midlarsky1988; Lichbach Reference Lichbach1989). In fact, some of the most influential quantitative studies of civil war outright reject grievance-based explanations, based on the lack of a statistically significant correlation between country-level measures of individual wealth distributions and conflict (e.g., Fearon and Laitin Reference Fearon and Laitin2003; Collier and Hoeffler Reference Collier and Hoeffler2004). Most recently, however, several quantitative studies have emerged, showing that the previous quantitative literature’s failure to detect a robust connection between inequality and conflict is owing to inappropriate conceptualization and measurement problems rather than the lack of a relationship. Cederman, Wimmer and Min (Reference Cederman, Wimmer and Min2010), for example, argue that conflict processes between ethnic groups should not be studied at the country- but at the group level and show empirically that politically relevant ethnic groups excluded from power are significantly more likely to initiate a conflict. Moreover, Østby (Reference Østby2008), Stewart (Reference Stewart2009), and Cederman, Weidmann and Gleditsch (Reference Cederman, Weidmann and Gleditsch2011) provide robust quantitative evidence that horizontal economic inequality between ethnic groups, as compared with the previously used vertical measure of inequality between individuals, significantly increase the risk of conflict.
We expand this recent line of research that focuses on group-level factors to understand how economic inequality affects an ethnic group’s likelihood of initiating a conflict. Following Ellingsen (Reference Esteban and Ray2010), we argue that both opportunity and motivation are necessary for an ethnic group to engage in a civil war. Although greater levels of inter-group inequality contribute to a group’s willingness, higher IGI loosen the elites’ constraint to mobilize a sufficient number of fighters and create a powerful rebel organization. Hence, all else equal, while both inter- and intra-group inequality increase the likelihood of an ethnic group initiating a conflict, their combination seems to matter, leading to a much more precise empirically testable prediction: those ethnic groups with high levels of within-group inequality that are relatively poorer or richer than the average group or excluded from political power are most likely to launch a rebellion.
Although there is a rich literature on the motivational effects of inter-group inequality (e.g., Davies Reference Davies1962; Gurr Reference Gurr1971; Davies Reference Dhillon and Peralta1997; Cederman, Wimmer and Min Reference Cederman, Wimmer and Min2010; Cederman, Weidmann and Gleditsch Reference Cederman, Weidmann and Gleditsch2011), few studies look at the relationship between within-group economic inequality and conflict. The sparse research that does exist provides two opposing views on the association of IGI and conflict. The first focuses on identity formation as the basis for group mobilization, arguing that mobilization requires a common identity and a collective unifying structure among its members (Tilly Reference Tilly1978, 84). A high level of economic inequality within an ethnic group may create resentment, which undermines cohesiveness and the group’s ability to take collective action, as the different social classes within the group identify more closely with their counterparts in other ethnic groups, rather than identifying with the member of their own ethnicity but from a different social class (Stewart Reference Stewart2000). Related to this, Sambanis and Milanovic (Reference Sambanis and Milanovic2011) argue that intra-regional inequality will undermine mobilization, as any income gains from victory will have to be distributed among the population. Thus, an increase in economic inequality within an ethnic group should reduce the likelihood that this group rebels. The exact opposite view has come out of economic theories of rebel mobilization and conflict. Esteban and Ray (Reference Fearon2011) propose a model of ethnic conflict in which discriminatory government policy or social intolerance are responsible for various forms of ethnic activism, including violence. Mobilization is considered to be costly and militants need to be compensated accordingly. Allowing for both financial and human contributions to conflict, they show how an increase in within-group inequality weakens the rebel’s mobilization constraint by reducing the opportunity costs and simultaneously providing ethnic elites with greater monetary resources. Thus, rather than undermining group cohesion and mobilization, these models suggest that the emergence of economic and cultural elites are a crucial explanatory factor regarding conflict initiation. Similarly, Gates (Reference Gates2002) models the costs of recruitment and allegiance for rebel groups as a function of the outside options of payoffs for recruits. As IGI increases, outside payoffs decrease, which reduces the rebel’s recruitment costs.
This paper follows the second approach, but takes a broader theoretical perspective with regard to possible mechanisms through which IGI facilitates rebel mobilization. We argue that within-group inequality does not only lower the opportunity costs for voluntary participation and provides elites with greater wealth, but also lowers the costs associated with indoctrination. Our empirical results indicate that there is a positive robust association between IGI and conflict initiation, providing empirical support for the second view.
Empirical research on the relationship between within-group inequality and conflict is equally sparse. In a recent working paper, Huber and Mayoral (Reference Huber and Mayoral2012) look at the impact of different forms of economic inequality on conflict. Using over 200 individual-level surveys from 89 countries, they decompose overall economic inequality into between-group inequality, within-group inequality, and overlap at the country level (see Pyatt Reference Pyatt1976 on the decomposition of the Gini index). Consistent with grievance-based arguments, they find a positive relationship between inter-group inequality and conflict, but this finding rarely surpasses conventional levels of statistical significance. In line with the second theoretical view above, they find a strong, robust positive association between within-group inequality and civil war. Although their finding with regard to within-group inequality is qualitatively similar to ours, our empirical approach differs in two important aspects. First, rather than country year, our level of analysis is a group year, which we believe is the most appropriate to study the impact of within-group inequality on conflict initiation and follows conceptual innovations of previous research (e.g., Cederman, Wimmer and Min Reference Cederman, Wimmer and Min2010). Second, by using a country year as their unit of observation, Huber and Mayoral (Reference Huber and Mayoral2012) are forced to create an aggregate measure of within-group inequality across all ethnic groups of a country, risking aggregation bias (Signorino and Xiang Reference Signorino and Xiang2011). By performing a group-level analysis, we are able to avoid this risk, enter group-level economic inequality directly into the statistical model, and thereby ensure a tighter connection between theory and empirics. Finally, our empirical analysis suggests that the effect of within-group inequality on conflict initiation is conditional on the group’s political and economic status relative to other groups in a country. In their analysis, Huber and Mayoral (Reference Huber and Mayoral2012) only consider unconditional effects of the various Gini components, missing relevant interaction effects among the different types of economic inequality.
More closely related to our empirical research design are Østby, Nordås and Rød (Reference Østby, Nordås and Rød2009). They study the impact of socio-economic inequalities between and within subnational regions in 22 Sub-Saharan African countries. By combining geocoded responses from the Demographic and Health Survey (DHS) of the United States Agency for International Development (USAID) with geographical data on the location of conflict zones between 1986 and 2004, they find that conflict onset is more likely in regions with strong relative deprivation and strong intra-regional inequalities. Although we agree with them that country year is not the right unit of analysis, some aspects of their empirical approach remain problematic. First, they proxy ethnicity by region, which is far from ideal, as subnational regions are generally bad proxies for the ethnic group’s primary settlement area. By using geocoded ethnic settlement areas, our research design avoids this assumption. Second, they assess whether a correlation exists between the level of inequality among survey respondents in a subnational region and the risk of conflict in that region. We do not limit our research design in that way. Our dichotomous dependent variable takes the value 1 if a rebel group is involved in a conflict against the state on behalf of a certain ethnicity, independent from the location of both the ethnic group’s settlement region and the conflict zone. Finally, they ignore interactions among the different types of economic inequality, which we explicitly consider and find empirical evidence in support of.
Inequalities, Motivation, Mobilization, and Conflict Initiation
This section describes the mechanisms linking inter- and intra-group inequalities to an ethnic group’s risk of conflict initiation. We argue that both inter- and intra-group inequality are necessary for an ethnic group to rebel. Political or economic inequality between groups provide the necessary motivation for a group to consider initiating a conflict. Economic inequality within the underprivileged group determines the elites’ ability to mobilize a sufficiently large number of fighters in order to win the conflict. We therefore predict a conditional positive relationship between intra-group economic inequality and conflict initiation by an ethnic group: if and only if an ethnic group is excluded from power and/or significantly better or worse off economically relative to other groups do we expect a positive association between an ethnic group’s level of economic inequality and the likelihood of conflict initiation.Footnote 3 Below we first describe how inter-group inequalities affect a group’s willingness to rebel and thereafter how IGI affects the elite’s ability to create a sufficiently strong rebel group.
Inter-Group Inequality and Motivation
As indicated in the literature review, the main way in which inequality has been linked to conflict initiation has been through relative deprivation and grievances (e.g., Davies Reference Davies1962; Gurr Reference Gurr1971; Davies Reference Dhillon and Peralta1997) at both the individual and group level (e.g., Stewart Reference Stewart2009; Cederman, Weidmann and Gleditsch Reference Cederman, Weidmann and Gleditsch2011). Following this line of research, we argue that objective political and economic asymmetries between ethnic groups can be transformed into grievances through a process of group comparison driven by collective emotions, which provides the motivation to rebel.
Based on an extensive experimentally supported literature in social psychology, Cederman, Weidmann and Gleditsch (Reference Cederman, Weidmann and Gleditsch2011) provide a convincing mechanism through which inter-group inequalities are transformed into grievances. They argue that in the presence of salient group identities, members of the involved groups are prone to make social comparisons that hinge on the distinction between in-group and out-group categories, thereby linking inter-group asymmetries cognitively to their social identity. Any perceived violations of norms of justice and equality will then typically arouse feelings of anger and resentment among group members, which provides the necessary motivation to fight over scarce resources, such as economic wealth and political power (Cederman, Weidmann and Gleditsch Reference Cederman, Weidmann and Gleditsch2011, 481).
In order to see how different horizontal inequalities lead to conflict motivations, consider a polity with two or more economically unequal ethnic groups. Poorer groups, especially those residing in backward peripheral regions, often desire to break away from the core of their countries, because they perceive themselves to be systematically disadvantaged compared with wealthier groups in terms of economic development and the distribution of public goods. Although the costs of independence might be very high, these groups are often convinced that independence would significantly improve their relative economic standing (Horowitz Reference Horowitz1981). Similarly, the groups in comparatively wealthier parts of the country may also feel disadvantaged, especially if they believe that state-level redistribution denies them the fruits of their land. Those groups seek secession in order to avoid having to subsidize poorer groups (Horowitz Reference Horowitz1985, 249–50).
In addition to economic inequality, political inequality also provides ethnic groups with reasons to initiate conflict. Political exclusion contributes directly to a group’s willingness to rebel. As conflict is a costly action with an uncertain outcome, ethnic groups generally prefer to change policy from within the political process. Whether it is possible and to what extent they will succeed, depends on the group’s access to political power. Obviously, if the group controls power, it is free to implement its preferred policies. If the group is part of a ruling coalition, it will have to bargain, which they may prefer to conflict, depending on their bargaining position. However, if the group is excluded from power, the elites often have no other option than to rebel in order for the state to consider their political demands (Lacina Reference Lacina2011).
These arguments suggest that ethnic groups excluded from power and/or significantly better or worse off economically relative to other groups are more willing to engage in a costly conflict. Willingness to fight, however, is not enough. In order for a group to engage in conflict, it must form a sufficiently strong rebel group that is able to succeed on the battlefield. How IGI affects this effort is subject of the next subsection.
IGI and Rebel Mobilization
Rebel mobilization is generally discussed within the collective action framework (Lichbach Reference Lichbach1998).Footnote 4 This theoretical framework treats conflict victory as a public good, which provides individuals with strong incentives to free ride (i.e., abstain from participation), as anyone can partake in the spoils of victory, regardless of whether they fought with the rebels or not.Footnote 5 The solution to the free rider problem within the rational choice framework is selective incentives, which refers to gains that occur exclusively to those individuals taking part in the rebellion. Conceptually, the literature distinguishes between three types of selective incentives: material, social, and purposive. As we focus on ethnic conflict and in particular politically relevant ethnic groups,Footnote 6 we ignore social incentives as they are present within all groups and therefore cannot explain the difference in the probability of conflict initiation between them.
Material incentives
Of the different selective incentives, material incentives have received the most attention. Several economic models have been proposed, treating participation in a rebel organization as one employment option in the labor market. In these opportunity cost models rebel recruitment is therefore in competition with other employment options. Gates (Reference Gates2002), for example, sets the cost per fighter in direct relationship to expected wages on the regular labor market and Grossman (Reference Grossman1991) stresses the private returns to insurgents from fighting, such as booty taken in a successful insurrection. Hence, as IGI increases, the number of individuals that are unemployed and/or work in low-income jobs increases, lowering their opportunity costs and thereby increasing their likelihood of joining the rebels.
In a recent model, Esteban and Ray (Reference Fearon2011) study rebel mobilization in an ethnic group with income heterogeneity, offering a more nuanced account on how increasing income inequality within an ethnic group contributes to conflict. Allowing for both capital and labor contributions, they show that rich individuals will opt to pay rather than serve, as their income from regular labor exceeds the offered compensation rate for fighting, which rebel leaders set to maximize their probability of victory. Poor citizens, however, will choose to fight rather than pay, as their labor market income is smaller. In contrast to the opportunity cost models, where IGI merely affects the opportunity costs of joining the rebels, their argument highlights both sides of rising within-group inequality: as IGI increases, the opportunity costs of regular group members decreases, whereas at the same time the elites’ available income increases. Thus, as within-group inequality increases, elites cannot only mobilize more rebels at a given compensation rate, but also create larger rebel movements with the same proportion of income.
Several studies on the recruitment of Hutu rebels during Burundi’s civil war 1993–2005 provide strong empirical evidence in support of this causal mechanism. In a pilot survey of 350 ordinary civilian and “rank-and-file” former civil war combatants, Mvukiyehe, Samii and Taylor (Reference Mvukiyehe, Samii and Taylor2006) found that the vast majority (75 percent) of combatants participated freely, either seeking contact to the rebels themselves or being recruited in the village. The vast majority of them also expected some form of monetary benefit from participation, either in cash or kind. An empirically more sophisticated account of the opportunity cost mechanism in the rebel recruitment process is provided by Nillesen and Verwimp (Reference Nillesen and Verwimp2010). Instrumenting income short falls by insufficient rain, they provide strong empirical evidence that villages with above mean incidents of insufficient rain were significantly more likely to have experienced recruitment activities than others. They find similar results using recall information on recruitment in a 13-year panel data set. Moreover, in a related paper, Verwimp and Bundervoet (Reference Verwimp and Bundervoet2009) find that joining an armed rebel group was a lucrative decision: households of which at least one member joined an armed group experienced a 41 percent higher growth in welfare in the final years of the war (1999–2007).
So far we have focused on positive material incentives. Yet, as several studies—in particular with regard to child soldiers—point out, participation in rebellion might be coerced, that is, non-voluntary and thus the result of negative incentives (e.g., Humphreys and Weinstein Reference Humphreys and Weinstein2008; Andvig and Gates Reference Andvig and Gates2009; Beber and Blattman Reference Beber and Blattman2010). Recruiting individuals by force is not cheap. Aside from the costs of recruitment and retention, mobilization by force creates a particular third set of costs associated with shirking. As those recruits have not voluntarily joined the rebels, their willingness to fight is probably low, which limits the group’s battlefield performance. Moreover, forcing citizens to join them at gun point or abducting children carries high reputation costs with civil society. For all these reasons, mobilization by force is likely to be rare, especially at the initial stage of conflict, and more likely to be used by resource-poor rebel groups (Eck Reference Eck2008). In order to minimize the costs associated with coercive recruitment, rebels tend to employ this mobilization strategy at night in rural areas or slums outside of urban centers, where the state is weak or absent. Their ideal target is young, male, and poor, as they yield decent fighters and are relatively easy to control and manipulate (Humphreys and Weinstein Reference Humphreys and Weinstein2008; Beber and Blattman Reference Beber and Blattman2010). Poor citizens are less able to protect themselves or their loved ones from threats and abduction, they have less to gain from trying to escape, and they are often less educated and therefore easier to persuade and manipulate. Although we do not think that negative material incentives play a major role in the initial stage of rebel mobilization, we believe that an increase in within-group inequality weakens the constrains rebels face in recruitment by force. As within-group economic inequality increases, the proportion of poor increases, which expands the rebel’s reservoir of potential recruits. A larger candidate pool makes recruitment easier, reducing rebel mobilization costs. Macours (Reference Macours2010) provides some evidence in support of the positive link between within-group inequality and violent recruitment. By combining newspaper accounts of abductions with survey-based measures of district-level economic inequality, she finds that Maoist insurgents in the Nepalese civil war appear to have targeted the districts with the fastest recent growth in income inequality for violent recruitment during the later stages of the conflict. Thus, as with positive material incentives, we expect a positive association between within-group inequality and rebel mobilization through the use of force, although possibly to a smaller degree.
Purposive incentives
Within the collective action framework, scholars have also discussed so-called purposive incentives, which are usually conceptualized as internalized norms and values in which the person’s self-esteem depends on doing the right thing (Oliver Reference Oliver1993).Footnote 7 To date, this type of incentive has received relatively little attention in the conflict literature. Prominent exceptions are Scott (Reference Scott1976) and Wood (Reference Wood2003), who argue that moral outrage led people to rebel against relative deprivation during economic modernization in South Asia and government abuses in El Salvador, respectively. In their view, emotional and moral motives were essential to the emergence and consolidation of collective action. Peasants joined the rebellion not for material or social benefits, but “because they took pride, indeed pleasure, in the successful assertion of their interests and identity” (Wood Reference Wood2003, 18).Footnote 8
These emotional and moral motives to join a rebellion may pre-exist and increase as higher levels of IGI strengthens existing grievances, but can also be created and fostered by ethnic elites. Wood (Reference Wood2003), for example, points out that many of the peasants fighting in the rebellion had previously participated in a social movement calling for economic reform and political inclusion, through which they had become convinced that social justice was God’s will and that acting righteously was to participate in the rebellion. In a different study, Eck (Reference Ellingsen2012) argues that one of the key strategies used by the Communist Party of Nepal-Maoist (CPN-M) was indoctrination. According to her research, the Maoists spent up to a year before the conflict sending so-called political–cultural teams into villages to educate the masses on their aims and the necessity of using armed force to achieve political change. This campaign had a powerful effect on rural villagers, who were not accustomed to being addressed with respect by individuals in positions of power. By addressing the villagers, discussing their problems, showing how the CPN-M’s agenda may support their goals, and requesting their assistance, the Maoist’s encouraged the villagers to be active political agents, a radical departure from the villagers’ previous experiences of marginalization. Moreover, the Maoists’ ideology was especially appealing to rural individuals as it matched well with their own local agendas and grievances, providing them with the emotional and moral motives to join the rebellion.
As in the case of material incentives, an increase in intra-group economic inequality is associated with a decrease in the elite’s mobilization efforts via purposive incentives. Providing the emotional and moral motives for an individual to fight on behalf of a rebel group requires an extensive propaganda and educational effort on behalf of the ethnic elites. Whether indoctrination and propaganda work and how much effort it takes to create and foster such motives in support of the rebel movement depends on the amenability and moldability of the recipients. Research in political communication and public opinion has shown that beliefs of less-knowledgeable and less-informed individuals are more susceptible to rhetoric, propaganda, and indoctrination (e.g., McGuire Reference McGuire1969; MacKuen Reference MacKuen1984; Geddes and Zaller Reference Geddes and Zaller1989; Iyengar and Simon Reference Iyengar and Simon2000). Those individuals are on average less well educated and are economically worse off than their better-informed peers. As economic inequality and educational inequality are positively correlated (e.g., Castelló and Doménech Reference Castelló and Doménech2002), greater IGI and higher educational inequality raises the number of people with few economic opportunities and little formal education. This increases the effectiveness of a given level of indoctrination, which in turn lowers the elite’s mobilization efforts.
Hypotheses
Combining our arguments on the impact of economic and political inter-group inequalities on the group’s willingness and the effect of economic IGI on the elite’s mobilization potential yields the following two hypotheses:
Hypothesis 1 All else equal, we expect both inter-group political and economic inequality and intra-group economic inequality to increase the likelihood of an ethnic group’s involvement in conflict.
Hypothesis 2 We expect the relationship between an ethnic group’s level of economic inequality and the likelihood of conflict to be particularly strong for those groups that are excluded from power and/or significantly better or worse off economically relative to other groups.
Measuring Within-Group Economic Inequality
Our analysis requires estimates of IGI at the level of ethnic groups, which are difficult to obtain. In this section, we introduce a new way to measure IGI using nightlight emissions. We first describe the data sources and the computation of the new measure, and then present our attempts to validate it.
Using Nightlight Emissions to Measure Inequality
Most indicators of IGI such as the frequently used Gini coefficient rely on survey data. Survey-based inequality estimation is typically applied at the national level, where income (or consumption) scores of a national sample of respondents are aggregated to obtain an estimate of within-country inequality. Although this approach is not without problems (e.g., surveys measure income differently, which impedes cross-national comparisons), the main requirement, a large enough sample of respondents that is representative at the national level, applies in most cases. This is different when we move the level of analysis down to the group. Few surveys start with a country’s list of groups, and then create representative samples for each of them. If surveys include ethnic categories, they do so by relying on a respondent’s self-reported membership in a group. Not only does this procedure fail to ensure representativeness at the group level (rather, we have to assume it), it also makes it difficult to aggregate estimates at the group level, as self-reported categories may differ even if individuals are from the same group.
For these reasons, we resort to a different way of obtaining IGI estimates, but use survey data to validate our new measure (see below). Similar to Cederman, Weidmann and Gleditsch (Reference Cederman, Weidmann and Gleditsch2011), we use a spatial procedure to measure variation in wealth among the members of a group. The general idea of this procedure is to combine maps of economic activity with those about the settlement regions of ethnic groups. By finding out if group regions coincide with locations of high or low economic activity, Cederman, Weidmann and Gleditsch (Reference Cederman, Weidmann and Gleditsch2011) are able to compute wealth estimates at the group level, which are then used to determine the group’s relative economic status in the country. Although our procedure largely follows this approach and relies on similar types of geographic data, the fact that we are examining within-group rather than between-group variation requires us to adapt the earlier procedure. The economic maps used in Cederman, Weidmann and Gleditsch (Reference Cederman, Weidmann and Gleditsch2011) are based on the G-Econ data set (Nordhaus Reference Nordhaus2006). G-Econ maps economic activity at the level of grid cells of size 1×1°, which corresponds to about 110×110 km at the equator. G-Econ picks up variation between these cells, but obviously not within. With many group regions being covered by only one or a few G-Econ cells, we would not be able to capture within-group variation at a sufficiently detailed level.
The requirement of fine-grained economic data leads us to abandon G-Econ in favor of another type of data with high resolution, but a less perfect match to the concept we want to measure: nightlight emissions. The amount of light radiating out from a particular location on earth can be measured by satellites with extremely high spatial precision. We use data from the Defense Meteorological Satellite Program (DMSP), which are available at a 30 arc-minute resolution (~1 km at the equator). The US National Geophysical Data Center archives and cleans the data, and makes them available for download. In particular, the data have cloud covers and unsteady sources of light (such as fires) removed, and only contain stable emissions.Footnote 9 We use the first available year (1992) for our computation. For data on ethnic settlement regions, we use the GeoEPR data set (Wucherpfennig et al. Reference Wucherpfennig, Weidmann, Girardin, Cederman and Wimmer2011), which is compatible with the group list from the Ethnic Power Relations (EPR) data set (Cederman, Wimmer and Min Reference Cederman, Wimmer and Min2010). In short, our procedure for calculating IGI works as follows:
-
1. divide up the geographic space into small cells of equal size (1/12 of a degree, about 10 km);
-
2. for each raster cell, compute (i) the total nightlight emissions from the DMSP-OLS data, and (ii) the total population using the LandScan high-resolution data set (Oak Ridge National Laboratory 2008)Footnote 10 ;
-
3. for each raster cell, compute the cell wealth as nightlights per capita;
-
4. after ordering all cells in a given group’s settlement region by per capita wealth, compute the Gini coefficient.
Based on this procedure, we end up with inequality measures at the group level, ranging from 0.05 (very little inequality) to 1 (perfect inequality). In the next section, we discuss potential problems associated with the measure, and present our attempts to validate it.
Validating the New Measure
As our approach is a new attempt to measure economic inequality, we need to take a closer look at its validity. There are two potential sources of error. First, nightlights may not be a good proxy for economic wealth at the individual level. This may be (i) because nightlights could be a poor proxy for economic wealth in general or (ii) because the satellite image is unable to distinguish between individuals of different incomes at a given location. The first concern is somehow alleviated by the finding that light emissions correlate highly with economic performance. Henderson, Storeygard and Weil (Reference Henderson, Storeygard and Weil2011) use nightlight emissions and their changes over time to measure national-level economic growth and find that they serve the purpose relatively well, in particular in regions where other, more accurate measurements are difficult to get (see also Chen and Nordhaus Reference Chen and Nordhaus2011). Still, at the subnational level, nightlight emissions could be driven by state-sponsored development and electrification (Min Reference Min2010), which would be problematic for our approach that relies on subnational variation on light emissions.Footnote 11 The second concern results from the fact that our inequality indicator captures variation in light emissions between larger cells, rather than variation between individuals. By assigning everybody living in a particular cell to have that cell’s wealth level, we may be unable to capture considerable variation in wealth that exists, for example, among people living an urban environment. We try to gauge the magnitude of this error by computing country-level inequality estimates based on nightlights, and validating them against conventional, survey-based indicators. These fairly reliable, frequently used country-level estimates are able to tell us whether the nightlights-based indicator is able to pick up variation in inequality at the country level.
The second source of error is related to our procedure of approximating group settlement regions with polygons. Using the GeoEPR data set as described above, everybody living within one of these polygons is assigned to a particular group. Again, urban areas with a high degree of ethnic mixing would be particularly prone to errors, as our data is unable to capture variation in ethnic groups at a particular location. In a second validation exercise, we assess the extent to which GeoEPR group regions correspond with individual-level data on ethnicity obtained from surveys. If both of these tests are successful, we should be optimistic about our indicator: if nightlights can pick up inequality for large areas such as countries (first validation), and at the same time the GeoEPR group regions are accurately measured (second validation), we should also be able to use the nightlights measure for group regions. Finally, we conduct a comparison at the group level between survey-based Gini coefficients and those obtained from nightlights. Owing to the inherent difficulties in estimating inequality from the surveys, however, these results need to be taken with a grain of salt.
Validation using national-level Gini coefficients
Conventional Gini coefficients are typically computed at the national level and aim to measure inequality among a country’s citizens. With a slight modification, we can use our procedure introduced above to produce national level, rather than group level, estimates of inequality: instead of computing the Gini coefficient across all cells in a group region (step 4), we calculate the Gini across all cells in a country, and thus obtain a spatial inequality indicator at the national level. This indicator can then be compared with existing survey-based indicators. For the validation exercise, we compute spatial inequality estimates for 1992 and compare them with Gini values from the World Inequality Indicator Database (WIID) (World Institute for Development Economics Research 2008) for roughly the same time period.Footnote 12
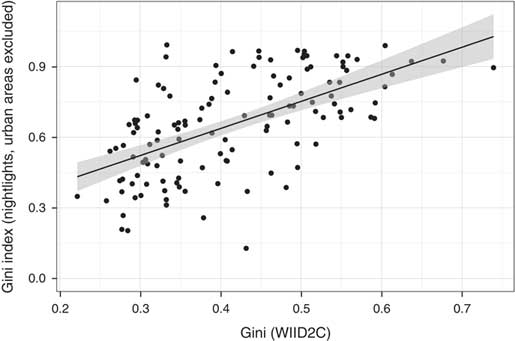
The correlation between the raw values of the WIID estimates and our spatial ones is 0.51 (p=0.00), which suggests that the latter pick up much of what the survey-based Gini coefficient measures. However, as we have argued above, one potentially huge source of error is that the nightlights-based indicator cannot pick up the tremendous variation in income within urban environments. For that reason, we test if and how excluding those regions affects the correlation between our measure and the survey-based indicators. In order to do this, we first classify the grid cells used for our inequality computation (see step 1 in the above procedure) according to their level of urbanization. This is done using the GRUMP data set (Center for International Earth Science Information Network 2011), which gives us the proportion of a cell’s area that is “urban.” We then exclude cells based on different thresholds of this proportion from our analysis. Results from this exercise confirm our expectation. Excluding cells that are 90 percent urban results in an increase of the WIID–nightlights correlation to 0.57 and to 0.59 when excluding cells that are 80 percent urban (see Figure 1). In essence, implementing this simple adjustment of our nightlights-based estimation procedure improves the correlation with conventional inequality indicators by 20 percent.
Scatter plot of nightlights-based national-level Gini coefficients and those based on surveys (World Inequality Indicator Database, WIID)

Validating GeoEPR settlement regions
We have verified that the nightlights-based Gini coefficient is able to pick up basic patterns of inequality across countries, but does it also identify these patterns across groups? As argued above, one major source of error could result from the fact that our spatial procedure assigns all individuals living in a group region to one group. Thus, ethnically mixed populations cannot be identified correctly, which may constitute a major problem for our estimation procedure. Luckily, there is a way to validate the GeoEPR coding of settlement regions again using surveys as an alternative data source on ethnicity. The DHS are a collection of standardized surveys conducted for a large number of African countries (USAID 2013). In addition to the survey responses, more recent editions of the DHS also include the ethnicity of respondents and their location in geographic coordinates. This information allows us to test whether a respondent’s self-reported ethnicity matches his/her ethnicity as predicted by GeoEPR based on location.
Appendix Figure 1 illustrates the validation procedure for Sierra Leone graphically. The map shows the large settlement regions of the country’s ethnic groups, as coded by the GeoEPR data set. The small dots represent the self-reported ethnicities of the DHS respondents. As we only have locations for clusters of respondents (and not separately for each respondent), we plot respondents as circles around the cluster locations. Overall, the map shows that ethnicity based on the survey predominantly matches the GeoEPR-coded ethnicity. However, it also shows that in densely populated regions with high levels of diversity, the GeoEPR coding of ethnicity does not work as well (see, e.g., Freetown in the West of the country).
The sample for this validation exercise consists of 208,687 individual respondents from DHS surveys between 1986 and 2011.Footnote 13 We include all geocoded DHS surveys for Sub-Saharan Africa, giving us data on over 17 different countries at various points in time.Footnote 14 Data coverage is obviously far from comprehensive, but we believe it represents a decent sample of Sub-Saharan African countries. We manually match the group given in the DHS to the GeoEPR group categories and then compute the GeoEPR group for each respondent. This is simply done by taking the geographic location of a respondent (longitude/latitude coordinates) and looking up the GeoEPR group polygon that exists for that location and the given year. The results from this exercise are overwhelmingly positive. Out of the 208,687 individuals included in our sample, we can correctly predict their ethnic group for more than two-thirds (142,871, 68.5 percent). Similar to the nightlights measure, we may again be concerned that GeoEPR may be inaccurate, in particular, in urban areas with high degrees of ethnic mixing. This expectation is confirmed: if we exclude respondents living in “urban” areas as measured by GRUMP, the percentage of respondents where GeoEPR correctly predicts ethnicity goes up to 74.5 percent (102,789 correctly predicted respondents out of 138,038 respondents living in rural regions). This finding is another reason for excluding urban areas in our main analysis below, as it is in these regions where the spatial measurement procedure seems to be most prone to errors.
Group-level comparison using DHS surveys
Finally, we conduct a comparison at the group level using again data from the DHS. Recent research has used this and other cross-national surveys to measure group-level inequality indicators (Huber, Ogorzalek and Gore Reference Huber, Ogorzalek and Gore2011). However, we note at the outset that the survey-based group-level inequality estimates are an imperfect data source owing to problems related to sampling, assignment of respondents to ethnic groups, and the computation of wealth/income (see discussion at the beginning of this section). Still, although we cannot use the survey data as a reference measure to validate our data against, it is still interesting to see whether survey- and nightlights-based estimates point in the same direction.
In comparison with other surveys such as Afrobarometer or the World Value Survey, DHS seems to be quite well suited for our task, as (i) the national sample sizes are large, leaving us with large enough subsamples at the group level and (ii) DHS employs a fine-grained measure of wealth, which allows for a precise computation of a group-level Gini coefficient. We use again DHS surveys for Sub-Saharan Africa between 1986 and 2011. As described above, we match individuals to EPR groups and compute the Gini coefficient across all individuals of a group. This is done by constructing a wealth index based on the series of household asset questions, including questions on the type and quality of housing and the ownership of various household appliances and vehicles.Footnote 15 After breaking the wealth index into quintiles, we calculated the Gini coefficient by numerical approximation for each ethnic group using the trapezoid method. We drop again groups without a territorial representation and those with small DHS sample sizes (30 and below). This leaves us with a set of 251 groups for which we can compare survey- and nightlights-based Gini values.
For the groups in our sample, the correlation between the Gini based on DHS surveys and the one based on nightlights is 0.42 (p=0.00). This is not very strong, but indicates that our nightlights measure can pick up not only national level, but even group-level inequality to a certain extent. Again, we test whether the lack of precision of our spatial procedure in urban areas is partly responsible for the result. This expectation is confirmed; excluding cells that are at least 80 percent urban (as explained above) improves the correlation by roughly 10 percent to 0.46. This correlation may seem low at first, but we have to keep in mind that we are not comparing our nightlights-based measure with the “true” level of inequality.
In sum, our validation exercise has proven to be moderately successful. We have seen that the nightlights-based inequality indicator is able to pick up much of what survey-based indicators measure, both at the national and the group level. In addition, we were able to confirm for Sub-Saharan Africa that GeoEPR’s encoding of ethnic group regions allows us to predict the true ethnicity of individuals to a very high extent. Of course, our spatial measurement technique is far from perfect. For example, it is not applicable to groups without a territorial representation, and achieves weaker results in urban areas. However, as it is largely free from reporting and selection biases that could exist in surveys and is at the same time globally applicable, we believe that there are considerable advantages to using it in a large-N analysis such as ours. In the next section, we introduce the design of our analysis that relies on our new indicator.
Research Design and Results
We are now ready to proceed to an empirical test of our theoretical propositions presented above. Using regression analysis, we assess the explanatory impact of our nightlights-based inequality indicator on ethnic conflict onset. Our approach relies on Cederman, Weidmann and Gleditsch (Reference Cederman, Weidmann and Gleditsch2011) and amends their base model. The sample consists of politically marginalized ethnic groups, which have limited inclusion in their country’s government or are completely excluded from political influence. The group list and the level of political participation is taken from the EPR data set (Cederman, Wimmer and Min Reference Cederman, Wimmer and Min2010). As our nightlights-based indicator only goes back as far as 1992, we include annual observations from 1993 to 2010. This results in a sample of 7286 group years, which is slightly larger than the one in Cederman, Weidmann and Gleditsch (Reference Cederman, Weidmann and Gleditsch2011, 6438 observations) owing to the longer time period (1993–2010 as compared with 1991–2005).
Variables
Our dependent variable is the onset of ethnic conflict and is taken from the ETH Zurich’s GROWup data portal (http://growup.ethz.ch). The variable takes a value of “1” in those years where an ethnic groups becomes involved in armed conflict against the state. It is generated according to the procedure presented in the study by Wucherpfennig et al. (Reference Wucherpfennig, Metternich, Cederman and Gleditsch2012), where politically marginalized ethnic groups are coded as “in conflict” if an armed organization fights on their behalf in a civil war as defined by the Uppsala/PRIO Armed Conflict Dataset (Gleditsch et al. Reference Gleditsch, Wallensteen, Eriksson, Sollenberg and Strand2002).
The main independent variable is IGI based on nightlight emissions data for 1992, as introduced in the previous section. This is the earliest available release of these data, and we use it to estimate a group’s risk of conflict in the years 1993 and onwards. As our validation has clearly demonstrated that urban areas introduce error into our inequality estimate, we exclude these areas from the computation following the procedure described above. We use one estimate of inequality, as inequality is a quantity that changes only slowly over the years.Footnote 16 Thus, what drives our results is the cross-sectional variation between groups, which we believe can be captured sufficiently well using the nightlights-based indicator.
We include the same set of independent variables as Cederman,Weidmann and Gleditsch (Reference Cederman, Weidmann and Gleditsch2011). First, we measure horizontal inequality as the relative economic status of a group as compared with the country average (the linEq2 measure in the original paper). High values indicate that a group is either rich or poor as compared with the country average. As Cederman, Weidmann and Gleditsch (Reference Cederman, Weidmann and Gleditsch2011) have shown, high levels of horizontal inequality are related with a higher risk of conflict onset. Next, in addition to these economic motives for conflict, we control for political motives using a dummy for whether a group is excluded from political power, according to the EPR data set. A last group-level variable is the demographic power balance between the group and the group(s) in power, which following Cederman, Weidmann and Gleditsch (Reference Cederman, Weidmann and Gleditsch2011) is included both as a linear term and in a squared transformation to account for non-linearities in its effect on conflict onset. Last, we control for time trends by including the calendar year of observation and model temporal dependence in our dependent variable by including the number of peace years as a control variable, as well as its squared and cubed transformation (Carter and Signorino Reference Carter and Signorino2010).
Results
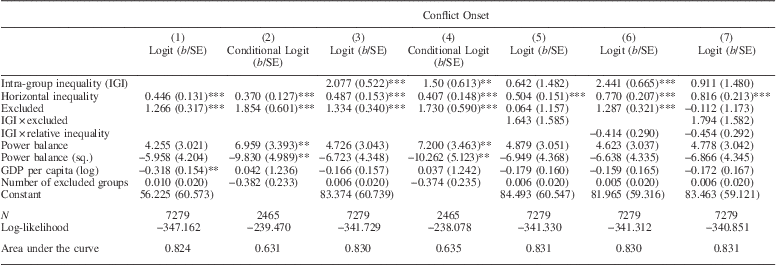
We use logit models to test the impact of IGI on ethnic conflict. Our models first replicate the base model from Cederman, Weidmann and Gleditsch (Reference Cederman, Weidmann and Gleditsch2011) and then add our IGI variable (Hypothesis 1). Next, we test for conditional effects by interacting IGI with our variables for economic motives—horizontal inequality—and political motives—exclusion (Hypothesis 2). Table 1 shows the results of our analysis.
Regression Results

Note: temporal controls (calendar year/peace years) not shown and standard errors clustered at the country level.
*p<0.10, **p<0.05, ***p<0.01.
Model 1 replicates the results from Model 3 in Cederman, Weidmann and Gleditsch (Reference Cederman, Weidmann and Gleditsch2011). As we rely on a different sample, the results differ to a certain extent. However, our analysis confirms the main effects found in the original paper and show that horizontal inequality of a group has a strong positive effect on conflict onset. Groups that are richer or poorer as compared with the national average face a higher risk of large-scale political violence. This economic effect operates together with a political one, as shown by the positive effect of the exclusion dummy: lack of political participation is a strong predictor of conflict. The remaining control variables receive largely the same effects as in the original model, but some fail to reach conventional levels of significance.
Model 2 uses a fixed-effects logit model (conditional logit) with the specification from the previous model. A common concern with cross-national group-level analyses is that cross-national variation—rather than variation across groups—is driving the results. A conditional logit model addresses these concerns by removing these purely cross-national differences, but in doing so, eliminates all the countries that do not have a conflict onset (thus the smaller N as compared with the other models).
In Model 3, we add our IGI measure to the base model. As we hypothesized above, IGI exhibits a positive and significant effect, indicating that ceteris paribus, more unequal groups have a higher risk of engaging in violent political conflict. The size of the effect is also significant in substantive terms; increasing IGI from 0.322 (5th percentile) to 0.984 (95th percentile) changes the predicted likelihood of conflict from 0.18 to 1.5 percent, an eightfold increase. Note that the coefficient for horizontal inequality is virtually unaffected by the inclusion of IGI. This attests to our conjecture that the different types of inequality are related to different types of conflict-inducing mechanisms; whereas horizontal inequality fosters a group’s motivation for conflict, IGI has little effect on motive, but rather influences mobilization capabilities. Moreover, note that the inclusion of IGI reduces the size of the GDP coefficient. This suggests that the latter may be owing to mobilization and not state strength, thus supporting the interpretation put forward by Collier and Hoeffler (Reference Collier and Hoeffler2004) as opposed to the one by Fearon and Laitin (Reference Fearon and Laitin2003).
Model 4 uses again a conditional logit model with the same specification as Model 3. As the Table shows, our results hold, with IGI having a positive and strongly significant effect.
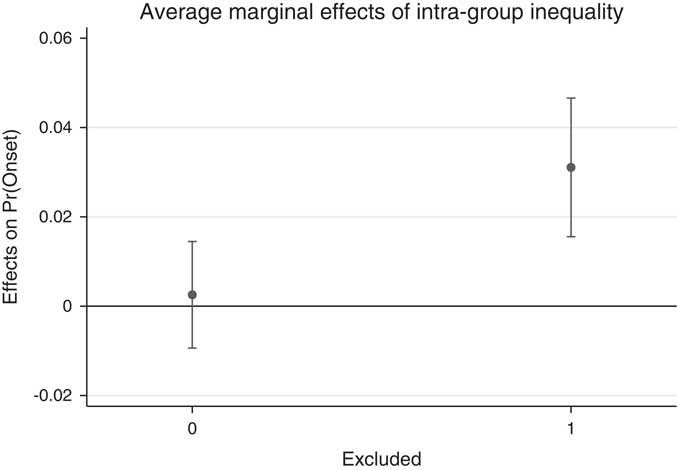
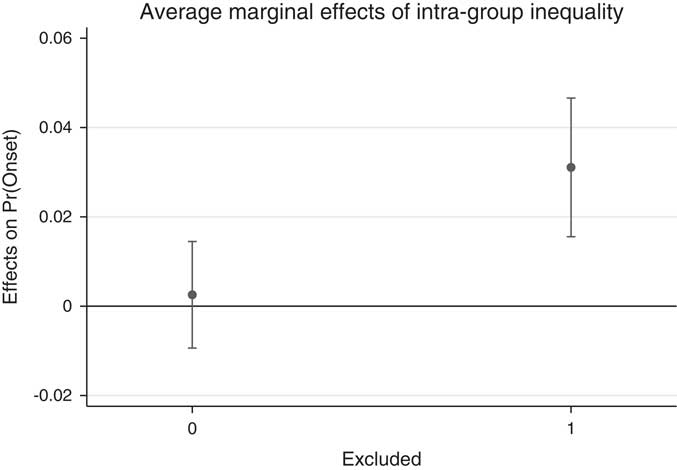
In Models 5 through 7, we test the conditional effects of IGI. As argued above, the effect of IGI should be stronger if both political and economic motives for conflict are high. Model 5 tests the former by interacting the exclusion dummy with IGI. As shown in the study by Ai and Norton (Reference Ai and Norton2003), interpreting interaction effects in non-linear models cannot be done based on the coefficients shown in the Table. Thus, in Figure 2 we plot the average simulated effect of IGI both for included and excluded groups. The plot confirms our expectation. For politically included groups, IGI seems to have no effect. For excluded groups, however, the effect is positive and significant.
Average simulated effects of intra-group inequality on conflict onset, for included (left) and excluded groups (right)
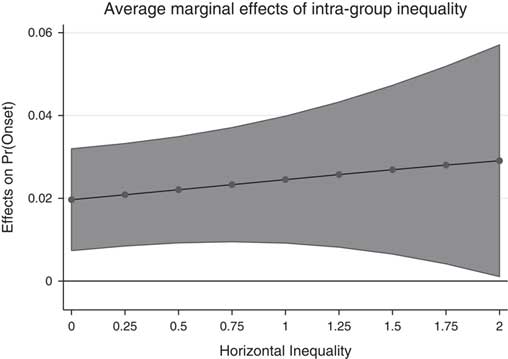
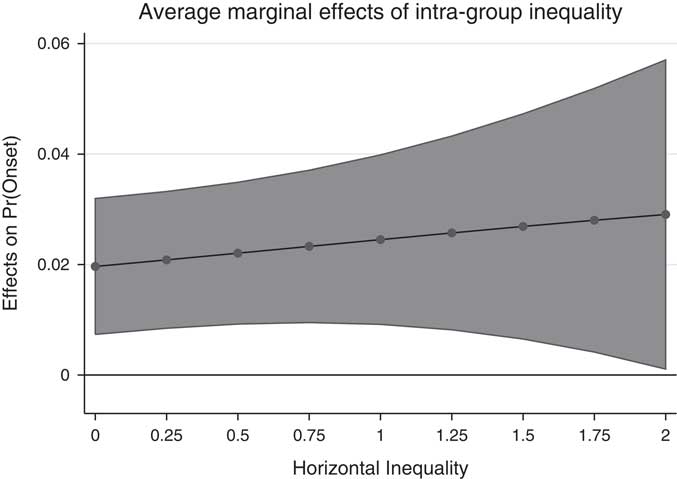
Model 6 interacts IGI with horizontal inequality compared with the national average. We plot the interaction effect in Figure 3. Horizontal inequality is represented along the x-axis and ranges from 0 (no inequality) to 2 (groups that are either about 1/4 as wealthy as the country average, or about four times as wealthy).Footnote 17 Although less pronounced as in Model 5, we find that the effect of IGI increases as economic motives for conflict increase; over the range of horizontal inequality, there is a marginal increase in the predicted probability of conflict onset by about 25 percent, from 0.02 to 0.025.
Average simulated effects of intra-group inequality on conflict onset for different values of horizontal inequality
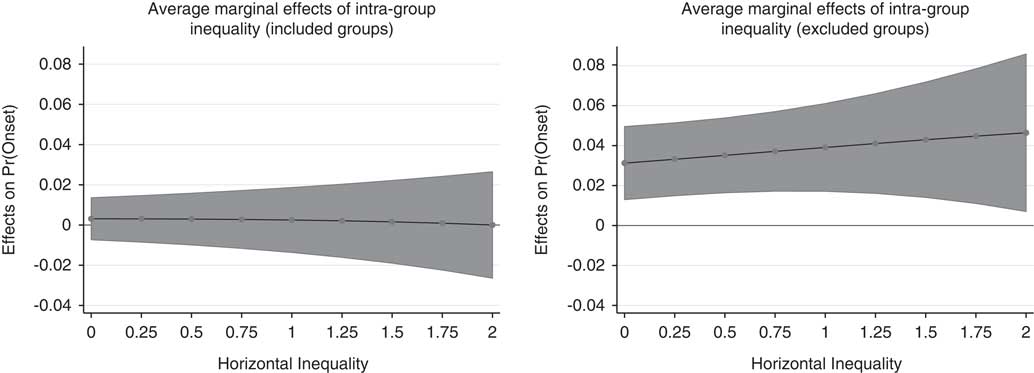
Model 7 adds both interactions at the same time. We visualize the interaction effect by separating out included groups (Figure 4, left panel) and excluded groups (Figure 4, right panel). As we expected, for included groups and irrespective of their horizontal inequality status, there is no effect of IGI, as the confidence interval in the left plot includes 0. This is different, however, for included groups, where we see a positive effect of IGI that increases as horizontal inequality goes up. Note that the political exclusion seems to have a much stronger effect on the extent to which IGI affects conflict: while excluded groups have a 3–4 percent increase in conflict risk owing to IGI (compare left and right panel), horizontal inequality increases the risk only by about 1 percent (right panel). In sum, these results are evidence supporting our hypothesis above: IGI seems to increase the risk of conflict, but only if political and economic motives are present.
Average simulated effects of intra-group inequality on conflict onset for different values of horizontal inequality, for included (left) and excluded groups (right)

We also tested the impact of IGI on the predictive accuracy of the model (Ward, Greenhill and Bakke Reference Ward, Greenhill and Bakke2010). In models with a binary outcome variable, this is typically done by ways of ROC analysis. Here, predictive accuracy is measured by the “area under the curve (AUC),” an indicator ranging from 0.5 (no value added as compared with random prediction) to 1 (perfect prediction). The AUC values for each of the models are given in the last row in Table 1. We can see that the baseline model (Model 1) already has a relatively high AUC score. Adding IGI (Model 3), the AUC score does increase, but only marginally so, demonstrating a weak improvement over the base model. The AUC score for the conditional logit models (Models 2 and 4) cannot be directly compared with the others, as they refer to the task of predicting conflict onset for groups within countries where at least one conflict occurred (thus, there is no cross-national variation that facilitates the prediction task).
Robustness Checks
Alternative operationalizations and specifications
We amend the models presented above with a series of additional checks, in order to ensure that the effect of IGI we find above remains robust across different model specifications. Our robustness checks include the baseline model testing the unconditional effect (Model 3) and the model with two interaction terms (Model 7). Detailed results of this exercise can be found in the online appendix.
First, we run the models with regional dummies, taken from Fearon and Laitin (Reference Fearon and Laitin2003). The effect of IGI remains positive and strongly significant in the unconditional model. The interaction with economic motives shows again that for higher values of horizontal inequality, the effect of IGI increases for excluded groups, but there is almost no effect for included groups. Second, we control for group wealth, taken from the study by Cederman, Weidmann and Gleditsch (Reference Cederman, Weidmann and Gleditsch2011). This test ensures that the effect of IGI we find is not because of systematic differences in wealth across groups. Our results remain fully robust to controlling for group wealth, and all our main effects of interest retain their signs and significance levels. In our model, group wealth is not significantly related to conflict onset. Third, we control for the presence of natural resources in the country, in particular, oil. Oil production has been shown to affect the risk of conflict, but may also contaminate our nightlights-based measure as it is associated with particular night emissions (illumination of oil fields and exhaust flames). Our dummy for oil production is based on Ross (Reference Ross2013). All our results remain robust to the inclusion of this variable. Finally, we test an alternative measure of state strength. As many other examples in the literature (e.g., Fearon and Laitin Reference Fearon and Laitin2003), our model uses GDP per capita to capture state strength, which may, however, capture many different factors. Therefore, we replace this variable with the incidence of coup attempts in the two years before the year of observation, based on data from Powell and Thyne (Reference Powell and Thyne2011). The occurrence of coup attempts is an alternative indicator of a weak state and may open a window of opportunity for rebellion. As we would expect, this indicator is positively related to conflict risk, but remains insignificant and does not alter the effects of our main independent variables.
Assessing bias from unobservables
Despite our attempts to control for many potential confounders, we cannot rule out that unobservable factors are correlated both with our independent and dependent variables, and lead us to mistakenly identify a significant association between IGI and conflict initiation. In order to assess the likelihood that our observed effect is solely because of selection bias, we follow a procedure proposed by Altonji, Elder and Taber (Reference Altonji, Elder and Taber2005).Footnote 18 The core idea is to assess how much stronger, in relation to observed controls, bias from unobserved covariates would have to be to explain away the effect of our main independent variable, IGI. This is done by comparing the coefficient estimated in a full model with all controls to the one obtained in a restricted model with no (or few) controls. The result of this calculation is a ratio, which indicates how much greater the effect of potential unobservables would need to be relative to the included observables in order for the coefficient estimate to be 0. Positive values indicate that adding controls attenuated the coefficient estimate of interest, whereas negative values indicate that adding controls increased the coefficient estimate.
We consider two sets of restrictive covariates: one with only temporal controls (i.e., calendar year and peace years) and another with temporal and group-level controls, but no country-level controls. Given our two hypotheses, we consider two different specifications from Table 1: the unconditional Model 3 and the conditional Model 7. The analysis based on Model 7 include the single and interaction terms in both the restricted and full set of covariates. The coefficient estimates of interest are in Model 3 the estimate of IGI and in Model 7 the coefficient estimates of the two interactions between IGI and political status and horizontal inequality.
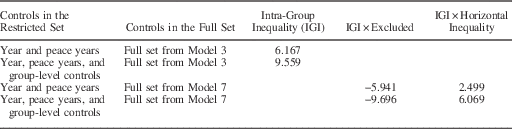
None of the six ratios presented in Table 2 are between −1 and 1. Their absolute values range from 2.5 to 9.7, with a median ratio of 6.12. Therefore, to attribute the entire estimate to selection effects, selection on unobservables would have to be at least 2.5 times greater than selection on observables and, on average, over six times greater. In our view, this finding makes it less likely that the estimated effect of IGI is fully owing to unobservables. The different signs of the ratios from Model 7 suggest that adding controls increases the effect of within-group inequality among politically excluded groups on conflict initiation, whereas the same controls attenuate the impact of interaction between the two different types of inequality. Moreover, the difference in absolute values between the ratios of the two interactions further strengthens our finding that political exclusion is the more powerful motivator than horizontal economic inequality. Finally, the similar size of the ratios in absolute values between the unconditional Model 3 and the interaction between within-group inequality and political exclusion in Model 7 strengthens our conclusion that the observed unconditional effect is largely driven by the subset of politically excluded ethnic groups.
Using Selection on Observables to Assess the Bias from Unobservables Following Altonji, Elder and Taber (Reference Altonji, Elder and Taber2005)

Conclusion
Examining why some ethnic groups engage in violence is crucial to our understanding of civil war. Although a huge number of articles and books have been written on this question, much of this research has focused either exclusively on opportunity (i.e., logistical and power-related arguments) or on willingness (i.e., political and economic grievances), but rarely both. In this paper, we argue that an ethnic group must have both the opportunity and willingness to engage in conflict and that different types of inequalities impact different aspects of that decision. Political and economic inequalities between groups provide conflict motives, and intra-group economic inequality contributes to the opportunity of a group’s elites to engage in a costly conflict by affecting the elites’ potential to mobilize a sufficient number of fighters. In order to evaluate these claims empirically, we develop a new spatial approach to measuring economic inequality using nightlight satellite imaginary, population rasters, and geocoded ethnic settlement areas. After validating our new measure, we add our indicator to an existing statistical model of conflict onset and find considerable evidence in support of our theoretical prediction. All else equal, greater economic inequality within a group significantly increases its likelihood of initiating conflict, especially if the group has fewer political or economic opportunities than others.
Although our results are far from definitive, leaving plenty of room for future theoretical and empirical research, we believe they provide important insights for conflict research. First and foremost, this paper makes a significant contribution to the “greed and grievance” debate in the civil war literature. By distinguishing between inter- and intra-group economic inequality, we show that these different types of economic inequalities matter for conflict onset in distinct and previously unnoticed ways. Although inter-group inequality affects an ethnic group’s willingness to rebel, IGI affects the group’s opportunity to launch a successful rebellion, suggesting that the overall effect of economic inequality on conflict onset is more complex than previous studies claimed. The complex interaction of these different types of economic inequalities may be the reason why previous quantitative studies failed to find a robust association between economic inequality and conflict. Second, to our knowledge, this is the first global empirical study of the impact of within-group economic inequality and its interaction with inter-group economic and political inequality on conflict initiation at the group level. Finally, our study offers one possible explanation for the inconsistent effect of commodity price shocks on conflict onset (e.g., Bazzi and Blattman Reference Bazzi and Blattman2011). Many ethnic groups engage in specific economic activities based on different production structures (e.g., large plantations versus small family farms). If a price shock affects a particular type of production, it will have diverging effects across groups, depending on how it affects between- and within-group inequalities among a country’s ethnic groups.