Introduction
The Spanish Beef market demands animals in the early stage of puberty or young animals, with high-muscled carcasses, a high percentage of lean meat and a certain degree of fatness to prevent weight loss during cold storage, while maintaining sensory quality (Alberti et al., Reference Alberti, Ripoll, Goyache, Lahoz, Olleta, Panea and Sañudo2005). The beef industry has become increasingly interested in implementing strategies for improving and reducing variation in carcass and meat quality. A successful tool to achieve this has been the implementation of ‘Protected Geographical Indications’ (PGI), which try to promote beef consumption from local breeds and traditional handling (European Commission, 2007). The consequence of marketing beef from a specific breed and handling method is that the range of carcass conformation and fatness degrees becomes narrow, also reducing the variation in carcass quality.
The European Union set up a bovine carcass conformation and fatness classification system, EUROP scales, to be applied in the entire EU territory for bovines heavier than 300 kg of live weight (Regulation EEC No. 1021/91) to provide a basis for determining the market price within each carcass weight range, facilitate the relationship between market operators and supplying markets with quality products. Because the scheme depends on human judgement, it is criticized by some as being subjective and, although classifiers do a complex training procedure before carrying out commercial classifications in order to avoid substantial individual differences in assessment, repeatability of carcass classifications tends to be low. Besides, carcass classification is criticized because it is a visual evaluation and carcass classes are described in a very broad manner (Díez et al., Reference Díez, Alberti, Ripoll, Lahoz, Fernández, Olleta, Panea, Sañudo, Bahamonde and Goyache2006). Cannell et al. (Reference Cannell, Belk, Tatum, Wise, Chapman, Scanga and Smith2002) concluded that the fast pace of classification in commercial packing plants caused inaccuracies in applications of grades by line-graders, thus affecting market confidence.
To avoid errors in carcass classification, there have been attempts to develop automatic classifiers of carcass grading (Steiner et al., Reference Steiner, Wyle, Vote, Belk, Scanga, Wise, Tatum and Smith2003), but only video image analysis has been applied for the on-line classification of beef carcasses according to the EUROP scale for conformation and fat cover (Allen and Finnerty, 2001; Goyache et al., Reference Goyache, Bahamonde, Alonson, López, del Coz, Quevedo, Ranilla, Luaces, Alvarez, Royo and Díez2001).
Colour measurements have been used as a tool to estimate beef palatability (Wulf and Page, Reference Wulf and Page2000; Wyle et al., Reference Wyle, Vote, Roebert, Cannell, Belk, Scanga, Goldberg, Tatum and Smith2003), and specifically, consumers assess the freshness and tenderness of veal based on lean colour; thus the veal industry relies heavily on lean colour for carcass grading and for determining carcass value (Denoyelle and Berny, Reference Denoyelle and Berny1999; Lagoda et al., Reference Lagoda, Wilson, Henning, Flowers and Mills2002). Klont et al. (Reference Klont, Barnier, Smulders, Van Dijk, Hoving-Bolink and Eikelenboom1999) found in veal carcasses that the majority of the muscle colour parameters measured at different times post mortem were not significant and only L* values 45 min post mortem were significantly lower for the heavier carcasses compared with the lighter ones. However, there is lack of information on the relationship between carcass colour and classification for conformation and fatness classes in older and non-suckling animals.
Thus, the aim of this paper is to study whether there are colour differences among close carcass conformation and fatness classes and whether instrumental colour measurements could improve carcass classification in a narrow range of conformation and fatness grades of carcasses coming from a population of high-muscled and very lean carcasses.
Material and methods
Animals
A total of 268 Pirenaica yearling bulls were born and raised on three private farms located in Northern Spain. After weaning at around 6 months of age, calves were fed with concentrate (containing corn gluten feed, soybean meal, copra, corn, wheat, beans, palmist, mineral salts and vitamins), which contained 90% dry matter, 16% crude protein, 6% crude fibre and 5% crude fat, and straw, both ad libitum (Association of Official Analytical Chemists, 2000). Animals were slaughtered and dressed in an officially approved slaughterhouse. Animals were transported approximately 60 km from each farm the same day of slaughter. Animals were slaughtered using standard commercial procedures, according to European welfare codes of practice. Animals were slaughtered on arrival using a captive bolt stunner followed by sticking and bleeding. Just after bleeding they were hung from their hocks. Animals were slaughtered at 507 ± 51 kg live weight and 366 ± 23 days of age. This is the most usual commercial type of carcass produced in Spain from young bulls slaughtered for beef consumption (Alberti et al., Reference Alberti, Ripoll, Goyache, Lahoz, Olleta, Panea and Sañudo2005).
Carcass classification, weight and dimensions
Before carcasses were placed in the cooler for ageing, 45 min post mortem, three licensed technicians classified carcasses for conformation and fatness according to the European beef carcass classification system (Regulation EEC No. 1021/91). When one of the technicians disagreed in the classification from the other two, his classification was discarded. When the three grades gave three different classifications, the average was used. For conformation score, thickness, width and length of carcass are estimated. A carcass considered well-conformed shows good muscling and convex and transversal profiles, and is wide, short and compact. Conformation classification has six grades, which form the word SEUROP, with S being those carcasses with ‘superior’ conformation, E ‘excellent’, U ‘very good’, R ‘good’, O ‘fair’and P being ‘poor’. Fatness degree is related to the amount of subcutaneous and thoracic fat. Fatness classes are 1 for ‘low’, 2 ‘slight’, 3 ‘average’, 4 ‘high’ and 5 for ‘very high’. Conformation and fatness categories can be subdivided up to three subcategories (+, 0 and −) to improve the accuracy of classification. Hence, for conformation, carcasses were scored from 18 for S+ to 1 for P−. For fatness, carcasses were scored from 15 for 5+ to 1 for 1−.
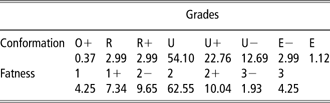
Table 1 shows that 80% of carcasses graded 2 in fatness score (2−, 2° or 2+) (n = 213) and 90% of carcasses graded U in conformation score (U−, U° or U+) (n = 240). To test a homogenous dataset group of carcasses and to try to identify the major factors affecting conformation and fatness classification, for statistical analysis it was decided to leave out of this study carcasses with conformation scores higher or lower than U (classes E, R and O), and fatness scores higher or lower than 2 (classes 1 and 3).
Percentage of carcasses by conformation and fatness gradesFootnote † of the European beef carcass classification system (n = 268)
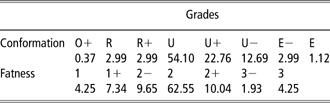
† Carcass conformation and fatness scores by comparison with the official conformation standards of the European Union beef carcass classification system.
Immediately after classification, the carcasses were hung in a cold store at 4°C for chilling. After chilling, the left half of the carcass was sectioned at the sixth thoracic rib and the pH and temperature of the longissimus dorsi muscle were measured (pH24 h and Ta24 h) using a portable Crison model 507 pH meter equipped with a penetration electrode and a temperature probe (ISO, 1974).
After chilling, carcasses were weighed and carcass measurements were recorded according to de Boer et al. (Reference de Boer, Dumont, Pomeroy and Weniger1974) and Alberti et al. (Reference Alberti, Ripoll, Goyache, Lahoz, Olleta, Panea and Sañudo2005).
• Length of carcass, measured from the anterior edge of the symphysis pubis to the middle of the anterior edge of the visible part of the first rib.
• Length of the hind leg, measured from the medial malleolus of the tibia in a straight line to the anterior edge of the symphysis pubis.
• Width of the leg, measured as the horizontal distance between the outermost points on the medial and the lateral surface of the leg.
• Perimeter of the leg, the maximum measurement of the horizontal contour of the leg at the symphysis pubis level.
• Depth of the chest, measured from the last sternebra to the dorsal tip of the spinous process of the sixth thoracic vertebra.
A blockiness index was calculated as the ratio between cold carcass weight and carcass length. Length and perimeter measurements were taken by a tape measure, whereas width measurements were taken by a caliper.
Colour measurement
At the end of the slaughter chain (45 min post mortem) and before the carcasses were placed in the cooler, instrumental colour measurements were taken on two accessible muscles on the carcass surface: latissimus dorsi muscle at the 8th thoracic rib (LTD45 min) and on the outer portion of the rectus abdominis muscles (RA45 min). No cut or incision was made to measure the colour of these muscles. Carcass fat colour was measured on the subcutaneous fat covering longissimus dorsi muscle, at the 10th rib (FAT45 min). After hanging in a cold store for 24 h, colour readings were taken again on the LTD (LTD24 h) and RA (RA24 h) muscles, and on the subcutaneous fat (FAT24 h).
The LTD muscle was chosen as one of the most easily accessible muscles on the carcass, while the RA muscle was chosen because it was recommended for measurement by Legras (Reference Legras1981) and the American Meat Science Association (2001).
Meat colour was measured instrumentally using a spectrocolorimeter (model CM2002; Minolta, Osaka, Japan) (λ: 400 to 700 nm, Δλ: 10 nm, D65, 10°) calibrated with a white plate and a light trap supplied by the manufacturer. Colour was expressed using the Commission International de l’Éclairage (CIE) L*, a* and b* colour system (CIE, 1976) together with hue angle (H*) and chroma (C*). A total of five spectral readings were taken for subcutaneous fat and for each muscle, turning the spectrocolorimeter 360°.
Statistical analysis
One-way analysis of variance (ANOVA), taking time elapsed after slaughter as the fixed effect, was run in order to measure carcass colour evolution during the first 24 h post mortem. Tukey’s test was used for the comparison of means.
One-way ANOVA was used to examine the differences among U conformation-grade levels (U−, U° and U+) and among 2 fatness-grade levels (2−, 2° and 2+) depending on carcass weight, dimension, colour, pH and temperature. Discriminant function analysis was used to determine which variables measured on the carcass discriminate between the grades of conformation and grades of fatness. Owing to the high number of parameters measured, only those that showed significant differences among conformation or fatness classes were included in the discriminant analysis.
The statistical package used was SPSS v.13.0 (SPSS Inc., Chicago, IL, USA).
Results and discussion
Carcass characteristics and colour evolution
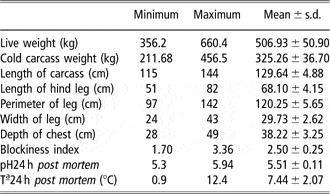
Data from the carcasses studied could be considered a representative sample of the actual distribution of weights, conformation and fatness existing in the beef market under the Protected Geographical Indication ‘Ternera de Navarra’. Table 1 shows that the cattle used in this study produced medium-high conformed and low-fat carcasses: conformation score U or ‘very good’ and fatness score 2 or ‘slight’. Data from the carcasses studied (Table 2) could be a representative sample of Pirenaica young bulls raised and slaughtered similarly, because they were similar to those reported for different authors (Goñi et al., 1999; Gorraiz et al., Reference Gorraiz, Beriain, Chasco and Insausti2002; Alberti et al., Reference Alberti, Ripoll, Goyache, Lahoz, Olleta, Panea and Sañudo2005).
Descriptive statistics for live weight, carcass weight, carcass dimensionsFootnote †, pH and temperature of yearling bull carcasses (n = 268)

† Length of carcass: distance from the anterior edge of symphysis pubis to the middle of the anterior edge of the visible part of the first rib. Length of hind leg: distance from the medial malleolus of the tibia in a straight line to the anterior edge of the symphysis pubis. Width of leg: The horizontal distance between the outermost points on the medial and the lateral surface of the leg. Perimeter of leg: the maximum measurement of the horizontal contour of the leg at the symphysis pubis level. Depth of chest: distance from the last sternebra to the dorsal tip of the spinous process of the sixth thoracic vertebra. Blockiness index: ratio between cold carcass weight and carcass length.
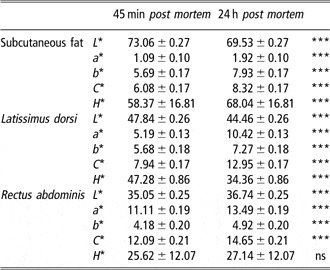
Table 3 lists the colour coordinate values characterizing the subcutaneous fat, LTD and RA muscles on the day of slaughter (45 min post slaughter) and after chilling for 24 h. The results for the colour coordinates a* and b* for the RA muscle in this study are similar to those described by Klont et al. (Reference Klont, Barnier, Smulders, Van Dijk, Hoving-Bolink and Eikelenboom1999) and Lagoda et al. (Reference Lagoda, Wilson, Henning, Flowers and Mills2002). In contrast, lightness (L*) values were substantially lower (10 to 15 units). This difference may be attributed to the fact that these authors studied veal cattle (16 to 30 weeks old) whereas in the current study yearling bulls were used (1-year old). The CIE L*, a* and b* colour coordinate measurements taken on the carcass at the time of slaughter (45 min post mortem) varied significantly from the readings taken after hanging for 24 h (P < 0.001). The higher a* and b* values could be caused by oxygenation of both subcutaneous fat and the LTD and RA muscles in the time elapsing after slaughter. The change in L* was different for the two muscles: Lightness of the subcutaneous fat and LTD muscle underwent a decrease, compared with an increase in the RA muscle. Eikelenboom et al. (Reference Eikelenboom, Hoving-Bolink and Hulsegge1992) and Lagoda et al. (Reference Lagoda, Wilson, Henning, Flowers and Mills2002) also observed an increase in lightness for the RA muscle, and this may be due to an increase in the amount of light dispersed by the muscle myofibrils as a consequence of rigor mortis of the muscle (MacDougall, Reference MacDougall1982).
Least Square Mean and standard error values for the instrumental CIE L*, a* and b* colour coordinates, chroma (C*) and hue (H*), for the subcutaneous fat, latissimus dorsi and rectus abdominis muscles 45 min post mortem and after hanging for 24 h in a cold store in yearling bull carcasses (n = 268)

Barnier et al. (1998) pointed out that the decrease in lightness taking place in the LTD muscle could be explained in terms of changes in myoglobin concentration and the final pH value, but these two factors could not fully explain it. Besides, if the carcass surface was exposed to the circulating air in the cooler for close to 24 h, moisture loss and surface hardening of the latissimus dorsi muscle surface and subcutaneous fat could have occurred, and this factor could contribute to the occurrence of darker carcasses during storage as compared to the early post mortem evaluation of colourless exposed muscle to circulating air such as rectus abdominis.
Differences among conformation grades
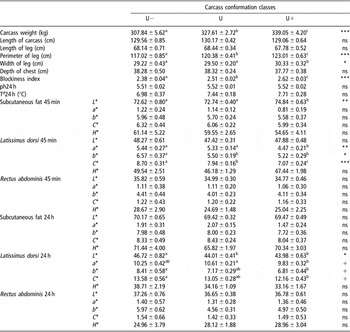
Table 4 presents the ANOVA results for carcass weight, carcass dimensions, pH, temperature, colour coordinate readings (L*, a*, b*, C* and H*) for the subcutaneous fat, latissimus dorsi and rectus abdominis muscles from the yearling bull carcasses measured at 45 min and 24 h post mortem according to sub-classes (U−, U° and U+) of conformation class U.
Carcass weight and dimensionsFootnote †, pH, temperature and colour readings for subcutaneous fat, latissimus dorsi and rectus abdominis muscles, measured 45 min (45 min) and 24 h (24 h) post mortem for the sub-classes of the beef carcass conformation class U (n = 240) (least square mean ± s.e.)

† For a description of carcass dimensions see Table 2.
Different superscript letters within row indicate significant differences.
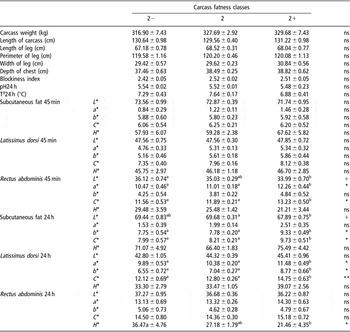
The cold carcass weight, perimeter of the leg, width of the leg and the blockiness index increased as the carcass conformation score increased (P < 0.05). The general impression of the whole carcass affects the classification, as it is reflected by the increase in carcass weight and blockiness index with conformation grade (Díez et al., Reference Díez, Bahamonde, Alonso, López, del Coz, Quevedo, Ranilla, Luaces, Alvarez, Royo and Goyache2003). Although carcass weight is not properly included in the conformation rules, these results suggest that this trait exerts a major influence on classification performance.
There were no differences in carcass dimensions related to length, so the grader tried to reflect the differences in the proportions of the more-desirable (round) to less-desirable part of the carcass, and so the graders scored higher for conformation of those carcasses with a higher perimeter of the leg, that is, the wide and compact carcasses with more convex and transversal profiles. This relationship between perimeter of the leg and carcass conformation agrees with results of Díez et al. (Reference Díez, Bahamonde, Alonso, López, del Coz, Quevedo, Ranilla, Luaces, Alvarez, Royo and Goyache2003), who found that in yearling bulls, classifiers apply conformation classification rules rigorously and use only attributes characterizing muscular development and carcass profiles. In the same way, Alberti et al. (Reference Alberti, Ripoll, Goyache, Lahoz, Olleta, Panea and Sañudo2005) found that variables related to the volume of the leg were highly and significantly correlated with conformation in yearling bulls.
However, these results do not mean that classifiers always take into account the muscular development of the leg. Firstly, carcass classification presents highly non-linear patterns because the behaviour of classifiers seems to be quite different when dealing with different types of carcasses. For example, muscular development of the leg is taken into account when carcasses from yearling bulls with a very good conformation (conformation U) are judged. Secondly, when the grader classifies carcasses over a wide range of carcasses, then attributes characterizing body size or skeletal development, such as depth of the chest or length of the carcass, acquire considerable importance, overriding the attributes characterizing muscular development (Díez et al., Reference Díez, Alberti, Ripoll, Lahoz, Fernández, Olleta, Panea, Sañudo, Bahamonde and Goyache2006).
Klont et al. (Reference Klont, Barnier, Smulders, Van Dijk, Hoving-Bolink and Eikelenboom1999) observed higher temperature and lower pH at 24 h post mortem in veal carcasses with best conformation. Although in the current research there were no differences in the final pH or temperature values among conformation grades, the heavier carcasses had lower pH values than the lighter carcasses (r = −0.13; P < 0.05). At constant temperature, heavier carcasses delay cooling, with higher carcass temperatures for longer periods being conducive to acid formation in the muscle, in turn hastening the onset of rigor mortis.
The a* and b* coordinates and chroma (C*) values for the LTD muscle, 45 min post mortem, was observed to decrease significantly as the carcass conformation score increased (P < 0.05). After 24 h, beef carcasses scoring U− for conformation showed a tendency to have higher L*, a*, b* and C* values than carcasses scoring U+ (P < 0.5). Regarding subcutaneous fat colour, there were only significant differences in the lightness (L*) at the 45 min post mortem when carcasses graded as U+ showed higher L* values (P < 0.01). Carcass colour evolutes during chilling (Table 3) and carcasses with higher conformation scores would show a more pronounced decrease in L*. Carcass colour variables measured shortly after slaughter were closely related to conformation score than colour variables measured after 24 h of chilling (Table 4).
The higher conformation values are usually associated with more highly developed white muscle fibre content, which are less pigmented and it could account for the decrease in a* and C* (Jurie et al., Reference Jurie, Robelin, Picard, Renand and Geay1995). Besides, the lower colour coordinates in those carcasses with high conformation grade would be linked to a higher final pH value (Guignot et al., Reference Guignot, Touraille, Ouali, Renerre and Monin1994; Wulf et al., Reference Wulf, O’Connor, Tatum and Smith1997).
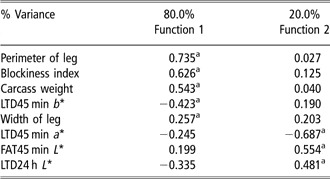
When defining groups by conformation score, two discriminant functions were obtained, with 69% of carcasses correctly classified (Table 5). Function 1 separated low- from high-conformation score due to differences on muscular development of the leg, blockiness, carcass weight, and colour coordinate b* measured at the latissimus dorsi muscle, taken 45 min post mortem. Function 2 separated medium- from high- and low-conformation scores, on the basis of colour coordinate a* of latissimus dorsi muscle measured 45 min post mortem and L* of subcutaneous fat 45 min post mortem and latissimus dorsi muscle after carcass chilling (24 h post mortem). Of the total, 62.1% of cases were correctly classified. No carcass with conformation U− was classified as U+, but 35.7% were classified as U. Again, 16.2% and 23.2% of carcasses with conformation U were classified as U− and U+, respectively. Finally, 11.9% and 23.8% of carcasses with conformation U+ were classified as U− and U, respectively. Allen and Finnerty (2001) found that video image analysis classified correctly between 58.3% and 48.7% of carcass for conformation depending on the type of video image system. These authors studied a carcass population that presented all the conformation score and they found that between 94% and 97% of predictions were within one sub-class of the reference panel score.
Correlation coefficients between canonical discriminant functions and carcass parametersFootnote ‡ on groups defined by ‘conformation score’

† C* coordinate was not included because it is a combination of a* and b* coordinates.
‡ For a description of carcass dimensions see Table 2.
a Largest absolute correlation between each variable and any discriminant function.
Differences among fatness grades
Table 6 presents the ANOVA results for carcass weight, carcass dimensions, pH, temperature and colour coordinate readings (L*, a*, b*, C* and H*) for the subcutaneous fat, latissimus dorsi and rectus abdominis muscles from the yearling bull carcasses measured at 45 min and 24 h post mortem according to sub-grades (2−, 2° and 2+) of fattening grade 2.
Carcass weight and dimensionsFootnote †, pH, temperature, colour readings for the subcutaneous fat, latissimus dorsi and rectus abdominis muscles, measured 45 min (45 min) and 24 h (24 h) post mortem for the sub-grades of the beef carcass fatness grade 2 (n = 213) (least square mean ± s.e.)

† For a description of carcass dimensions see Table 2.
Different superscript letters within row indicate significant differences.
There were no significant differences for carcass weight, carcass dimensions, carcass pH and temperature among the carcasses classified according to the three degrees of fattening. Alberti et al. (Reference Alberti, Ripoll, Goyache, Lahoz, Olleta, Panea and Sañudo2005) found that carcass fatness had a weaker relationship with carcass dimensions than conformation in a heterogeneous population of yearling bulls. A higher carcass temperature would be expected in those fatter carcasses, due to the protection that subcutaneous fat provides against cooling. However, the low fattening level of the carcasses in the present study would not provide differences in the carcass cooling.
At 45 min post mortem, the RA muscle in the fatter carcasses showed lower lightness (L*) (P < 0.1), but higher a* colour coordinate and chroma (C*) values than leaner carcasses (P < 0.05). At 24 h post mortem, LTD muscle colour in the fatter carcasses was not only redder (a*) and had higher chroma (C*), but also had higher b* (P < 0.05). At 24 h post mortem, subcutaneous fat of carcasses with fatness score 2+ tended to show lower L* but higher b* and C* values (P < 0.05) than leaner carcasses. Conformation and fatness were negatively correlated (r = −0.12; P < 0.05, data not shown). Those carcasses with higher conformation would be leaner and have muscles surface with lower a*, b* and C* values than those fatter carcasses with lower conformation scores (Tables 4 and 6). Due to the thin subcutaneous fat layer (3.2 mm at the 6th rib), light of the spectrocolorimeter could exceed the fat layer and higher b* and C* values of subcutaneous fat 24 h post mortem of those fatter carcasses could be influenced by the colour of the muscle that covers (longissimus dorsi).
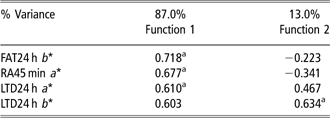
When defining groups by fatness score, two discriminant functions were obtained, but only 37.1% of carcasses were correctly classified (Table 7). Function 1 separated low and medium against high fatness score due to differences in the b* colour coordinate of fat and LTD muscle 24 h post mortem and the a* coordinate of RA 45 min post mortem. Function 2 separated medium from low fatness scores, on the basis of the a* coordinate of LTD after carcass chilling. Around 72.2% of carcasses with fat class 2− were correctly classified but 22.2% and 5.6% were classified as 2 and 2+, respectively. Also, 72% of carcasses with fatness score 2 were incorrectly classified, 46.5% as 2− and 25.6% as 2+. Finally, 60.9% of carcasses with fatness score 2+ were correctly classified but 30.4% and 8.7% were classified as 2− and 2, respectively.
Correlation coefficients between canonical discriminant functions and carcass parametersFootnote ‡ on groups defined by ‘fatness score’
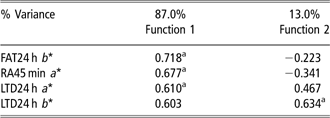
† C* coordinate was not included because it is a combination of a* and b* coordinates.
‡ For a description of carcass dimensions see Table 2.
a Largest absolute correlation between each variable and any discriminant function.
Allen and Finnerty (2001) found that video image analysis classified correctly between 34.8% and 30.2% of carcass for fatness depending on the type of video image system. These authors studied a carcass population that presented all the fatness classes and they found that between 74.4% and 79.6% of predictions were within one sub-class of the reference panel score. These authors attribute the lower efficiency of video image systems to correctly classify carcasses by fatness class to the greater variation in beef carcasses fat class scores compared with the conformation class scores in the population they studied. However, they pointed out that it may reflect greater difficulty in determining the correct fat class by the carcass graders.
Some authors have reported that tougher beef was associated with darker-coloured lean measured at the ribbed longissimus dorsi (lower L*, a* and b* values) (Wulf and Page, Reference Wulf and Page2000; Wyle et al., Reference Wyle, Vote, Roebert, Cannell, Belk, Scanga, Goldberg, Tatum and Smith2003; Goñi et al., Reference Goñi, Beriain, Indurain and Insausti2007). The relationship between colour and tenderness has been explained by the effect of animal feeding with tenderness, e.g. more carotenoids (higher b* values) in grass-fed animals (Vote et al., Reference Vote, Belk, Tatum, Scanga and Smith2003). However, Goñi et al. (Reference Goñi, Beriain, Indurain and Insausti2007) found that those carcasses with higher b* colour values in LTD and higher a* in RA yielded tougher cooked meat in a group of animals fed with the same diet based on concentrate. Although the relationship of fat and lean colour with tenderness could be different regarding the type of muscle, carcass management or animal feeding, differences in carcass colour among carcasses could be helpful both to grade carcasses for fatness and conformation more accurately and as an indicator of palatability.
Conclusion
There was an increase in the a* and b* colour coordinates during the first 24 h post mortem both in subcutaneous fat and in carcass surface muscles. However, L* values evolution was different depending on the muscle. Even in very close conformation grades, the carcasses with a high conformation score were heavier and had higher perimeter of the leg. Besides, they exhibited lower L*, a* and b* colour coordinates than those carcasses with a lower conformation score. This relationship was more pronounced in latissimus dorsi muscle at the time of slaughter and it supports the conventional practice of classifying carcasses very shortly after slaughter. Colorimetric readings intending to differentiate carcasses based on their degree of fattening should be made on the LTD muscle 24 h post mortem, once cooling and hardening of the fat is well under way. So, colour measurements on the carcass at the early post mortem period might be helpful to meat industry and to producers in order to discriminate among carcass classification grades. Anyway, it would be interesting that the method would be taken on to further trials to test the strength of its predictive ability. This would help to establish a more objective price for this type of carcasses that are very homogeneous for official classification.