David Mayhew’s Divided We Govern launched a wave of scholarship on the politics of gridlock and divided government in the United States.Footnote 1 Until Mayhew’s revisionist view, conventional wisdom had maintained that a government controlled by one party would more effectively produce significant public policy. Early in the twentieth century, Woodrow Wilson expressed his view that the Madisonian system caused political conflicts and government ineffectiveness, and argued for unity between the president and his party in Congress.Footnote 2 Similarly, modern scholars observed that common partisan control of the executive and legislative branches contributed to an effective government.Footnote 3 As divided government became common in the 1980s, researchers contended that divided government intensified inter-partisan conflicts between the two branches for electoral advantage.Footnote 4 Nonetheless, by compiling a list of significant legislative enactments during the period from 1947 through 1990, Mayhew challenged conventional wisdom and argued that divided government did not decrease the amount of important legislation enacted in the United States.Footnote 5 Recently, Mayhew has augmented the list of significant legislation in the years from 1991 to 2002 and has again claimed that divided government has no impact on legislative productivity.Footnote 6
Since Mayhew’s groundbreaking contribution, an increasing number of scholars have re-examined the theoretical and empirical grounds of the divided government–gridlock nexus in American politics. Several scholars have questioned Mayhew’s measure of the volume of enacted laws; they have, as an alternative, explored a ratio of the enacted legislation to the entire legislative agenda, and found an impact of divided government.Footnote 7 However, scholars of the preference-based school have contended that gridlock could occur in unified as well as divided government because the proximity between the status quo and preferences of pivotal legislators could cause gridlock.Footnote 8
In spite of the vast number of the post-Mayhewian studies, most of them have focused on various quantifications of legislative productivity as measures of gridlock. In contrast, by following the definition of gridlock as an inability to change policy, I argue that the policy output of legislation has to be examined in the study of gridlock. I incorporate a preference-based approach in my study and examine the influence of the preferences of legislators, such as the filibuster, override and House median veto players. In contrast to a unidimensional model, I examine veto players’ preferences in a two-dimensional, Euclidean space. Then, I test the influence of the area of the winset, which is the intersection of the veto players’ indifference curves, on the change in policy output of the enacted legislation.
Gridlock: legislative productivity or policy stability?
The central focus in the literature of post-Mayhew scholarship has converged primarily on legislative productivity with various quantification methods. Nonetheless, I argue that the policy content of legislation, specifically the policy change of legislative output in preferential space, should be examined in the study of gridlock. The scholarly definition of gridlock has encompassed two schools of thought: gridlock as a legislative inability to respond to public agendasFootnote 9 and gridlock as an inability to change policy. Notably, neither definition of gridlock implies an amount of legislation enacted into law.
On the one hand, Bond and Fleisher define gridlock as ‘a lack of movement toward solving the nation’s problem’.Footnote 10 This view is reinforced by Binder’s more specific definition as ‘the share of salient issues on the nation’s agenda that is left in limbo at the close of a Congress’.Footnote 11 As for this definition of gridlock, it is ambiguous as to how the volume or the ratio of passed legislation could measure the degree of legislative responsiveness to the public agenda. The selection of important laws by most scholars is based upon a mere dichotomy – laws that are important and laws that are not important. Therefore, all selected laws are presumed to share the same degree of importance. This measurement disregards the variation in the significance of laws. If two significant bills are merged into a single law, government responsiveness decreases by half under this measurement. Mayhew is aware of this problem and states that omnibus measures ‘dwarf most everything else and that renders any simple counting up of laws precarious’.Footnote 12
On the other hand, several scholars define gridlock as an inability to change the policy of the status quo.Footnote 13 Krehbiel terms gridlock as ‘the absence of policy change in equilibrium in spite of the existence of a legislative majority that favors change’. As Krehbiel acknowledges,Footnote 14 his definition of gridlock is equivalent to what some scholars call policy stability.Footnote 15 Tsebelis defines policy stability as ‘the impossibility of significantly changing the status quo’.Footnote 16 Tsebelis stresses the importance of studying policy stability as an indicator of governmental decisiveness, but also as an explanatory variable for government stability and judicial independence.
Inasmuch as gridlock is defined as policy stability, the number of enacted laws is hardly relevant to the size of policy change. Schattschneider’s classic work, which is frequently cited as a classic theorem of a divided government/gridlock relationship, in fact draws a distinction between the volume of laws and their policy impact.Footnote 17 He suggests that divided government does not influence the number of enacted laws but it does alleviate the policy outcomes of the legislation. Schattschneider states that under divided government, some major controversial bills ‘had to be emasculated to be passed whenever the consent of both parties has been required for enactment’.Footnote 18 In contrast, Mayhew argues that the conditions of party control have a marginal impact on policy output. Mayhew observes modest policy changes in the enacted laws regardless of whether the government is unified or divided.Footnote 19 In the study of gridlock, therefore, it is highly crucial to examine the policy output of the enacted legislation.
Veto players: theory
Since the Mayhewian repudiation of the divided government–gridlock nexus, the school using the preference-based model has proposed rigorous theoretical frameworks to explain why divided government does not matter.Footnote 20 Among them, Krehbiel offers the most elegant theory. Krehbiel argues that gridlock occurs under unified as well as divided government because the distribution of individual preferences within the legislature causes gridlock. Krehbiel maintains that what appears as partisanship is actually the individualistic behaviour of legislators.
Krehbiel’s theory assumes players with single-peaked preferences on a unidimensional policy continuum. Krehbiel focuses on two players who play pivotal roles because of the supermajoritarian procedures in Congress: the filibuster pivot and the override pivot. Krehbiel observes that when the status quo is present within a gridlock interval between the ideal points of filibuster and override pivots, the status quo is unlikely to be changed. This indicates that what Krehbiel calls ‘pivots’ are largely parallel to what other scholars call veto players, without whose unanimous agreement the status quo cannot be changed.Footnote 21
In contrast to the unidimensional model, I assume veto players in a two-dimensional, Euclidean policy space for two reasons. First, many bills in the period I have examined are based upon the continuum of a social agenda, and divisions within parties are more salient in the social issue dimension. While Poole acknowledges that the dimension of social issues has slowly declined in importance since the late 1960s, he observes that two dimensions are required to account for the great bulk of voting in the period since the Second World War.Footnote 22 Civil rights issues, in particular, split the Democratic party and created the three-party system, making the social issue dimension significant until the early 1980s.Footnote 23 Frymer has noticed that the conservative contingent in the Democratic party complicates policy making under a Democratic unified government.Footnote 24 In contrast, Frymer observes, Reagan enjoyed a powerful coalition with conservative Democrats in spite of divided government.
Since the Democratic party was divided on various social, as well as economic, issues until the early 1980s and this period accounts for half of the congresses in my study, the influence of the legislators’ preferences should be examined in both the social and economic dimensions.
Secondly, while several scholars have stressed that bicameralism is a substantial cause of policy stability,Footnote 25 Euclidean policy space could concisely encompass the pivotal legislators of different chambers. Whereas Krehbiel’s acameral model includes only two pivots, such as the filibuster and override pivots, the model scarcely resembles the bicameral Congress in actuality.Footnote 26 The acameral model remains ambiguous as to which Senate or House override pivot would assume a pivotal role. Also, a House median member could be pivotal since a majority in the lower chamber could reject legislation on the floor.
Thus, for theoretical consistency and methodological rigor, I model a finite two-dimensional space and include the House median pivot and the House override pivot as well as the Senate filibuster and override pivots within the space. The advantages of this approach include the fact that the influences of the House, the Senate and the presidency can be placed on the same space. In the model, the Republican and Democratic presidents are assumed to be conservative and liberal, respectively. Accordingly, under the Republican presidency, a 34th percentile legislator from the most conservative member is an override pivot, and a 41st percentile senator from the most liberal senator is a filibuster pivot. For the Democratic presidency, the inverse points become the override and filibuster pivots.
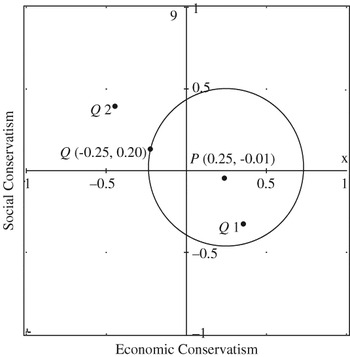
As Figure 1 shows, I postulate veto players with single-peaked preferences in the policy space. Compatible with Poole’s works, I presume a dimension of economic issues and a dimension of social issues.Footnote 27 For example, in Figure 1, a pivotal legislator P’s ideal point is at (0.25, −0.01), indicating that she is slightly conservative on economic issues and moderate on social issues. Also, in the figure, the ideal point of the status quo, Q, is at (−0.25, 0.2). Legislator P would prefer a new policy to the status quo, Q, if the new policy point is closer than the status quo point to her ideal point. By plotting a circle, the so-called indifference curve, centred on her ideal point that passes through the status quo point (Q), it could be assumed that any new policy in the circle is closer than the status quo to her ideal point (the centre of the circle). The indication is that legislator P would prefer any new policy in her indifference curve to the status quo, and she prefers the status quo to new policy proposals outside her indifference curve. Thus, P is likely to support any proposed bills, including Q1, inside of her indifference curve, and she would reject legislation, including Q2, outside of her indifference curve.
Indifference Curve of Pivotal Legislator, P

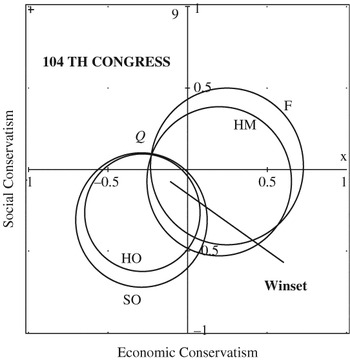
Figure 2 shows the ideal points of the Senate filibuster pivot (F), the Senate override pivot (SO), the House override pivot (HO) and the House median pivot (HM), and the ideal point of the status quo (Q) in the 104th Congress.Footnote 28 These override, filibuster and House median veto players could reject bills with the support of one-third, two-fifths, and a majority of legislators, respectively.Footnote 29 The veto players would support bills within their respective indifference curves and reject legislation outside of their indifference curves. The central premise of the veto player theory is unanimous rule. Since all veto players must unanimously support a bill for passage to occur, only legislation in the intersection of all the four indifference circles, the so-called winset, is likely to pass.Footnote 30 Inversely, bills outside of the winset are likely to be rejected by one or more veto players. This suggests that the area of the winset would have a significant impact on gridlock. By examining the winset from the 83rd to the 106th Congress, I test the following hypothesis:
Veto Players in the 104th Congress

HYPOTHESIS: The greater the area of the winset, the lower the level of gridlock in terms of policy output.
Data and method
I first examine the influence of the determinants of gridlock on legislative productivity as an auxiliary test, then study the impact of the same explanatory variables on change in policy output point. Independent variables in my study include the variables of the area of the winset, divided government, budgetary situation, public mood and start of term.
Dependent Variables
As for the variables of legislative productivity, I replicate the dependent variables in the analyses by Mayhew, by Kelly and by Binder, and also by Edwards and Barrett. Mayhew updates his list of significant legislation through 2002.Footnote 31 I tally the amount of significant legislation from the 83rd to 106th Congresses. Following Kelly’s method, I also calculate the volume of enacted laws with contemporaneous and retrospective significance based upon Mayhew’s data.Footnote 32 Binder taps the number of legislative agendas mentioned by the editorials in the New York Times and calculates the percentage of failed agendas.Footnote 33 I categorize these agendas into those either appearing once or twice in the editorials (Salience 1–2) or three to five times (Salience 3–5). Edwards and Barrett study major legislative proposals of the president and Congress, separately. I use the percentage of failed presidential and/or congressional proposals.Footnote 34
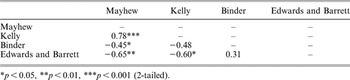
As Figure 3 shows, although the four measures of gridlock are related, there is a substantial variation among them. In contrast to other indicators, Mayhew’s rescaled variable shows a larger fluctuation in legislative productivity between the 89th and 93rd Congresses.Footnote 35 Nevertheless, the correlation matrix in Table 1 suggests that Mayhew’s variable of important laws is related to all other variables. The variables of Kelly and of Edwards and Barrett are related to all the variables except Binder’s. Thus, surprisingly, the variable used by Edwards and Barrett, which covers the percentage figures based upon a small amount of denominating legislative initiatives (see Table 2), is significantly related to the numerator-based variables of Mayhew and Kelly. Binder’s variable is related only to Mayhew’s variable with moderate strength.Footnote 36 This could be largely because of the uniqueness of Binder’s measurement, especially the measurement of the agenda denominator.
Gridlock in legislative productivity, 83rd–106th Congresses

Correlations Between Variables of Gridlock

*p < 0.05, **p < 0.01, ***p < 0.001 (2-tailed).
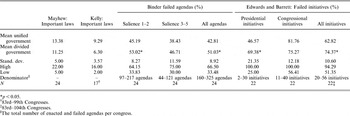
Mean Values of Gridlock in Legislative Productivity

*p < 0.05.
†83rd–99th Congresses.
‡83rd–104th Congresses.
§The total number of enacted and failed agendas per congress.
Apropos of gridlock in policy output, I examine the change in policy output point in a two-dimensional policy space and on a unidimensional policy continuum, separately. The policy output for a given congress in Euclidean space is measured by the scores of the Mean Winning Coordinate in Dimension 1 (Economic Policy Dimension) and Dimension 2 (Social Policy Dimension).Footnote 37 The Mean Winning Coordinate (MWC) covers a mean value of the dw-nominate scores of winning outcomes on all non-unanimous roll-call votes.Footnote 38 Given the uniqueness of the MWC, I also measure the policy output on a unidimensional continuum based upon my own calculation of the Americans for Democratic Action (ADA) scores. The ADA, a non-profit-making political organization advocating liberal and democratic values, selects several (usually twenty to forty) votes it considers the most important during that session.Footnote 39 Each legislator is scored from 0 to 100 depending upon the percentage of her votes in accordance with the ADA’s preference. In a somewhat similar manner, I code 1 for passed legislation that the ADA opposed and −1 for a passed bill it supported in a given legislative session. I calculate the mean value of the measured legislation in Congress.Footnote 40
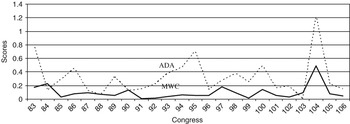
Thus, the policy output both in the ADA and MWC measures ranges from −1 to +1. For the ADA measure, the change in policy output point is measured by an absolute value of the distance between the ADA policy output in an examined congress and the ADA policy output in the previous congress.Footnote 41 Apropos of the MWC measure, the change in policy output point is measured by the distance between the vectors of the MWC policy output in an examined congress and in the previous congress.Footnote 42 As Figure 4 exhibits, the two measures of the change in policy output show a significant correlation (r = 0.65) and a similar pattern of movements. However, the ADA measure shows sharper fluctuations than that of the MWC measure. This is not surprising since the former is measured based upon a few selected bills that are the most ideologically controversial, but the latter is calculated from all non-unanimous roll-call votes.
The change in policy output in ADA and MWC scores

Independent Variables
In order to identify the winset in every congress, I measure the status quo point (Q) by the MWC score of policy output of the previous congress. For the ideal points of the override, filibuster and House median pivots under a Republican presidency, I tap the ideal points of the 67th, 41stFootnote 43 and 50th percentile legislators, respectively, based on Poole’s Optimal Classification scores in Dimension 1 and Dimension 2.Footnote 44 As for congresses under Democratic administration, I measure the ideal points of the 34th, 60th and 50th percentile legislators. As I elaborated in the previous section, I assume the four pivots’ circular indifference curves that pass through the status quo. In order to calculate the area of the winset, which is an intersection overlapped by all four indifference curves, I plot the indifference curves by using the Auto CAD program (see Appendix for the plots of each congress).Footnote 45
As for other independent variables, similar to the existing literature,Footnote 46 I incorporate public mood, budgetary situation, divided government and start of term. For the variable of public mood, I use the lagged value of Stimson’s public liberalism index.Footnote 47 As for the budgetary situation, I measure the budget deficit as a percentage of federal outlays. For the variable of divided government, congresses in divided government and unified government are coded as 1 and 0, respectively.Footnote 48 As for the variable of start of term, I coded 1 for the first two years of the presidential terms and 0 otherwise.
Findings
The mean values of the various measures of legislative productivity and t-test results, comparing periods of divided and unified government, are examined to test the impact of party control of the government on legislative productivity. Results appear in Table 2. According to the numerator-based measures by Mayhew and by Kelly, divided government produces a slightly smaller number of important laws. However, the difference in legislative productivity between unified and divided government is not statistically significant. As for Binder’s measures, legislative agendas, especially those with lower salience, are more likely to fail in divided government. For failed legislative initiatives measured by Edwards and Barrett, presidential initiatives are more likely to fail in divided government. However, congressional initiatives are more likely to fail in unified government, as Edwards and Barrett had previously reported.Footnote 49 Nonetheless, the difference is not statistically significant. As for the variation within the measures, it is not surprising to see that the numerator-based variables have a relatively smaller variation than the ratio-based measures.
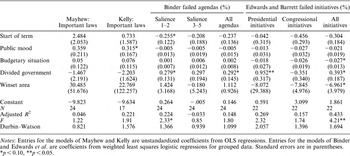
Next, the influence of the various determinants on legislative productivity is examined in the ordinary least squares (OLS) and Glogit models.Footnote 50Table 3 shows the results. As for Mayhew’s measure of the enacted laws with contemporaneous or retrospective importance, none of the independent variables is significant. Overall, the model performs poorly as the marginal value of the adjusted R 2 shows. Thus, under the Mayhewian measurement, divided government does not matter as Mayhew has recently reasserted.Footnote 51 In contrast to Mayhew’s dependent measure, the model of the volume of important laws measured by Kelly performs better, explaining 22 per cent of the variance in gridlock in legislative productivity. The moderate significance of the variable of public mood suggests that the government is more likely to enact important laws when public opinion is more supportive of an active government. Nevertheless, other variables are not significant. Thus, divided government has no impact on the number of enacted laws with contemporary and retrospective significance.Footnote 52
Determinants of Gridlock in Legislative Productivity, 1953–2000

Notes: Entries for the models of Mayhew and Kelly are unstandardized coefficients from OLS regressions. Entries for the models of Binder and Edwards et al. are coefficients from weighted least squares logistic regressions for grouped data. Standard errors are in parentheses.
*p < 0.10, **p < 0.05.
For Binder’s measurement, the model of the failed agendas with low salience shows some explanatory power (adjusted R 2 = 0.22). In this model, the variable of start of term is moderately significant (p = 0.06), suggesting that less salient legislative agendas are more likely to fail in the later two years of presidential terms. However, the variable becomes insignificant in the models of the agendas with higher salience and of all agendas. Also, the variable of divided government is significant, suggesting that less salient legislative agendas are more likely to fail in divided government than in unified government. In the model of all the agendas, divided government is still moderately significant (p = 0.06) but the model shows modest explanatory power.Footnote 53 In the model of the failed legislative agendas with higher saliency, none of the variables is significant.
Regarding Edwards and Barrett’s measures, only the variable of divided government is significant in the model of the presidential initiatives. This implies that the legislative agendas proposed by the president are more likely to be rejected in divided government. However, none of the variables is significant in the model of the congressional initiatives. Moreover, the combined model of the presidential and congressional initiatives performs substantially, explaining 43 per cent of the variance. The variable related to the budgetary situation is significant with p values of 0.06. Thus, legislative proposals are less likely to be rejected during the time when the government deficit is larger. The variable of divided government is modestly significant. However, this may merely imply the impact of divided government on presidential initiatives since the same variable is not significant in the model of congressional initiatives. Also, the variable of the area of the winset is moderately significant (p = 0.09). This suggests that the larger the area of the winset, the less likely are legislative proposals to fail.
Thus, the variable of divided government shows a significant impact only on the failed presidential initiatives measured by Edwards and Barrett and the failed legislative agendas with low saliency measured by Binder, but not on other measures. As for the variable of the area of the winset, it is significant only in Edwards and Barrett’s failed initiatives model. In contrast to other measures of gridlock, Edwards and Barrett’s measure is based upon a few important bills. Thus, the individualistic preferences of legislators become influential only on the enactment of a few, extremely important pieces of legislation. For the enactment of most legislation, however, the winset is not likely to have any impact, as the results of other models suggest.
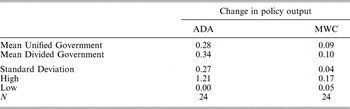
Turning to the change in policy output point, the mean values in the ADA and in the Mean Winning Coordinate (MWC) scores comparing periods of divided and unified government are examined. As the results in Table 4 show, the MWC scores show almost identical mean values of the change in policy output point in unified and divided government. The ADA measure shows slightly larger policy swings in divided government. Nonetheless, the difference is not statistically significant. Also, the ADA measure shows a higher variation than the MWC scores. Again, this is likely because the ADA measure is based upon a few, highly ideological pieces of legislation whereas the MWC scores are calculated from all non-unanimous roll-call votes.Footnote 54
Mean Values of Gridlock in Policy Output

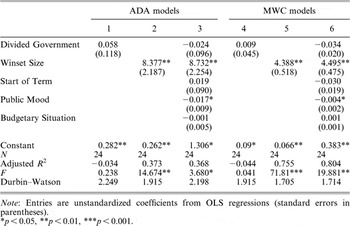
Next, I examine the influence of the various determinants on the change in policy output point. The results appear in Table 5. In the models of the ADA, the variable of divided government is not significant in the bivariate and multivariate models. In contrast, the variable of the area of the winset is highly significant both in the bivariate and multivariate equations. This shows that the policy output of enacted legislation is more likely to change when the indifference curves of the veto players’ preferences largely overlap. Thus, legislators’ individualistic preferences, rather than partisanship, are more likely to influence the policy swing.Footnote 55
Determinants of Gridlock in Policy Output, 1953–2000

Note: Entries are unstandardized coefficients from OLS regressions (standard errors in parentheses).
*p < 0.05, **p < 0.01, ***p < 0.001.
In the multivariate model, the variable of public mood is significant, but the coefficients are negative. Oddly, public support for an activist government weakens, rather than strengthens, the change in policy output. This may imply that the activist mood of public opinion pressures the Congress and president to pass legislation, which impels a modification of legislation to a less drastic, pro-status quo policy in the bargaining process, as Schattschneider indicated.Footnote 56
The models of the MWC exhibit similar results to the results of the ADA models. The variable of public support is significant with a negative coefficient value. The variable of divided government is not significant in either model. Again, the variable of the area of the winset is significant both in the bivariate and multivariate specifications.Footnote 57 Overall, both the models of the ADA and the MWC perform well.
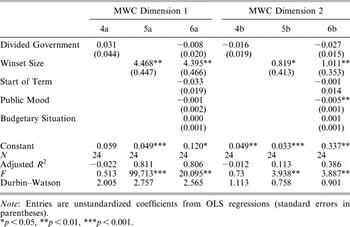
Next, the influence of the same explanatory variables are examined in unidimensional models of Dimension 1 (Economic Policy Continuum) and Dimension 2 (Social Policy Continuum), separately. The results are in Table 6. The variable of public mood becomes insignificant in the multivariate model of Dimension 1 while remaining significant in the model of Dimension 2. This could indicate that the legislation of social issues is more likely be modified and passed.
Determinants of Gridlock in Policy Output: Unidimensional Models

Note: Entries are unstandardized coefficients from OLS regressions (standard errors in parentheses).
*p < 0.05, **p < 0.01, ***p < 0.001.
The variable of divided government is not significant in either model. Thus, even in the economic policy issue, in which partisan polarization has been intense, party control of the government has no effect. The variable of the area of the winset is highly significant both in the models of Dimension 1 and Dimension 2, and the significance remains solid regardless of whether the variable is in the bivariate or multivariate model. However, the winset appears to have a larger, approximately quadruple, impact on economic issues than on social agendas. Thus, for decision makers, economic issues are likely to be more important and less open to compromise than social issues. This finding is compatible with Poole and Rosenthal’s observation of the asymmetry between legislators’ voting decisions on economic and on social issues. Poole and Rosenthal note that legislators place differing importance on each dimension, and argue that their voting behaviour is more consistent in the economic dimension than in the social dimension.Footnote 58 Evidently, this is not to say that the social issues are irrelevant. The variable of the winset in the model of Dimension 2 is substantially significant both in the bivariate and multivariate term, and their coefficients show a sizeable impact on the change in policy output point in the social issue dimension. Therefore, the legislators’ ideology in the social policy dimension has a significant impact on the policy content of legislative output.
Conclusion
Since Divided We Govern, the gridlock literature has been centred on legislative productivity with various measures. Nonetheless, the significance of legislation could hardly be measured by the volume or ratio of enactment of laws because of the varied, and often elusive, importance of laws. In this study, I have examined the influence of divided government and the veto players’ indifference curves on the change in policy output point. The findings in my study revealed the impact of the area of the winset, but not divided government, on policy swing. Thus, as Mayhew argues, the conditions of party control of the American government have no influence on policy output.Footnote 59 Unified government produces a pro-status quo policy to the same degree as divided government.
However, the impact of the area of the winset suggests that policy output could significantly change when the winset is large. The two factors could influence the area of the winset. First, if the status quo position is distant from the veto players’ ideal points, the larger distances will increase the size of veto players’ indifference curves and expand the area of the winset. Secondly, if the veto players’ ideal points are proximate, their indifference curves are more likely to overlap and result in a larger winset. The influence of the area of the winset indicates that individualistic preferences of legislators, rather than party control of the government, have an impact on the change in policy output point. Therefore, inasmuch as the policy content of legislative enactments is questioned, gridlock is caused not by divided government but by the distance between the veto players’ preferences and by the proximity between the status quo point and the veto players’ preferences. This suggests that the growing ideological polarization in the US Congress today heightens gridlock through the decreasing number of moderate legislators and the increasing distances among the veto players’ preferences, regardless of whether the government is unified or divided.
As for legislative productivity, my findings showed no impact either of divided government or the winset on most measures. However, divided government and the area of the winset appeared to have a substantial effect on legislative proposals by the president or Congress. This may indicate that the legislative initiatives could partially reflect policy change as well. Since these legislative initiatives are extremely important proposals made by the president or Congress, they are likely to be putting forward a substantial policy shift. For the effect of divided government on legislative initiatives, party leaders and the president, who have limited resources to influence legislators, may focus on these legislative initiatives to influence party members. Since the legislative proposals by the president or Congress are the most salient legislative agendas, the voting results of these bills symbolize the effectiveness and responsiveness of the parties and the presidency. Also, divided government appears to have an effect on the passage of legislative agendas of low salience as well. This may indicate that legislation of marginal importance often proceeds in a partisan fashion. As for the legislative agendas of ordinary importance, however, my study did not find an impact of divided government.
In my study overall, the models of policy output performed better than the models of legislative productivity. This may imply an elusiveness of the concept of the latter. It remains oblique what the amount of enacted laws can tell us. Legislative bills have varied significance and policy impact. The volume of legislative enactments is hardly equivalent to the size of the impact of legislation. Therefore, greater attention to the policy output of legislation would be highly conducive to the study of gridlock. While this study has focused on the aggregate policy output per congress, future research on the policy outcomes of each piece of legislation is likely to be worthwhile. However, such a disaggregate analysis would require a critical task of measuring the ideal points of the policy output and the status quo for each bill.
Appendix: Indifference Curves 83rd–106th Congresses

 .