





Introduction
Get-Out-the-Vote (GOTV) experiments represent a vital area of research within political science, aimed at understanding strategies to enhance voter participation. Drawing from field experiments, this body of work evaluates the efficacy of various mobilisation techniques, shedding light on voter behaviour and electoral engagement. A foundational study by Gerber and Green (Reference Gerber and Green2000) pioneered the use of randomised controlled trials to assess voter turnout interventions in the United States. They found that face-to-face canvassing is significantly more effective in increasing voter participation compared with telephone calls or direct mail. These findings spurred numerous subsequent studies replicating and extending their methodology to different contexts (Green et al. Reference Green, McGrath and Aronow2013).
However, little has been said about the ability of similar-style mobilisation campaigns to encourage participation in other types of civic engagement (Peixoto et al. Reference Peixoto, Sjoberg and Mellon2020). In particular, no research yet exists on the application of GOTV-style recruitment to the optimisation of civic lotteries utilised in mini-publics.
Deliberative mini-publics (DMPs) are ‘carefully designed forums where a representative subset of the wider population come together to engage in open, inclusive, informed and consequential discussions on one or more issues’ (Curato et al. Reference Curato, Farrell, Geissel, Grönlund, Mockler, Pilet, Renwick, Rose, Setälä and Suiter2021: 3). Initially, the idea of a mini-public remained a niche academic proposition, with rare pilots mostly organised by universities at the local level. Over the past 15 years, we have observed an explosion of mini-publics at multiple levels of governance aptly termed a ‘deliberative wave’ (see Figure 1).
The number of mini-publics per year.
Source: OECD (2023), a crowd sourced dataset, most likely underestimating the phenomenon.

Propelled by this wave and by high-profile national cases such as the citizens’ assemblies in Iceland (2009), Ireland (2012), and France (2019), mini-publics have gained popularity beyond small circles of scholars and advocates. From The Guardian, The New York Times, to the Hindustan Times, major newspapers around the world have covered stories on mini-publics showcasing the global interest in this topic (NYT 2017; Hindustan Times 2021; Guardian 2023). Many social movements and activists envision mini-publics as a solution to the current crisis of democracy (Mellier and Smith Reference Mellier and Smith2024).
However, the existing recruitment technology used in mini-publics has significant limitations and struggles with creating representative samples of the population (Spada and Peixoto Reference Spada and Peixoto2025). In particular, acceptance rates for invitation letters are extremely low (the median acceptance rate in the Organisation for Economic Co-operation and Development (OECD) database is 4%, and 90% of the cases have an acceptance rate of below 10% [OECD 2023]). This recruitment gap weakens claims that participants are a representative sample of the population.
This article explores the possibility of applying the GOTV strategy to optimise the recruitment campaign of a real-life Citizens’ Assembly implemented in Southampton in 2023. Unlike voting, citizens’ assemblies require a much higher level of commitment and engagement from the individual, making registration potentially highly costly in terms of time and money. Further, the likelihood of registration is not distributed equally. Although studies have found general support for citizens’ assemblies, especially from those who are politically dissatisfied, feel less politically competent, and those with lower levels of education, willingness to participate is higher amongst those already more politically engaged and with higher levels of education (Walsh and Elkink Reference Walsh and Elkink2021; Pilet et al. Reference Pilet, Bol, Vittori and Paulis2023). Given that achieving diversity of participants, or sometimes descriptive representation, is held as a key principle in recruiting for citizens’ assemblies, this uneven distribution is problematic not only as it may result in the absence of certain voices from the discussion, but it also risks undermining the legitimacy of the assembly itself. As such, finding mechanisms to increase the registration rate, or overcoming barriers to non-registration in those subgroups with low propensity to register, is a considerable concern for proponents of citizens’ assemblies.
We explored the impact of door-to-door canvassing on registration for the 2023 Southampton Citizens’ Climate Assembly (SCCA). Using randomised clusters of addresses that received assembly invitations, we mobilised door-to-door canvassers to attempt to contact 1,224 households over the 10 days before registration closed. The canvassing involved two steps; the first was a reminder about the invite, and discussion about the SCCA, including the opportunity for members of the public to ask questions. The second step involved an optional survey regarding motivations for registering or reasons for not registering for the assembly, as well as collecting demographic and attitudinal data to match that collected in the registration survey.
We took a two-fold approach that enabled us to understand if door-to-door canvassing is effective at increasing registration and whether it is more or less so when targeting specific groups. Combining the registration and survey data allows us to compare the registration rate between those who received a door-knock and those who did not. We explore differences in demographics and attitudinal variables of those who registered and those who did not, including those who registered after being canvassed. Lastly, we analyse the reasons given for not intending to register, as well as what would motivate a person to register, to identify what barriers to participation exist, for whom, and how they might be mitigated through assembly or recruitment design.
We find that door-to-door canvassing is an effective way to increase assembly registration, albeit the overall effect is quite small. Evidence from our doorstep survey suggests that those who do not register are different from those who do, particularly in terms of their voting behaviour, confidence in government, and level of climate concern. Canvassing was able to increase the registrant pool in several under-represented categories; however, it is clear that some barriers to participation require stronger interventions to overcome them. The interview segment of the survey revealed limitations on individuals’ capacity to participate due to the level of commitment required and perceived costs. In addition, interest in the topic and other beliefs about the assembly represent clear differences between those who registered and those who did not, again highlighting the low efficacy of the invitation. Together these suggest that, while canvassing can certainly be used to increase the registration rate, a greater focus on innovation design and communication may overcome more immediate barriers. Many recipients did not open the letter and were unaware of the financial incentive of £340 and commitment by politicians to implementation, and it was clear that for those with busy working lives, giving up weekends in between two full weeks’ work was a significant deterrent.
Unlike voting, which is an activity many citizens do engage with, and many have engaged in at least once, participating in innovative deliberative political institutions based on sortition processes is by design not routine, nor an activity many citizens have come into direct contact with. Assembly recruitment will need to diversify communications, accommodate participation in a greater variety of ways including more flexible time commitments, and clarify their impacts. Once the process is made more accessible and understandable, individuals can instead consider whether they want to participate, rather than if they can, and this in turn will improve the efficacy of recruitment campaigns.
Addressing low response rates to invitations to deliberate
Citizens’ assemblies are a family of DMPs that recruit participants using a stratified random sample of the population. They seek ideally to mirror the population (Fishkin Reference Fishkin2009), promote the inclusion of groups that traditionally do not participate enriching the diversity of the participants (Buchstein Reference Buchstein2010; Landemore Reference Landemore2013), and prevent organised interest groups from capturing the process (Bagg Reference Bagg2024). However, these ideal objectives are difficult to achieve in practice. In the absence of a mandatory requirement to participate, high levels of refusal to participate in the process might weaken the claim of representativeness and inclusion.
Looking at the OECD 2023 Deliberative Database (OECD 2023), which collects data on acceptance rates of deliberative processes, we notice that, at the time of writing, of the 343Footnote 1 reported cases that provide information (around 50% non-reporting) the median acceptance rate is 4%. Ninety per cent of the cases have an acceptance rate below 11%, and only four cases report an acceptance rate above 40%. With 90% of the population refusing to participate in 90% of the existing tracked cases, we can see that the magnitude of the problem is significant, and the claims of representativeness and inclusion in citizens’ assemblies problematic (although this often depends on the baseline for comparison with other political processes).
Although the empirical problem is significant, the literature exploring reasons for non-participation in mini-publics remains underdeveloped. Some case studies document reasons given by non-participants, such as a lack of interest, personal reasons like work and family commitments, or health issues (Font and Blanco Reference Font and Blanco2007: 564). In a more systematic American experiment (Neblo et al. Reference Neblo, Esterling, Kennedy, Lazer and Sokhey2010), respondents who indicated they were ‘Not too interested’ or ‘Not at all interested’ in participating in deliberative events were asked to select reasons for their lack of interest. The four most frequently chosen justifications were: ‘Do not know enough to participate’, ‘Too busy’, ‘Dislike conflict’, and ‘Will not lead to a binding decision’. Jacquet (Reference Jacquet2017) conducted in-depth interviews with 34 citizens who refused to participate in three different mini-publics in Belgium, identifying six explanatory logics of non-participation: concentration on the private sphere, internal political inefficacy, public meeting avoidance, scheduling conflicts, political alienation, and the perceived lack of impact of mini-publics on the political system.
So far, the literature has gathered limited evidence on the reasons why citizens refuse to participate in mini-publics and has also not explored mechanisms to increase the acceptance rate. This study is the first to leverage a multimethod approach, combining a field experiment designed to adapt the GOTV experimental framework to study participation in a DMP with additional interviews. We conducted doorstep interviews with the citizens who were invited but declined to participate, exploring not only the reasons for their refusal but also what might motivate them.
The literature on GOTV experiments is one of the most prolific in political science. The studies investigate how different types of messages and leveraging different media can promote turnout in elections (Gerber and Green Reference Gerber, Green, Banerjee and Duo2017; Bhatti et al. Reference Bhatti, Dahlgaard, Hansen and Hansen2019). The first GOTV field experiments were conducted in 1924 on voter registration and turnout in Chicago (Gosnell Reference Gosnell1927); however, it was only with the 1998 New Haven experiment by Gerber and Green (Reference Gerber and Green1999), and their subsequent work on the topic, that the methodology was systematised. Since then, hundreds of GOTV experiments have been conducted for various election campaigns around the world.
By contrast, the literature on democratic innovations has rarely incorporated experiments to explore how to improve citizens’ participation and studies to increase engagement in other participatory settings have been met with mixed results. Wittels (Reference Wittels2025) utilised a large-scale, randomised field experiment to explore multiple mobilisation methods for a citizen consultation survey. She found that both symbolic and financial incentives, framing to increase efficacy by communicating prior impact, and efforts to increase trust by deanonymisation of the consultation lead, all significantly and unexpectedly reduced participation rates. Yet, Hock et al. (Reference Hock, Anderson and Potoski2013) found phone call invitations increased attendance rates to a civic meeting, albeit largely among stakeholders and business owners, while postcards containing a promotional message about the value of citizen input had no significant effect. The most closely related study to ours by Peixoto et al. (Reference Peixoto, Sjoberg and Mellon2020) examines the impact of sending multiple reminders (email and text), financial incentives, and varying message content, on voting in a digital participatory budgeting project. They find that although all treatments significantly increased voter turnout (a pooled effect of +4.7 percentage points), the reminders, regardless of message content, were the most effective method for increasing turnout, whereas lottery entry was the least effective.
We return to a potential inspiration from survey recruitment methods in our final discussion, yet our focus here is on how methods effective for recruitment to traditional empowered political participation (voting) translate to the similar aspirations for DMPs. Unlike more consultative forms of participation, DMPs are conceived by advocates and scholars to be qualitatively different – seeking to embody a more empowered participatory political decision-making (Ryan and Smith Reference Ryan, Smith, Grönlund, Bächtiger and Setälä2014; Curato et al. Reference Curato, Farrell, Geissel, Grönlund, Mockler, Pilet, Renwick, Rose, Setälä and Suiter2021). This is often explicit in their framing with relevant political executives committing to implementing recommendations, as was the case in the SCCA. These promises have proved controversial when met with the political realities of policy implementation elsewhere, as in the French case (Courant and Reber Reference Courant and Reber2025). Our ‘Get-Out-to-Deliberate’ (GOTD) experiment builds on these studies by exploring the strongest and most consistent approach identified by the GOTV literature to promote turnout in elections; personal canvassing (Green et al. Reference Green, McGrath and Aronow2013; Gerber and Green Reference Gerber, Green, Banerjee and Duo2017) to see whether registration rates for mini-publics can be increased.Footnote 2
Experimental design
Door-to-door canvassing is the strongest treatment identified by the GOTV literature, therefore testing the effects of this intervention allows us to establish a first benchmark that can provide insights into other treatments, which are consistently found to have weaker effects.
Our prior assumption regarding the relative perceived net benefit of voting versus participating in a DMP is that voting currently generates a higher net benefit, given that the percentage of the population that votes is significantly higher than the percentage of people who accept an invitation to a DMP. This is not surprising, considering how little experience with, or knowledge about, DMPs people are likely to have compared with elections, and that participation in a DMP requires attending multiple events (in our case, four in-person events and one online event), public speaking, and significant effort, albeit with remuneration.
The door-to-door canvassing experiment took place as part of the recruitment stage for the 2023 SCCA. To recruit approximately 42 participants for the assembly, 8,000 invitations were sent out to randomly selected addresses across the city of Southampton inviting recipients to register their interest in taking part. The Sortition FoundationFootnote 3 performed the initial randomisation and identification of addresses using an algorithm designed to improve the fairness of the sortition mechanism (Flanigan et al. Reference Flanigan, Gölz, Gupta, Hennig and Procaccia2021). To make door-knocking possible, addresses selected for canvassing needed to be closer together than would be by randomly selecting 8,000 addresses across the city. Given this, a clustering procedure was carried out by the Sortition Foundation in line with procedures they used previously in field conditions where canvassing to increase registration for other assemblies was piloted but not evaluated. In a first step, 14Footnote 4 addresses were randomly selected from the Royal Mail database within the relevant jurisdiction and their postcodes extracted. The final digit of these postcodes was then removed to create larger areas, or clusters. Each cluster then contained multiple postcodes within a relatively close vicinity. Finally, 3,000 addresses were randomly selected from within those clusters to receive an invitation.
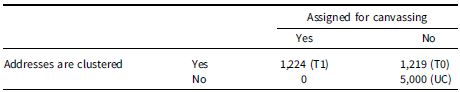
For the study, one cluster, containing 557 addresses, was excluded as it consisted exclusively of inaccessible student halls.Footnote 5 The remaining 13 clusters were then block-randomised into a control group and a treatment group. All the addresses within the treatment group which had received an invitation were assigned to be canvassed. Clusters were block randomised at the cluster rather than household level for canvassing both to enable more efficient canvassing and to limit the potential risk of spillover effects between treated and untreated addresses.Footnote 6 Table 1 reports the number of addresses in the un-clustered (UC), treatment, and control groups. Our analysis below focuses on the comparison of this treatment and control group, although we compare the UC and clustered addresses as a robustness check and to confirm that clustering in itself is unlikely to be the source of any difference in registration rates.
Treatment assignment

Table 1. Long description
A table with two rows and three columns. The rows are labeled ‘Addresses are clustered’ with options ‘Yes’ and ‘No’. The columns are labeled ‘Assigned for canvassing’ with options ‘Yes’, ‘No’, and corresponding values. Row 1: Addresses are clustered Yes, Assigned for canvassing Yes, 1,224 (T1); Assigned for canvassing No, 1,219 (T0). Row 2: Addresses are clustered No, Assigned for canvassing Yes, 0; Assigned for canvassing No, 5,000 (UC).
The 8,000 invitations were sent on the 18th of September, with door-to-door canvassing starting on the 29th of September and ending on the 8th of October, the day before registration for the assembly closed. By starting to canvas several days after the majority of invitations had been received and acted on (see Figure B1 in Appendix B), we can compare registration rates across treatments before canvassing began to check that the treatment groups are otherwise comparable.
Door-knocking procedure
Nine canvassers were hired and were given training to use the script and data collection software, a Qualtrics (2024) survey, as well as to build confidence in speaking with members of the public. Each day, the canvassers were assigned address lists from the treatment group to work through in two-hour blocks based on their availability. For safety, the canvassers worked in pairs during daylight hours and were asked to stop if weather conditions became poor. All canvassers were fluent in English and were re-paired regularly. The canvassers were also given lanyards and bags displaying the university logo so that they were less likely to be confused for salespeople or other types of canvassers. The process and number of respondents engaged at each stage is visualised and described in Figure 2 below.
Diagram – Experimental Design.

The canvassing process was split into three stages. In the first stage, canvassers introduced themselves and their reason for knocking, before asking if the respondent was willing or able to speak to them, and if they were eligible to register for the SCCA. The eligibility criteria included being a resident of the address and being at least 16 years old. If willing and eligible to continue, canvassers proceeded to the second stage, or treatment stage, in which they worked through a flexible script based on the responses to questions (see Appendix C). In the third stage, the respondent was first interviewed about their motivations and/or concerns for registering to participate in a citizens’ assembly, followed by an optional survey (either verbally with answers recorded by the canvasser, on the canvasser’s data-collection device, or using a paper copy). The survey was designed to replicate the questions asked by the SCCA registration survey so that demographics between those who did and did not register could be compared.
The level of interaction was recorded on the canvasser’s data collection device, including whether a door was successfully knocked and answered or not, and, if answered, whether the respondent was able to continue speaking (proceed to the script). The reasons given for not knocking on a door were also collected to identify methodological concerns with door-to-door canvassing.
As the aim of canvassing was to encourage registration for the SCCA, canvassers were provided with information to be able to answer questions the respondent might have about the assembly, as well as resources to hand out, such as copies of the invitation letter and an informational leaflet. This creates some variation in the level of treatment respondents received; while some may have answered the door and not wished or had no time to speak with the canvasser, they may still have taken a copy of information encouraging them to attend. As such, the analysis includes results for both those who were ‘treated’, meaning that they proceeded to the treatment stage of the canvassing procedure, and ‘contacted’ meaning that they opened the door to a canvasser. As the canvassers wore SCCA logos, handed out leaflets, and introduced themselves with the purpose of talking about the SCCA, it is possible that even this low level of interaction encouraged a respondent to register through a visual or verbal reminder.Footnote 7
Results
Contact rates and non-compliance
All 1,224 doors in the treatment group were added to the list to be canvassed. Canvassers were advised to attempt to knock on a door so long as it felt safe and they were able to do so. Once a first attempt had been made to reach each address on the list, those that were knocked but not answered received a second knock (addresses marked as unsafe or unable to knock were not re-attempted).
Of the 1,224 addresses on the list, 794 (64.9%) received at least one door-knock attemptFootnote 8 , leaving 430 (35.1%) not attempted or failed (see Appendix A for a more detailed look at reasons for non-contact). A total of 461 of the doors that were knocked on were answered, or ‘contacted’, and 293 of those were fully treated.Footnote 9 As a result, 37.7% of addresses in the treatment group received some contact from a canvasser, with 23.9% receiving the full treatment script. This level of contact is comparable to other door-to-door canvassing-based studies, albeit contact rates across studies vary considerably (see Gerber and Green Reference Gerber, Green, Banerjee and Duo2017 for an overview).
Registration rates
Members of households had until the 9th of October to register their interest to participate in the assembly, either via the link on their invitation letter or by calling a number dedicated to registration managed by the Sortition Foundation. A person could register to participate so long as they met the eligibility criteria, could commit to participating on the required dates, and were willing to respond to the registration questionnaire. More than one person in a household was able to register; however, this only happened in two cases.Footnote 10 Registration did not guarantee selection to participate; once the registration window had closed, 42 participants were selected from the registration pool by sortition, with 37 of those selected participating in the assembly.
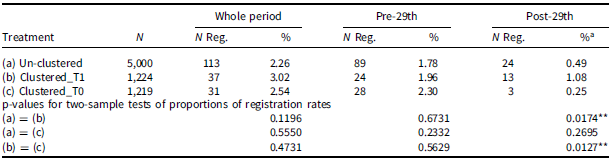
Table 2 reports the registration rates for the included clustered and UC addresses by treatment and time period. Registration rates are separated by time period as canvassing did not start until the 29th of September, meaning those in the treatment group could register before the intervention. As expected, the majority of registrations in all groups occurred in the immediate days after receiving an invitation, and several days before canvassing began (see Appendix B, Figure B1).
Registration rates by treatment

Table 2. Long description
The table compares registration rates by treatment and time period. It has 4 rows and 7 columns. The columns are labeled Treatment, N, Whole period N Reg., Whole period %, Pre-29th N Reg., Pre-29th %, Post-29th N Reg., Post-29th %, and Post-29th %a. The rows are labeled (a) Un-clustered, (b) Clustered_T1, (c) Clustered_T0, and p-values for two-sample tests of proportions of registration rates. Row 1: Un-clustered, 5000, 113, 2.26, 89, 1.78, 24, 0.49. Row 2: Clustered_T1, 1224, 37, 3.02, 24, 1.96, 13, 1.08. Row 3: Clustered_T0, 1219, 31, 2.54, 28, 2.30, 3, 0.25. Row 4: p-values for two-sample tests of proportions of registration rates (a) = (b), 0.1196, 0.6731, 0.0174**. Row 5: (a) = (c), 0.5550, 0.2332, 0.2695. Row 6: (b) = (c), 0.4731, 0.5629, 0.0127**. The table shows registration rates for different treatments and time periods, with notable differences in rates before and after the 29th.
Notes: a Percentages are calculated based on the remaining number of unregistered addresses once canvassing had begun. ***, **, and * indicate statistical significance at the 1%, 5%, and 10% levels, respectively.
First, we test for significant differences in registration rates between the clustered and UC addresses before the 29th of September, and further between the UC addresses (a) and the clustered control group (c) throughout the canvassing period. The comparisons find no significant differences between these groups, indicating that the process of clustering the addresses is unlikely to have affected registration rates and that the populations selected by clustering behave similarly, ie the households within clusters are not more likely to register for the assembly than addresses that have not been clustered.
To assess the effect of canvassing, we then focus on the comparisons of the clustered control (c) and the treatment (b) groups only for the remainder of the analysis. There are no significant differences between the registration rates of (c) and (b) prior to treatment, suggesting that there are no large systematic differences between the clustered groups that would make a household in one group more likely than in another to register for reasons other than contact with a canvasser. By contrast, registration rates in the treatment group (b) are larger and significantly different from those in the control group following canvassing.Footnote 11
Although there is no significant difference between the treatment and control groups when looking at the entire period, this is unsurprising given that the registration behaviour between the two groups did not differ before canvassing began and as the majority (62.3%) of the treatment group experienced the same lack of contact as those in the control group. The registration rates for those who were contacted or treated after the 29th of September (2.60% and 2.73%, respectively) are considerably larger than for those who were not treated in the treatment group (0.11%) or who were in the control group (0.25%) in the same period.
As our main interest is the comparison of the control and treatment group during the period of canvassing, we calculate the intention-to-treat (ITT)Footnote 12 effect size as 0.83 percentage points. Note that the true effect of canvassing is underestimated as a considerable portion of those assigned to the treatment group could not be contacted. Using the method detailed in the study of Gerber and Green (Reference Gerber and Green1999) to account for the level of treatment within the treatment group by dividing the ITT effect by the compliance rate, we calculate the adjusted treatment effect as 2.21 percentage points when using the more conservative contact rate (doors answered).Footnote 13 This effect size is similar to those identified in GOTV studies of around 2.54 percentage points (Green et al. Reference Green, McGrath and Aronow2013), which is larger than expected, given the much higher personal cost involved in attending a citizens’ assembly and that we were targeting those who were already less likely to register (given that they chose not to at an earlier stage).
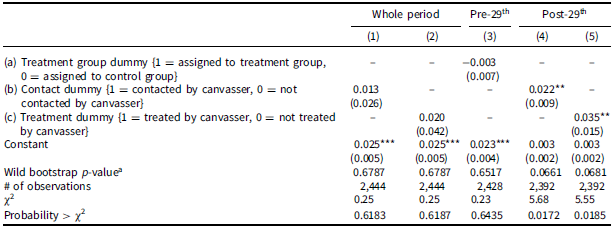
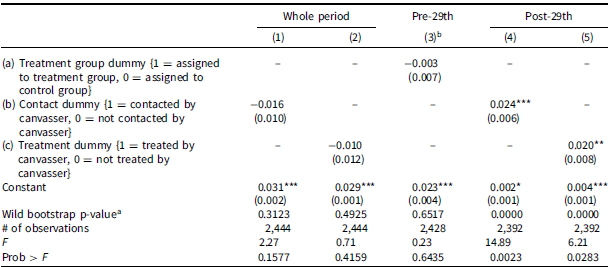
Regression analysis supports these findings. Table 3 shows two-stage linear regressions with treatment assignment as an instrumental variable to estimate the effect of being contacted, or treated, on registration while controlling for the possibility that those who canvassers are able to reach more easily may also be more likely to register (see Gerber and Green Reference Gerber and Green2000 for further explanation of the endogeneity problemFootnote 14 ). We run regressions with registration as the dependent variable and include a discrete variable for successful contact (or treatment) as an independent variable. The contact (treatment) variable captures those who were successfully contacted (treated) by a canvasser and who had not already registered. By excluding those who had registered before being contacted, we avoid misattributing registration to canvassing when it could not be the case, even if registration occurred during the canvassing timeframe.Footnote 15 We also include a linear regression with a discrete variable for treatment assignment before canvassing began to confirm that those in the treatment group were no more or less likely to register than those in the control group prior to the canvassing period. All regression analyses include only data from the clustered addresses, with standard errors clustered by canvassing region (cluster ID).
Treatment effects of canvassing

Table 3. Long description
A table showing regression analysis results of treatment effects of canvassing on registration. The table has 5 columns and 6 rows, including headers. The columns are labeled as Whole period (1), Whole period (2), Pre-29th (3), Post-29th (4), and Post-29th (5). The rows are labeled as Treatment group dummy, Contact dummy, Treatment dummy, Constant, Wild bootstrap p-value, and # of observations. Each cell contains numerical values with standard errors in parentheses where applicable. The table presents the coefficients and their significance levels for different variables related to the treatment and contact by canvassers on registration rates.
Notes: a P-value for the respective treatment or contact variable (a, b, or c) when standard errors are estimated using wild boot-strapping with 999 replications. Columns 1, 2, 4, and 5 show two-stage regression estimates with the dummy for treatment group as the instrumental variable. Column 3 shows individual-level linear regression estimates. All estimates have standard errors clustered by canvassing region (cluster). Columns (1) and (2) include data for the whole registration period. Column (3) excludes data for those who registered after the 29th of September. Columns (4) and (5) exclude data for those who registered prior to the 29th of September. ***, **, and * indicate statistical significance at the 1%, 5%, and 10% levels, respectively.
In line with the findings of Table 2, when looking at the whole period (columns 1 and 2) or the period before canvassing began (column 3), neither treatment assignment, contact with a canvasser, nor full treatment are significant predictors for registration. To exclusively compare behaviour in the timeframe after canvassing began, we exclude those who had already registered prior to the 29th of September in both the treatment and control groups. As such, the analysis in columns (4) and (5) compares the behaviour of those in the treatment and control groups who had not already registered at this stage.
Whether using contact or full treatment variables in the model, both see a positive and significant effect for registration after the 29th of September. Due to the small number of clusters in this study, we further conduct a robustness check using wild bootstrap standard errors, a method recommended for experiments with fewer than 30 clusters and/or unbalanced cluster sizes (Cameron et al. Reference Cameron, Gelbach and Miller2008). The treatment coefficients for models 4 and 5 remain significant, but only at the 10% level. When conducting similar analysis using ordinary least squares (OLS) regression (see footnote 14), the significant results also survive the inclusion of fixed effects and bootstrapped standard errors.Footnote 16 Of course, given the restrictions on data collection and analysis imposed by data structure, these results should still be interpreted with due care. Nevertheless, while registration rates among those who did not have contact with a canvasser, whichever treatment group they were assigned to, are similar, for those who did speak with a canvasser they are significantly higher, supporting the hypothesis that door-to-door canvassing had a positive effect on registration for the SCCA.
However, it is worth considering the value of canvassing. Although the effect size is relatively large compared with the baseline registration levels found in the control and UC groups, the absolute registration level remains quite small. In this instance, the average cost of an additional registration via canvassing was £261.02 (the cost of labour and materials divided by the number of people who registered after contact with a canvasser). This figure is considerably higher than the estimated cost per vote in a GOTV canvassing campaign, closer to $33, which is largely due to the higher baseline propensity to vote compared with registering for a citizens’ assembly, resulting in a more favourable contact-to-vote rate (Green and Gerber Reference Green, Gerber, Gerber and Green2019). Whether this cost is worth it will depend on how low the base registration rates are and who canvassing encourages to register, as these factors may be critical for attracting a sufficiently sized and intersectional registrant pool from which to draw participants. Given this cost, cheaper alternatives to door-knocking suggested by the survey methodology literature might be worth considering, such as personalised lettersFootnote 17 , pre-notification letters, and trust-building communication styles (Scott and Edwards Reference Scott and Edwards2006; Woolf and Edwards Reference Woolf and Edwards2021; Greenberg and Dillman Reference Greenberg and Dillman2023). However, because we uncovered that many recipients did not open the letter, those approaches are likely to have small effects on registration.
Who registered?
Democratic innovations that utilise sortition rely on having a large enough participant pool to draw a representative, intersectional sample. Should the registration pool be too small or unrepresentative of certain demographics, it can be difficult or even impossible to reflect a population in those selected. We found that canvassing was effective at increasing registration rates, albeit by a small amount; we now explore for who.
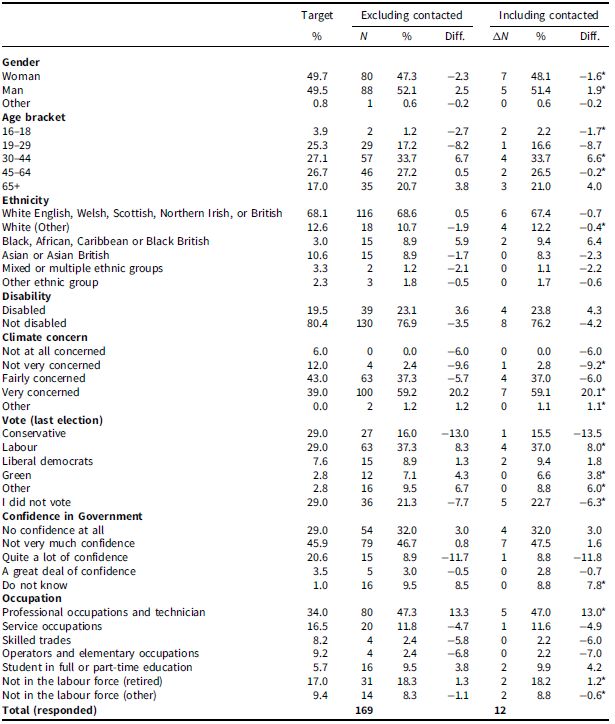
For the SCCA, selection to the assembly from among those who registered was based on representation across eight variables; gender (3), age (5), ethnicity (6), disability (2), climate concern (5), voting history (6), confidence in government (5), and occupation (7), where the numbers in parentheses indicate the number of categories for each variable. Given that data are not available for those who did not register aside from those who completed our survey after having been treated, we start by identifying which demographics were under-represented in the participant pool when excluding those who were canvassed (N = 169); a full demographic breakdown is available in Appendix B (Table B5).Footnote 18
We note that there are higher levels of under-representation amongst the attitudinal variables, including confidence in government, climate concern, and voting history. In particular, the assembly struggled to attract those who answered any level lower than the highest level of concern for climate change, voted Conservative or did not vote at the last election, and who had higher levels of confidence in government. Some categories saw very low recruitment levels altogether; for example, the number of registrants with lower levels of climate concern is so small that there would be insufficient numbers to reflect the targeted 6% and 12% in those categories at the final assembly, even if all registrants who gave those answers were selected. In addition, five categories exceed the minimum targeted amount by only one person, restricting the combinations of participants possible.
When including those who registered after being canvassed (N = 12), participant numbers increase in 12 of the 20 underrepresented categories, and, in 6 of those categories, the resulting shift in demographic representation is in the direction of the SCCA targets. For some variables, the increases in registration by under-represented groups were outweighed by increases in other categories. There are also relatively large increases in registrations for specific under-represented categories, with the following seeing increases of more than 10% compared with the number already in the registrant pool: 16–18-year-olds, those who selected ‘White (other)’ as their ethnicity, those who were ‘not very concerned’ about climate change, those who did not vote, and those not in the labour force for reasons other than retirement.Footnote 19 Although partly reflective of the much smaller baseline numbers in the registrant pool, overall, the average percentage gains in the under-represented categories are much larger than in the over-represented categories (11.3% compared with 6.4%).
Having said that, including those who were canvassed also increases the registrants for 15 of the 19 over-represented categories, and the average change in the representation of under-represented categories is only 0.1%, with more categories being classified as under-represented when including the contacted registrants than when excluding them.
While it is not possible to make any robust claims due to the small sample size, it does not appear that canvassing led to an overall more representative registrant pool in this instance, although we do see that it increased the number of registrants from certain under-represented demographics. By increasing the number of registrants across a diverse range of categories (27 of the 39 categories saw increases in this study, despite only a small absolute change in registrations), more combinations of registrants become possible for selection, thereby increasing the potential for greater intersectional representation.
Who did not register?
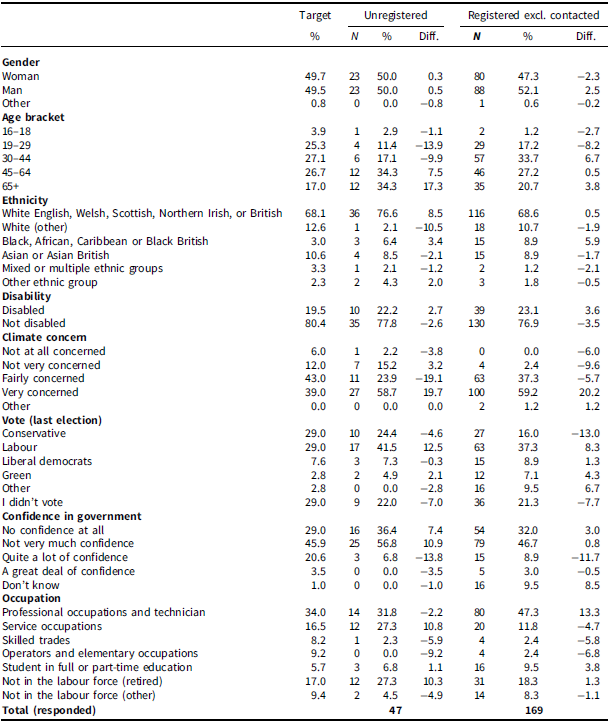
We have access to demographic data from two sources, the SCCA registrant pool and those willing to answer the survey on the doorstep. Given this, we can make some descriptive comparisons between those who registered (excluding those who were contacted) and those who did not. In total, 48 respondents were willing to continue to this segment of the survey which came at the end (see script B in Appendix C), 47 of which were unregistered at the time of treatment. A full comparison of their demographic structure is given in Appendix B, Table B6; however, here we focus on the largest discrepancies.
Corresponding to the findings on who did register, the largest differences between those who registered and those who did not can be found in the attitudinal variables. Specifically, there are higher proportions of conservative voters (24.4% compared with 16%), those who are not at all or not very concerned with climate change (17.4% compared with 2.4%), and those with no or not very much confidence in government (93.2% compared with 78.7%), amongst those who did not register compared with those who did.
What deterred registration?
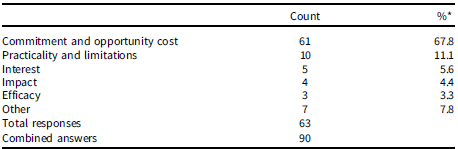
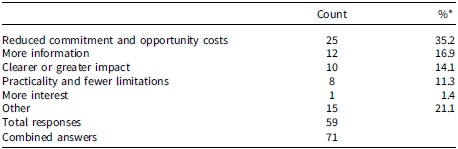
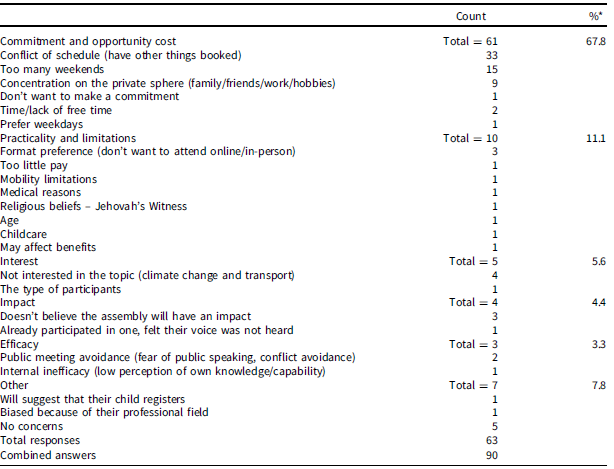
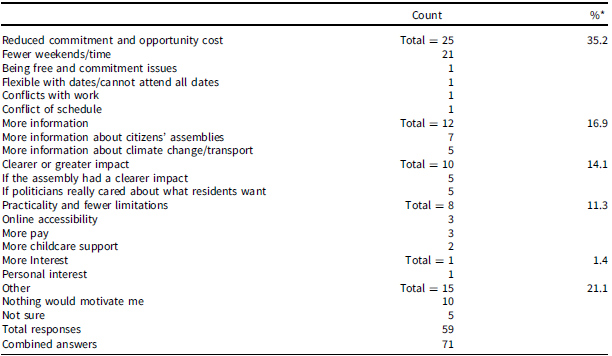
Seventy-three of the 293 respondents who were fully treated consented to an interview regarding their motivations and concerns about registering on the doorstep, 10 of which reported that they had registered for the assembly and 63 who said they had not. The respondents could answer freely while the canvasser ticked as many boxes as applicable on their device corresponding to the responses, or entered free text if they mentioned a reason not already covered by a tick box. Tables 4 and 5 present the summaries of concerns listed about registering and what would motivate registration for the 63 respondents who claimed not to have registered at the time of canvassing. Full versions of Tables 4 and 5, including breakdowns of the categories, can be found in Appendix B.
Concerns about registering

Table 4. Long description
A table summarizing concerns about registering. The table has two columns: Count and Percent. The row labels include Commitment and opportunity cost, Practicality and limitations, Interest, Impact, Efficacy, Other, Total responses, and Combined answers. Row 1: Commitment and opportunity cost, Count: 61, Percent: 67.8. Row 2: Practicality and limitations, Count: 10, Percent: 11.1. Row 3: Interest, Count: 5, Percent: 5.6. Row 4: Impact, Count: 4, Percent: 4.4. Row 5: Efficacy, Count: 3, Percent: 3.3. Row 6: Other, Count: 7, Percent: 7.8. Row 7: Total responses, Count: 63, Percent: Not applicable. Row 8: Combined answers, Count: 90, Percent: Not applicable.
What would motivate registration?

Table 5. Long description
The table presents the motivations and concerns about registering for an assembly among 63 respondents who claimed not to have registered at the time of canvassing. It has two columns: Count and %. The table includes the following rows: Reduced commitment and opportunity costs with a count of 25 and a percentage of 35.2, More information with a count of 12 and a percentage of 16.9, clearer or greater impact with a count of 10 and a percentage of 14.1, Practicality and fewer limitations with a count of 8 and a percentage of 11.3, More interest with a count of 1 and a percentage of 1.4, Other with a count of 15 and a percentage of 21.1, Total responses with a count of 59, Combined answers with a count of 71.
Broadly, deterrence from registration can be divided into two categories based on the responses. The first is capacity, encompassing the level of commitment required and practical limitations to attending, and the second relates to an individual’s knowledge and perception of the assembly, including their interest in the topic and beliefs about its potential impact.
Capacity and commitment
By far, the most common reasons given for not registering for the assembly are related to the level of commitment required. When asking a respondent why they had no intention of registering, or what concerned them about registering, 67.8% of responses cited unavailability or opportunity cost.Footnote 20 This is followed by 11.1% of responses citing limitations such as medical restrictions or financial considerations. We see this echoed in the responses given when asked what would motivate a respondent to attend, with 35.2% of responses relating to the lack of flexibility, prior commitments, or conflicts of schedule. Of the 63 respondents we spoke to who had not registered, 49 (77.8%) mentioned at least one commitment-based response in their doorstep interview, and for half of those, the level of commitment was the only aspect they talked about. These results build on the findings of Jacquet (Reference Jacquet2017), who identified concentration on the private sphere and conflict of schedule as two of the three most common explanatory logics of non-participation in mini-publics. The findings also touch on issues raised in feminist literature that the ability to participate in citizen engagement is determined by privilege and resources, with those with caring responsibilities or low income particularly disadvantaged (Phillips Reference Phillips1992; Celis and Childs Reference Celis and Childs2019). For example, several responses cited childcare, accessibility, or pay as obstacles or incentives for participation, highlighting that the cost of attending varies greatly between potential registrants.
It is evident that if DMPs are to be representative and take a more central role in decision-making, more needs to be done to overcome the commitment barrier. For organisers, the options are relatively limited. In the case of the SCCA, participants were compensated with a gift of £340, and support costs, including childcare, were covered. Given that both childcare and pay feature as reasons for non-registration amongst our respondents, either the level of support was insufficient or not well advertised enough to incentivise them. Assembly design and integrated technology could also be used to increase flexibility or reduce engagement demands (note format preference and online accessibility were mentioned as both reasons for not registering and means to motivate some respondents); however, this would need to be done in such a way that does not dilute the content of the assembly or exclude those less comfortable or with limited access to technology. An alternative perspective would be to take a more systemic approach in which individuals are supported to participate by increasing welfare or reducing constraints on individual freedom. This could be directly, for example, by offering leave from work similar to that extended for jury service, or indirectly through policies that increase individual capacity. Although not the main aim of policies like the 4-day work week, free childcare provision, or universal basic income (all currently being considered or trialled in parts of the UK), they may have positive spillover effects on civic engagement, including the ability to attend DMPs, where time or resources were the primary factors for non-participation.
Perceptions of the assembly
Although capacity is a large concern for attending a citizens’ assembly, it is not the only reason for low registration rates. When asked why a respondent would not register for the SCCA, or what concerned them about registering, interest in the topic, beliefs about the assembly’s impact, and personal efficacy represented 13.3% of responses. As the SCCA was about transport and climate change, we can also look at the level of interest in the topic using the survey responses regarding climate concern. Supporting the findings of Section Who Registered?, we find that those respondents interviewed and willing to complete the demographic survey, who answered that they were ‘not very’ or ‘not at all’ concerned about climate change, were also much less likely to report that they were considering registering than those who were ‘fairly’ or ‘very’ concerned about climate change (12.5%, N = 8 compared with 44.4%, N = 36), even though lack of interest in the topic was seldom mentioned in their interview answers.
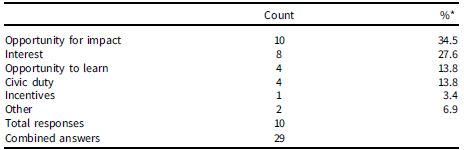
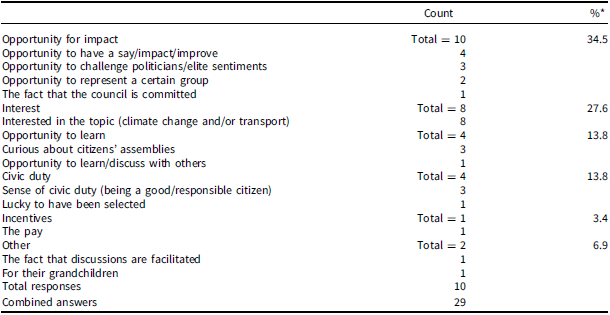
When we look at what would motivate registration, reasons relating to perceptions of the assembly feature much more prominently, with 31% of responses suggesting that more information about the assembly or topic, higher expectations for the assembly’s impact, or greater personal interest would encourage registration. Contrasting these responses against reasons given for registration by those who had registered (Table 6), the patterns become more prominent.
Why did you register?

Table 6. Long description
A table titled ‘Why did you register?’ with two columns labeled ‘Count’ and ‘%*’ and eight rows labeled with reasons for registration. The table has the following data: Row 1: Opportunity for impact, Count: 10, %*: 34.5; Row 2: Interest, Count: 8, %*: 27.6; Row 3: Opportunity to learn, Count: 4, %*: 13.8; Row 4: Civic duty, Count: 4, %*: 13.8; Row 5: Incentives, Count: 1, %*: 3.4; Row 6: Other, Count: 2, %*: 6.9; Row 7: Total responses, Count: 10; Row 8: Combined answers, Count: 29. The table shows the reasons for registration along with their respective counts and percentages.
Those unregistered would be motivated to do so with more information about citizens’ assemblies or the topic, while those who had registered did so because they had an idea of what a citizens’ assembly would entail and because they were already interested in the topic. Although difficult to draw conclusions from 10 observations, it is notable that 8 of the 10 respondents who had registered when we interviewed them on the doorstep listed ‘interest in the topic’ as a reason for registering, and perhaps unsurprisingly all 10 answered that they were ‘fairly’ or ‘very’ concerned about climate change. This contrasts against the lack of interest or lower levels of concern about climate change amongst those who had not registered or were not considering registering. Similarly, 15.3% of those who had not registered said they would be motivated to do so if they believed the assembly would have a clearer impact or if politicians cared. Recall that this group also had lower levels of confidence in the government, perhaps indicating more scepticism in the process or organisers. By comparison, those who had registered saw the assembly as an opportunity to have an impact and to be heard by politicians and the Council.
When deciding whether to register for a DMP, an individual must consider the balance of the level of engagement required against the benefits of engaging. For some, the commitment required will be a limiting factor regardless of their level of interest, especially for those with fewer resources or flexibility, but for others, more information about what an assembly is and a greater trust that they will be listened to may be enough to increase the relative value of registering.
Conclusion
This article reports on the first GOTD door-to-door canvassing experiment that we are aware of. Our study takes the most effective method to increase turnout in traditional forms of political participation and applies it to increase non-traditional forms of political participation. We find that door-to-door canvassing does work to increase registration to citizens’ assemblies, with significant effects in the treatment group during the canvassing period. Our novel findings need to be interpreted with appropriate caution, given that participating in a mini-public is a rare event, and the political activity we study occurs in much smaller numbers than seen in a traditional GOTV experiment. Unlike voter turnout, registration for mini-publics, with its greater ask on participants, proceeds from a low base and we should be mindful that this means absolute increases are small, although percentage increases in participation are relatively high when compared with voting.
We then asked what characteristics or societal groups benefit most in reducing under-representation in the pool. We see significant benefits to groups like young people, including students, the unemployed, non-voters, people of colour, and people with disabilities who are all chronically under-represented in other forms of democratic policies. Although canvassing does not correct for imbalances in descriptive representation overall, it does increase the pool size, including amongst some of the least represented. As such, it allows greater opportunities for intersectional diversity in selecting the final invitees to a mini-public, and so helps to deliver diversity along important characteristics relevant to the deliberation. These changes to the registrant pool size and diversity are also important for assessing the relative value of methods such as canvassing, where cost-per-registration may be high, but small margins can have a large impact given the starting point.
Here, we would encourage close collaboration with researchers seeking to arrest the decline of survey response rates (Olson Reference Olson2025). Although recruitment to political activity is conceptually different, the move to sortition-based selection increases the family resemblance. Recent research has needed to account for challenges in moves to mixed-mode surveys, where in-person contact is less used to carry out interviews, and increasingly focuses on persuading non-respondents using knock-to-nudge or push-to-telephone/web techniques (Charman et al. Reference Charman, Mesplie-Cowan and Collins2024; Domarchi et al. Reference Domarchi, Maslovskaya and Smith2025). In a recent review of surveys administered in the UK in the last 5 years, Domarchi et al. (Reference Domarchi, Ndebele, Maslovskaya, Fitzgerald, Lynn and Comanaru2026) describe a set of interesting findings on use, amount, and type of conditional and unconditional monetary incentives; message presentation and complexity; use of QR codes; and type and timing of reminders. These will not always read across to political recruitment – for example unconditional payment for a political registration would be a quite radical commitment from government, but pilot tests could assess what it might achieve. Those working on innovative democratic reform should look to other forms of social recruitment to provide inspiration for future research intervention design.Footnote 21
Indeed, we do not yet know if gains in recruitment would increase earlier in the registration period when a reminder follows an invite most closely, and advocates of mini-publics will argue that as the method’s usage grows, normalisation of the activity will reduce some of the challenges to recruiting in this way. It is worth noting that a more precisely targeted door-knocking strategy, focusing on specific strata of the population that do not traditionally participate when targeting data are available, or focusing on underprivileged sections of the target area, will have a greater impact on the diversity of the pool and increase the value for money of the canvassing strategy. This approach is something we want to explore in future research.
Finally, we contribute to the literature surrounding reasons for not registering to participate in mini-publics. Understanding motivations and reasons for non-registration is crucial to increasing registration rates, not only by identifying limitations and solutions, but also by finding ways to improve communication and interventions surrounding registration to increase their effectiveness and reduce the relative cost. We encourage attempts to replicate our research in other contexts to understand how mini-public design, the topic selected, and cultural and political context might affect uptake.
Our research shows that individual capacity is the main barrier to registration due to the high level of commitment required and the personal costs involved, despite the support and compensation available. Although careful design for inclusion via flexible opportunities to engage can mitigate some of these costs, the barriers are often high because the advanced industrial societies in which our democratic innovations are embedded are not themselves organised in ways that facilitate participation by certain groups. Further empirical and normative research would do well to try to uncover the costs and value associated with more equal participation, and to understand the potential value and benefits of different combinations of interventions. These will range from GOTV/D-style nudges and changes to the framing of assemblies to encourage a wider range of interest, to changes that reduce constraints on citizens, and incentivise interest in the activity of deliberation. By exploring these avenues, we can pave the way for more inclusive democratic innovations that reflect more closely the diverse voices of society, ultimately strengthening the foundations of democracy.
Supplementary material
The supplementary material for this article can be found at https://doi.org/10.1017/S1475676526101637.
Data availability statement
Replication data for the statistical analysis in this article are available at the University of Southampton data repository using the following link: https://doi.org/10.5258/SOTON/D3964. Additional raw data used for the descriptive analysis, including the doorstep interview and survey data, cannot be openly released due to risk of identification of respondents, given the relatively small sample sizes involved and the personal nature of the data collected.
Acknowledgements
The authors would like to thank the door-to-door canvassers, the Sortition Foundation, and those involved with the organisation of the Southampton Climate Assembly for enabling this research. We also thank Prof. Robert Johns as well as the attendees at the ECPR 2024 and APSA 2024 conferences for their comments on early drafts.
Funding statement
The authors would like to acknowledge the support of UKRI funding ref: MR/S032711/1 and MR/Y02009X/1.
Competing interests
The author(s) declare none.
Ethical standards
The study was ethically approved at the University of Southampton (reference #: 88181).
Appendix A: Limitations to canvassing
A. Reasons why doors were not knocked and/or fully treated
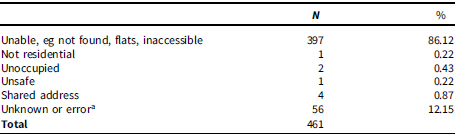
Canvassers collected reasons why doors were not knocked and why they could not progress to treatment on their data collection devices. Canvassers also had paper lists of addresses on which they could record notes as to why a door was not knocked; for example, if they could not canvass an entire block of flats due to inaccessibility, they could write this on the sheet instead of completing data entry for each address. The reasons given for not knocking a door are recorded in Table A1, including both entries from the data collection devices and paper address sheets.
Reasons doors were not knocked

Table A1. Long description
The table lists reasons doors were not knocked, including the number and percentage for each reason. It has 7 rows and 3 columns. The columns are labeled N and percent. The row labels are Unable, Not residential, Unoccupied, Unsafe, Shared address, Unknown or error, and Total. Row 1: Unable, eg not found, flats, inaccessible, 397, 86.12. Row 2: Not residential, 1, 0.22. Row 3: Unoccupied, 2, 0.43. Row 4: Unsafe, 1, 0.22. Row 5: Shared address, 4, 0.87. Row 6: Unknown or error, 56, 12.15. Row 7: Total, 461.
Notes: aIncludes addresses for which no data were collected to explain why the door was not knocked, for example, because they were missed/not included on a list by accident or because no information was given by the canvasser on the sheet or data collection device.
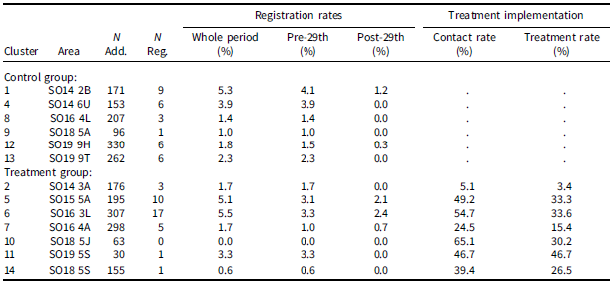
By far the most common reason for not knocking on a door was inaccessibility, including addresses not being found and a large portion of the addresses being flats. Where buzzers were available or a canvasser was able to gain entry, addresses in flats were contacted, but in many cases the canvassers reported that they could not gain entry or reach anyone inside. The researchers also attempted to gain temporary access from the owners of the buildings in some cases of exceptionally large flats. However, all attempts were refused for security concerns; this was particularly an issue for Cluster 2 in which lack of access to several large flats limited the contact rate to 5.1% (see Table B1 in Appendix B).
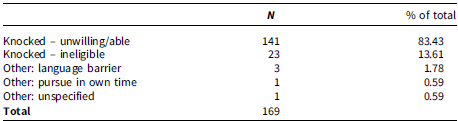
If a door was answered, the canvassers introduced themselves and their reason for knocking before checking whether the respondent was willing and eligible to discuss the SCCA. Table A2 details the reasons given for discontinuing the door-knocking attempt before the full script was completed.
Reasons for discontinuing script

Table A2. Long description
A table titled ‘Reasons for discontinuing script’ with five rows and three columns. The columns are labeled ‘N’, ‘% of total’, and ‘Reasons for discontinuing script’. The row labels and values are as follows: Row 1: Knocked – unwilling/able, 141, 83.43. Row 2: Knocked – ineligible, 23, 13.61. Row 3: Other: language barrier, 3, 1.78. Row 4: Other: pursue in own time, 1, 0.59. Row 5: Other: unspecified, 1, 0.59. Row 6: Total, 169. Notes: More than one answer was possible where applicable.
Notes: More than one answer was possible where applicable.
The main reason for discontinuing speaking to someone who answered the door is their unwillingness or inability to speak to the canvasser, followed by ineligibility. Here, ineligibility means that no one present in the household at the time of knocking met the criteria to register for the SCCA, for example if the respondent was under the age of 16 or was not a long-term resident; it does not mean that no one at the address was eligible.
Appendix B: Additional tables and figures
Registration distribution over time.

Overview by cluster

Table B1. Long description
The table presents data on registration rates and treatment implementation across various clusters, divided into control and treatment groups. It includes columns for area, number of addresses, number of registrations, registration rates for the whole period, pre-29th, and post-29th, as well as contact rate and treatment rate. The control group consists of clusters 1, 4, 8, 9, 12, and 13, while the treatment group includes clusters 2, 5, 6, 7, 10, 11, and 14. Each row lists specific areas within these clusters along with their respective data values. Notable trends include varying registration and treatment rates across different areas, with some areas showing higher contact and treatment rates in the treatment group compared to the control group.
Notes: Cluster 3 was removed as it solely consisted of inaccessible student halls. ‘N Add.’ is the number of addresses. ‘N Reg.’ is the number of registrations.
Cluster demographics

Table B2. Long description
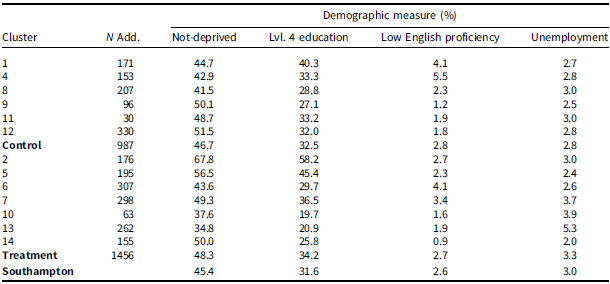
The table presents demographic measures in percentage across different clusters. It includes columns for the number of addresses, not-deprived households, households with level 4 or higher education, households with low English proficiency, and unemployment rates. The table is divided into several clusters, a control group, a treatment group, and overall data for Southampton. Each row lists the values for these demographic measures. For example, Cluster 1 has 171 addresses, 44.7 percent not-deprived households, 40.3 percent with level 4 or higher education, 4.1 percent with low English proficiency, and 2.7 percent unemployment. The control group has 987 addresses, 46.7 percent not-deprived households, 32.5 percent with level 4 or higher education, 2.8 percent with low English proficiency, and 2.8 percent unemployment. The treatment group has 1456 addresses, 48.3 percent not-deprived households, 34.2 percent with level 4 or higher education, 2.7 percent with low English proficiency, and 3.3 percent unemployment. Southampton overall has 45.4 percent not-deprived households, 31.6 percent with level 4 or higher education, 2.6 percent with low English proficiency, and 3.0 percent unemployment.
Notes: All values are weighted proportions based on lower layer super output area (LSOA) level data, weighted by the proportion of addresses from a given LSOA within the cluster/treatment (where clusters contained multiple LSOAs). ‘Not-deprived’ is the proportion of households which do not meet the criteria for deprivation for any of education, employment, health, or housing. ‘Lvl. 4 Education’ is the proportion of households that stated they had level 4 or higher education. ‘Low English proficiency’ is the proportion of households that claimed not to speak English or not to speak English well. ‘Unemployment’ is the proportion of households that were classed as economically active but unemployed, excluding students. Values are calculated using data taken from the Office for National Statistics (ONS) Census 2021 in England and Wales (Office for National Statistics 2021).
Monte Carlo replications of registration rate comparisons

Table B3. Long description
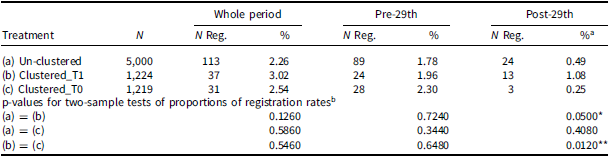
The table presents Monte Carlo replications of registration rate comparisons across different treatments and periods. It has 6 rows and 7 columns. The columns are labeled as Treatment, N, Whole period N Reg., Whole period %, Pre-29th N Reg., Pre-29th %, Post-29th N Reg., Post-29th %, and Post-29th %a. The rows are labeled as (a) Un-clustered, (b) Clustered_T1, (c) Clustered_T0, and p-values for two-sample tests of proportions of registration rates. Row 1: (a) Un-clustered, 5,000, 113, 2.26, 89, 1.78, 24, 0.49. Row 2: (b) Clustered_T1, 1,224, 37, 3.02, 24, 1.96, 13, 1.08. Row 3: (c) Clustered_T0, 1,219, 31, 2.54, 28, 2.30, 3, 0.25. Row 4: (a) = (b), 0.1260, 0.7240, 0.0500. Row 5: (a) = (c), 0.5860, 0.3440, 0.4080. Row 6: (b) = (c), 0.5460, 0.6480, 0.0120. The table also includes notes on the calculation of percentages and the significance levels of p-values.
Notes: aPercentages are calculated based on the remaining number of unregistered addresses once canvassing had begun.
bP-values for 1,000 Monte Carlo permutations of two-sample tests of proportions. ***, **, and * indicate statistical significance at the 1%, 5%, and 10% levels, respectively.
Treatment effects of canvassing – OLS with fixed effects

Table B4. Long description
The table presents the treatment effects of canvassing using OLS with fixed effects. It includes data for the whole period, pre-29th, and post-29th. The table has five columns labeled (1), (2), (3), (4), and (5), and several rows with different variables and their respective values. Row (a) shows the treatment group dummy values, row (b) shows the contact dummy values, row (c) shows the treatment dummy values, and the constant values are listed in the next row. The wild bootstrap p-values, number of observations, F values, and Prob F values are also provided. Each column represents different periods and conditions, with statistical significance indicated by asterisks.
aP-value for the respective treatment or contact variable (a, b, or c) when standard errors are estimated using wild boot-strapping with 999 replications.
bExcluding fixed effects due to multicollinearity. Individual-level linear regression estimates with fixed effects for the canvassing region (cluster). All estimates have robust standard errors clustered by canvassing region (cluster). Columns (1) and (2) include data for the whole canvassing period. Column (3) excludes data for those who registered after the 29th of September. Columns (4) and (5) exclude data for those who registered prior to the 29th of September. ***, **, and * indicate statistical significance at the 1%, 5%, and 10% levels, respectively.
Demographic representation amongst registrants

Table B5. Long description
The table compares demographic representation among registrants, showing percentages and counts for various categories. It includes columns for target percentages, data excluding contacted individuals, and data including contacted individuals. The table is divided into several sections: Gender, Age bracket, Ethnicity, Disability, Climate concern, Vote (last election), Confidence in Government, and Occupation. Each section lists specific categories with corresponding percentages and counts. Notable trends include differences in representation when contacted individuals are included or excluded.
Notes: ‘Target’ refers to the percentage of a given demographic targeted by the Sortition Foundation to be considered representative for Southampton. *indicates that the inclusion of the contacted registrants (change column) moved the participant pool demographic proportions towards the population target, eg the difference between the proportions in the registrant pool and the target is less than while excluding those not canvassed.
Demographic representation amongst non-registrants

Table B6. Long description
The table compares demographic representation amongst non-registrants across various categories. It has 17 rows and 7 columns. The columns are labeled Target, Unregistered, and Registered excluding contacted, each with sub-columns for percentage, count (N), and difference (Diff). The row labels include Gender, Age bracket, Ethnicity, Disability, Climate concern, Vote (last election), Confidence in government, and Occupation. Each row provides data for these categories. For example, the first row under Gender shows Woman with 49.7 percent in Target, 23 count and 50.0 percent in Unregistered, 0.3 difference, 80 count and 47.3 percent in Registered excluding contacted, and -2.3 difference. The table provides a detailed comparison of demographic data across these categories.
Notes: ‘Target’ refers to the percentage of a given demographic targeted by the Sortition Foundation to be considered representative for Southampton.
Concerns about registering

Table B7. Long description
A table listing concerns about registering with counts and percentages. The table has 21 rows and 3 columns. The columns are labeled Count, %, and Concerns about registering. The rows are grouped under different headings: Commitment and opportunity cost, Practicality and limitations, Interest, Impact, Efficacy, and Other. Row 1: Commitment and opportunity cost, Total, 61, 67.8. Row 2: Conflict of schedule (have other things booked), 33. Row 3: Too many weekends, 15. Row 4: Concentration on the private sphere (family/friends/work/hobbies), 9. Row 5: Don’t want to make a commitment, 1. Row 6: Time/lack of free time, 2. Row 7: Prefer weekdays, 1. Row 8: Practicality and limitations, Total, 10, 11.1. Row 9: Format preference (don’t want to attend online/in-person), 3. Row 10: Too little pay, 1. Row 11: Mobility limitations, 1. Row 12: Medical reasons, 1. Row 13: Religious beliefs – Jehovah’s Witness, 1. Row 14: Age, 1. Row 15: Childcare, 1. Row 16: May affect benefits, 1. Row 17: Interest, Total, 5, 5.6. Row 18: Not interested in the topic (climate change and transport), 4. Row 19: The type of participants, 1. Row 20: Impact, Total, 4, 4.4. Row 21: Doesn’t believe the assembly will have an impact, 3. Row 22: Already participated in one, felt their voice was not heard, 1. Row 23: Efficacy, Total, 3, 3.3. Row 24: Public meeting avoidance (fear of public speaking, conflict avoidance), 2. Row 25: Internal inefficacy (low perception of own knowledge/capability), 1. Row 26: Other, Total, 7, 7.8. Row 27: Will suggest that their child registers, 1. Row 28: Biased because of their professional field, 1. Row 29: No concerns, 5. Row 30: Total responses, 63. Row 31: Combined answers, 90.
Notes: * percentage of combined answers.
What would motivate registration?

Table B8. Long description
The table presents data on factors that would motivate registration, categorized into several groups with their respective counts and percentages. The table has 15 rows and 3 columns. The columns are labeled Count, %, and the row labels include various factors and their subcategories. Row 1: Reduced commitment and opportunity cost, Total, 25, 35.2. Row 2: Fewer weekends/time, 21. Row 3: Being free and commitment issues, 1. Row 4: Flexible with dates/cannot attend all dates, 1. Row 5: Conflicts with work, 1. Row 6: Conflict of schedule, 1. Row 7: More information, Total, 12, 16.9. Row 8: More information about citizens assemblies, 7. Row 9: More information about climate change/transport, 5. Row 10: Clearer or greater impact, Total, 10, 14.1. Row 11: If the assembly had a clearer impact, 5. Row 12: If politicians really cared about what residents want, 5. Row 13: Practicality and fewer limitations, Total, 8, 11.3. Row 14: Online accessibility, 3. Row 15: More pay, 3. Row 16: More childcare support, 2. Row 17: More Interest, Total, 1, 1.4. Row 18: Personal interest, 1. Row 19: Other, Total, 15, 21.1. Row 20: Nothing would motivate me, 10. Row 21: Not sure, 5. Row 22: Total responses, 59. Row 23: Combined answers, 71. The table also includes a note stating that the percentage of combined answers is provided.
Notes: * percentage of combined answers.
Why did you register?

Table B9. Long description
A table titled ‘Why did you register?’ with two columns: Count and %. The table has 10 rows with specific reasons for registration, their counts, and corresponding percentages. Row 1: Opportunity for impact, Total = 10, 34.5. Row 2: Opportunity to have a say/impact/improve, 4. Row 3: Opportunity to challenge politicians/elite sentiments, 3. Row 4: Opportunity to represent a certain group, 2. Row 5: The fact that the council is committed, 1. Row 6: Interest, Total = 8, 27.6. Row 7: Interested in the topic (climate change and/or transport), 8. Row 8: Opportunity to learn, Total = 4, 13.8. Row 9: Curious about citizens’ assemblies, 3. Row 10: Opportunity to learn/discuss with others, 1. Row 11: Civic duty, Total = 4, 13.8. Row 12: Sense of civic duty (being a good/responsible citizen), 3. Row 13: Lucky to have been selected, 1. Row 14: Incentives, Total = 1, 3.4. Row 15: The pay, 1. Row 16: Other, Total = 2, 6.9. Row 17: The fact that discussions are facilitated, 1. Row 18: For their grandchildren, 1. Row 19: Total responses, 10. Row 20: Combined answers, 29. Notes: percentage of combined answers.
Notes: * percentage of combined answers.
Appendix C: Canvassing materials
Canvassing script diagram.

Figure C1. Long description
A flowchart illustrating the process of canvassing for a citizens’ assembly, detailing steps and decision points for engaging potential participants. The flowchart begins with initial checks where the canvasser introduces themselves and the university, and asks why the person is out, referring to the Citizens’ Assembly. If the person is not willing to complete the research survey, they are thanked for their time and the survey ends. If they are willing, the canvasser checks if the person is a resident in the household and aged 16 or over. If not, the canvasser thanks them for their time and ends the survey. If yes, the discussion begins by asking if they received an invite. If they did not receive an invite, the canvasser explains that their household has been randomly selected, explains the Assembly, and its aim. If they received an invite, the canvasser asks if they have registered. If they have not registered, the canvasser offers to help them register or direct them to the FAQs/website. If they have registered, the canvasser asks if they have any questions to help decide. If they do not have questions, the canvasser thanks them for their time and ends the survey. If they have questions, the canvasser answers them, reminds them of the sign-up deadline, and offers to register them. If they are willing to complete the research survey, the canvasser continues to data collection. If they are not willing, the canvasser thanks them for their time and ends the survey.





 Open access

