





1 Introduction
Lasers operating at 2.1 μm, which fall within the human eye safety band and atmospheric window[ Reference Godard 1 ], have been applied in industrial, medical and scientific research[ Reference Kuntz 2 – Reference Dai, Fan, Wu, Wu and Zhang 4 ]. Furthermore, 2.1 μm wavelength lasers exhibit excellent transmittance in mid-infrared nonlinear crystals, including ZnGeP2, AgGaSe2 and CdSiP2. This makes them suitable as fundamental-frequency lasers for producing lasers in the 3–5 and 8–12 μm spectral ranges[ Reference Eichhorn, Schellhorn, Haakestad, Fonnum and Lippert 5 – Reference Piotrowski, Bogas-Droy, Spindler, Bigotta and Hildenbrand-Dhollande 7 ].
The transition of Ho3+ between the 5I7 and 5I8 energy levels represents the most prevalent method for directly obtaining 2.1 μm radiation[ Reference Chen, Zhao, Yang, Zhang, Zhou, Tang, Wong, Chen and Shen 8 ]. Typically, Ho lasers require a pump source with an emission wavelength of approximately 1.9 μm, including fibre[ Reference Walasik, Tench, Delavaux and Lallier 9 ], solid-state[ Reference Beaumont, Bourdon, Barnini, Kervella, Robin and Le Gouet 10 ] and laser diode (LD)[ Reference Wang, Zhao, Li, Tian, Xie and Tan 11 ] lasers. The quality of the beam produced by different types of 1.9 μm pump sources was found to vary, resulting in different effective mode field volumes and, consequently, different conversion efficiencies. In 2011, Tang et al.[ Reference Tang, Xu, Wang, Yang, Xu and Xu 12 ] reported a high-slope-efficiency Ho:Lu3Al5O12 (Ho:LuAG) laser. Under the conditions of a 289 K cooling system and LD pump, a slope efficiency of 83% was achieved relative to the absorbed pump power. However, to achieve a slope efficiency close to the Stokes limit, it is usually necessary to operate under extremely low-temperature conditions. In 2012, Newburgh et al.[ Reference Newburgh, Fleischman and Dubinskii 13 ] described a Ho:YVO4 laser pumped by single-mode-fibre laser. Using a liquid-nitrogen cooling system to lower the temperature of Ho:YVO4 to 80 K, a slope efficiency of 92% was achieved. The result obtained was close to the Stokes limit, but the laser was unable to achieve the ideal beam quality at a high slope efficiency and a beam quality factor (M 2) of approximately 5.5. In 2015, Kwiatkowski et al.[ Reference Kwiatkowski, Jabczynski and Zendzian 14 ] reported a high-slope-efficiency Ho laser pumped by a single-mode-fibre laser. At a temperature of 289 K, a slope efficiency of 81.6% was obtained using a Ho:YLiF4 (Ho:YLF) crystal with the Ho3+ doping concentration of 0.5% (atomic fraction). Furthermore, under conditions where the output power exceeded 20 W, an M 2 of less than 1.1 was achieved, approaching diffraction-limited beam quality. In 2016, Ji et al.[ Reference Ji, Liu, Nie, Cao, Fu and Gong 15 ] demonstrated a compact Ho:YLF laser pumped by an LD laser. Utilizing a gain medium with a low doping concentration of 0.5%, an output power of 1.63 W and a slope efficiency of 89.2% at 288 K were achieved. This is the first Ho-doped solid-state laser to achieve a slope efficiency of nearly 90% using the conventional water-cooling method. Typically, to achieve high slope efficiency, it is necessary to employ both a small pump spot and a large laser spot, to generate a large effective overlap area. However, the presence of a small pump spot can give rise to substantial temperature gradients at the crystal end-face, resulting in crystal fracture and limiting the increase in output power[ Reference Ma, Li, Shen, He and Li 16 ]. The presence of a large laser spot can readily induce mode mismatch, thereby compromising the stability of laser output. Currently, high-slope-efficiency lasers around 2.1 μm have been achieved in many new Ho-doped crystals, including Ho:(Sc0.5Y0.5)2SiO5 (Ho:SSO)[ Reference Duan, Qian, Shen, Su, Zheng, Li, Yao and Dai 17 ], Ho:GdTaO4 (Ho:GTO)[ Reference Duan, Wu, Dou, Zhang, Dai and Yang 18 ] and Ho:GdVO4 [ Reference Mi, Wei, Tang, Yao, Li, Yang, Duan and Dai 19 ]. However, the slope efficiency relative to the absorbed pump power was less than 80%. Finding high-performance Ho-doped crystals to design high-slope-efficiency resonant cavities has become a goal of industry and the scientific research community. Recently, Ho:CaYAlO4 (Ho:CYA) has attracted considerable attention with an octahedrally formed perovskite structure[ Reference Ma, Hao, Wang, He and Li 20 ], which has physical properties comparable to those of Ho:YAG and Ho-doped yttrium aluminium oxide (Ho:YAP; coefficients of thermal expansion along the a- and c-axes of 8.97 × 10⁻⁶ and 8.99 × 10⁻⁶ K−1, respectively, and thermal conductivities along the a- and c-axes of 3.7 and 3.3 W·m−1·K−1, respectively[ Reference Li, Xu, Zhu, Chen, Tan, Zhang, Tang, Ma, Wu, Xia and Xu 21 ]). In Ho:CYA crystals, calcium (Ca) and yttrium (Y) ions are randomly distributed over nine coordination sites, and this disordered structure results in broad absorption and emission spectra of lanthanide ions embedded in the compound (absorption peaks near 1922 nm in the E//a polarization direction, and an absorption range of 1935–1996 nm in the E//c polarization direction[ Reference Zhou, Di, Xia, Xu, Wu, Xu, Shen, Zhao, Strzęp, Ryba-Romanowski and Lisiecki 22 ]). The broad and smooth emission spectrum of the Ho:CYA crystal facilitates laser operation in the 2.1 μm band (the tunable range of wavelength was 2076–2174 nm[ Reference Ma, Hao, Wang, He and Li 20 ]). Furthermore, the crystal demonstrates considerable potential for application in the field of ultrafast pulse generation at the picosecond and femtosecond levels[ Reference Wang, Yao, Liu, Xu, Xu and Leng 23 ]. By taking advantage of the birefringent properties of Ho:CYA crystals, a linearly polarized laser output can be generated without the need for an additional polarizer in the cavity, which not only simplifies the design of the laser resonance cavity but also avoids the problem of depolarization loss that exists in isotropic crystals such as Ho:YAG.
In this study, a high-slope-efficiency Ho:CYA laser at room temperature was achieved. By controlling the pump and laser radius, an overlapping efficiency greater than 98% was achieved in the gain medium. Utilizing an output coupler (OC) with a transmittance of 30% results in a maximum output power of 18.64 W at 2081 nm, corresponding to a slope efficiency of 90.6% relative to the absorbed pump power. Moreover, an acousto-optic modulator (AOM) was inserted into the resonator cavity to achieve a high-slope-efficiency actively Q-switched (AQS) Ho:CYA laser. Under a slope efficiency of 87.7%, the maximum average output power of 18.26 W and the narrowest pulse width of 40.1 ns were achieved. The calculated pulse energy and peak power were 1.83 mJ and 45.54 kW, respectively. To our knowledge, the slope efficiency of this laser is the highest among Ho-doped solid-state lasers at room temperature.
2 Theory and design
For quasi-three-level Ho solid-state lasers with non-negligible ground-state reabsorption loss, the slope efficiency can be expressed as follows[ Reference Beach 24 , Reference Laporta and Brussard 25 ]:

Here, T is the transmittance of the OC, l is the total logarithmic loss of round-trip transmission, l re is the ground-state reabsorption loss and η stokes is the Stokes efficiency. The overlapping efficiency can be expressed as follows[ Reference Chen, Liao, Kao, Huang, Lin and Wang 26 ]:

Here, f l(x, y, z) is the normalized form of the laser mode intensity distribution within the resonator cavity and h p(x, y, z) is the normalized form of the pump source intensity distribution within the gain medium. Typically, Ho-doped solid-state lasers have a good beam quality, which is close to the fundamental mode. Here, f l(x, y, z) can be expressed as follows:

and the laser radius at position z is expressed as follows:

Here, L is the length of the gain medium, ω 0 is the beam waist radius of the laser and λ l is the output wavelength of the laser. For commonly used pump sources, including fibre, LD and solid-state lasers, h p(x, y, z) can be represented by a high-order mode Gaussian beam:

and the pump radius at position z is expressed as follows:

Here, α is the absorption coefficient and ω p, M 2 and λ p are the waist radius, beam quality factor and wavelength of the pump source, respectively. Typically, the focal plane position z 0 = L/2 of the pump source is at the centre of the gain medium.
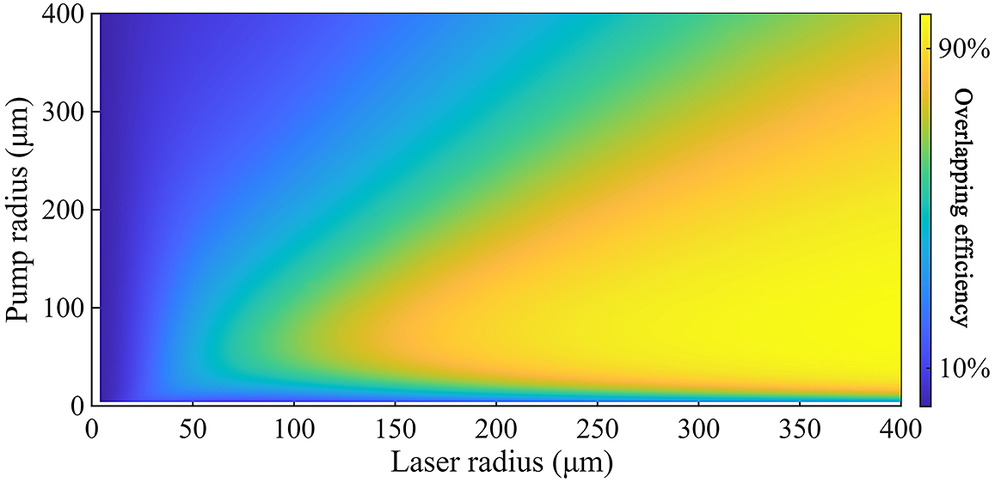
It is hypothesized that a high overlapping efficiency is crucial for achieving a high slope efficiency. As illustrated in Figure 1, there is a direct correlation between overlapping efficiency and laser and pump radius (L = 20 mm, λ l = 2081 nm, α =38.83 m−1, M 2 = 1.4 and λ p = 1937 nm). It can be deduced that, to achieve a high overlapping efficiency, the pump radius range should be set between 0 and 200 μm, and the laser radius range should be set between 300 and 400 μm.
Overlapping efficiency versus laser and pump radius.

Figure 1 Long description
A two-dimensional heat map with a color scale.
* The horizontal X-axis is labeled Laser radius (mu m) with a scale from 0 to 400.
* The vertical Y-axis is labeled Pump radius (mu m) with a scale from 0 to 400.
* A vertical color bar on the right represents Overlapping efficiency, ranging from 10 percent (dark blue) at the bottom to 90 percent (bright yellow) at the top.
Data Trends:
* The region of lowest efficiency (dark blue) is concentrated along the Y-axis where the laser radius is near 0, and along the X-axis where the pump radius is near 0.
* Efficiency increases as both radii increase, forming a diagonal gradient.
* The peak efficiency (yellow region) is found in the bottom-right quadrant, specifically where the laser radius is between 200 and 400 mu m and the pump radius is between 50 and 150 mu m.
* As the pump radius increases beyond 200 mu m while the laser radius remains constant, the efficiency begins to decrease slightly, transitioning from yellow back toward green and light blue.
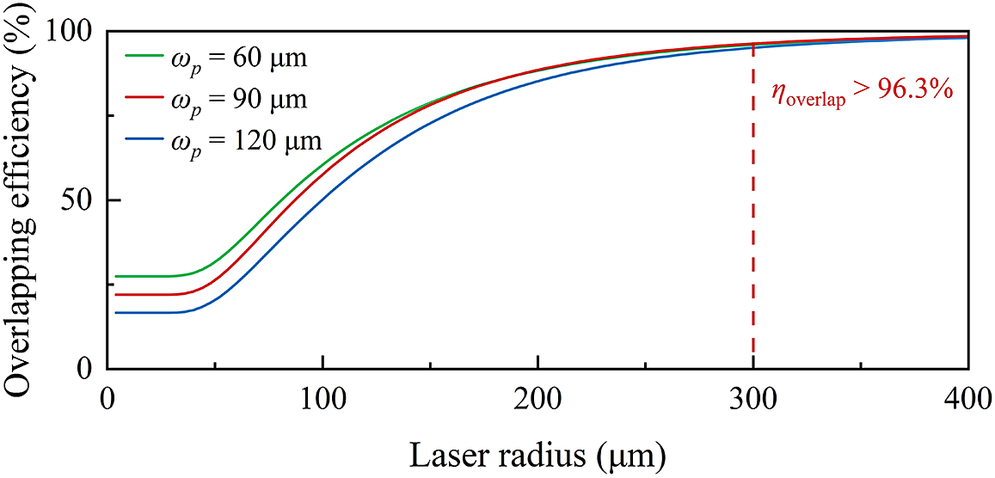
As demonstrated in Figure 2, when the pump radius was set at 60, 90 and 120 μm, the overlapping efficiency exhibited an increasing trend as the laser radius increased. It is evident that when the pump radius was set to 90 μm, the overlapping efficiency exceeded 96.3% when the laser radius was greater than 300 μm.
Overlapping efficiency versus laser radius at different pump radii.

Figure 2 Long description
The horizontal x-axis represents Laser radius in mu m, ranging from 0 to 400. The vertical y-axis represents Overlapping efficiency in percent, ranging from 0 to 100.
A legend in the top-left corner identifies three curves:
* Green line: omega sub p = 60 mu m.
* Red line: omega sub p = 90 mu m.
* Blue line: omega sub p = 120 mu m.
All three curves follow a similar sigmoidal trend. They start at a plateau for laser radii below 50 mu m, with the green line highest at approximately 25 percent, followed by red at 20 percent, and blue at 15 percent. Between 50 and 200 mu m, all curves show a steep increase. Above 200 mu m, they converge and asymptotically approach 100 percent efficiency.
A vertical dashed red line is positioned at a laser radius of 300 mu m. To the right of this line, a text label in red reads: eta sub overlap > 96.3 percent, indicating that for all pump radii, the efficiency exceeds this value once the laser radius reaches 300 mu m.
3 Experimental setup
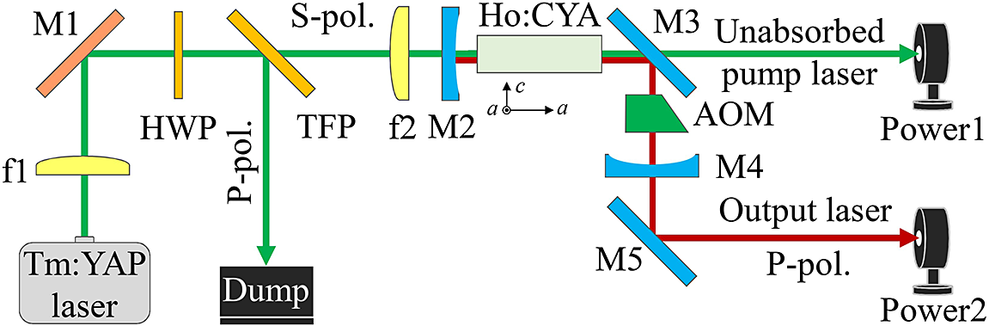
The experimental setup was used to attain a high-slope-efficiency Ho:CYA laser output, as illustrated in Figure 3. A 4 mm (c) × 4 mm (a) × 20 mm (a) size and 0.5% doping concentration Ho:CYA crystal was used as the laser gain medium (the polarization direction of the pump beam is perpendicular to the a-axis of the Ho:CYA crystal, while the polarization direction of the output beam is parallel to the a-axis of the Ho:CYA crystal). For Ho:CYA crystals cut along the a-axis, the absorption band was between 1935 and 1996 nm[ Reference Zhou, Di, Xia, Xu, Wu, Xu, Shen, Zhao, Strzęp, Ryba-Romanowski and Lisiecki 22 ]. A double-ended pumped Tm-doped yttrium aluminium oxide (Tm:YAP) solid-state laser with a maximum output power of 61.5 W was used as the pump source. At the maximum output power, the pump source has a central wavelength of 1937 nm, M 2 of 1.4 and root-mean-square (RMS) stability of 0.30% (the RMS stability represents the standard deviation as a percentage of the average). A lens with a focal length of 150 mm (f1) was used to collimate the laser emitted from the pump source, and a mirror (M1) with high reflectivity of the pump laser was used to reflect and adjust the pump source. No wavelength selection elements exist in the pump source. To prevent wavelength drift, the pump source was operated at maximum output power, and a beam-splitting system consisting of a half-wave plate (HWP) and a thin-film polarizer (TFP) was used to regulate the power. To obtain a pump beam waist radius of approximately 90 μm, a lens with a focal length of 100 mm (f2) was used to re-image the pump laser. The pump radius was 86 μm, as measured by the 90/10 scanning-knife edge method. An L-shaped resonator cavity with a physical length of 110 mm was used to achieve a laser waist radius greater than 300 μm, including a flat-concave mirror (M2) with a curvature of 500 mm, flat mirror (M3) and flat-concave mirror (M4) with a curvature of 300 mm. To reduce scattering losses, the surfaces of M2 and M3 were coated with anti-reflective layers in the range of 1880–1940 nm and high-reflective layers in the range of 1900–2200 nm. For M4, used as the OC, the surface was coated with layers having transmittances of 30%, 40% and 50% in the range of 1900–2200 nm. The waist radius of the laser inside the resonant cavity was calculated to be approximately 320 μm using the ABCD matrix (because the λ p is close to the λ l, the contribution of the thermal lens is not included in the ABCD matrix analysis, and the overlapping efficiency estimate of the laser resonator used in this experiment exceeds 98%). For ease of measurement and adjustment of the output laser, a flat mirror (M5) with the same parameters as M3 is used to reflect the output laser. Two power meters of the same model (Thorlabs, PM-100D, S422C) were used to measure the unabsorbed pump and output powers, respectively (the absorption efficiency is approximately 46%).
Schematic diagram of the experiment configuration with a high-slope-efficiency Ho:CYA laser.

Figure 3 Long description
The optical layout begins at the bottom-left with a Tm:YAP laser source. A green beam travels upward through a lens labeled f 1 to a mirror M 1. From M 1, the beam reflects 90 degrees to the right, passing through a H W P (half-wave plate). It then hits a T F P (thin film polarizer) where the P-pol. component is reflected downward into a Dump, while the S-pol. component continues horizontally.
The S-pol. beam passes through lens f 2 and a curved mirror M 2 into the Ho:CYA crystal. A coordinate system below the crystal shows axes a and c. After the crystal, the beam hits mirror M 3. At M 3, the green beam (Unabsorbed pump laser) continues straight to Power 1. A red beam (Output laser) is reflected downward from M 3 through an A O M (acousto-optic modulator), a curved mirror M 4, and reflects off mirror M 5 to the right. This P-pol. output laser terminates at Power 2.
4 Results and discussion
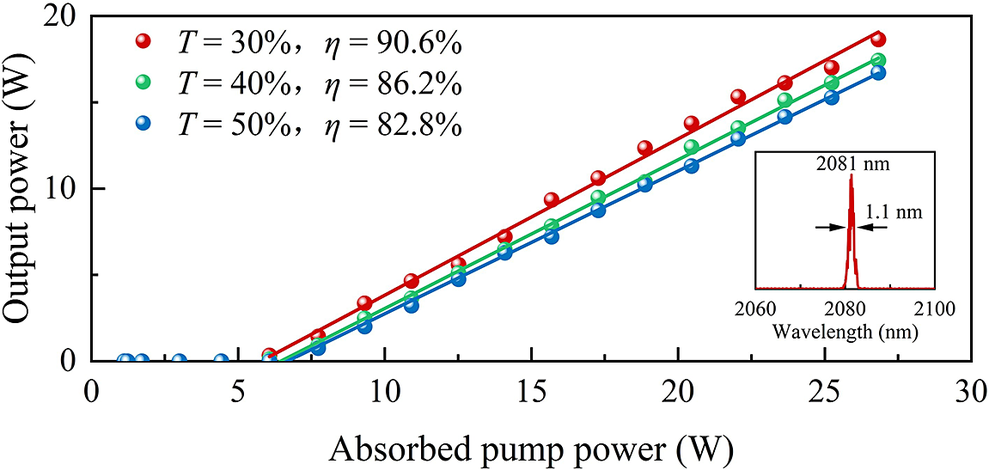
Without the AOM, the output power of the Ho:CYA laser at different absorbed pump powers was recorded, as shown in Figure 4. Under the three transmittances of the OC, the output power of the laser shows a monotonically increasing trend with the absorbed pump power. Through linear fitting, the slope efficiencies obtained were 90.6% (T = 30%), 86.2% (T = 40%) and 82.8% (T = 50%). For the quasi-three-level steam, the ground-state reabsorption loss is related to the T of the OC. Generally, an OC with a low transmittance will result in a higher laser intensity within the cavity, causing complete saturation of reabsorption and resulting in low l re and high slope efficiency. On the other hand, an OC with a high transmittance will lead to a lower laser intensity within the cavity, causing unsaturation of reabsorption, high l re and low slope efficiency. At an absorbed pump power of 26.83 W, the maximum output powers of the Ho:CYA laser are 18.64 (T = 30%), 17.42 (T = 40%) and 16.71 W (T = 50%), respectively (the cavity mode mismatch caused by the thermal lens effect prevents further increases in output power when the absorbed pump power exceeds 26.83 W, resulting in a significant decrease in slope efficiency). The transmittance of 30% was close to the optimal transmittance of the laser resonator cavity. Subsequent experiments will use an OC with a transmittance of 30%. The inset in Figure 4 illustrates the output spectrum, which was measured using a spectrometer (APE, waveScan-Extended IR) at the maximum output power of the laser. It is evident that at an output power of 18.64 W and central wavelength or 2081 nm, the full width at half maximum (FWHM) corresponds to 1.1 nm.
Output power versus absorbed pump power at different OCs. Insert, central wavelength at maximum output power.

Figure 4 Long description
The x-axis represents Absorbed pump power in Watts (W) ranging from 0 to 30. The y-axis represents Output power in Watts (W) ranging from 0 to 20.
Legend and Data Trends:
- Red circles and line: T = 30%, eta = 90.6%. This line has the steepest slope, reaching nearly 20 W output at 27 W pump power.
- Green circles and line: T = 40%, eta = 86.2%. This line sits in the middle.
- Blue circles and line: T = 50%, eta = 82.8%. This line has the shallowest slope, reaching approximately 17 W output at 27 W pump power.
All three datasets show a linear increase starting from a threshold pump power of approximately 6 W.
Inset Plot:
Located in the bottom-right, this smaller graph shows a sharp spectral peak. The x-axis is Wavelength in nanometers (nm) from 2060 to 2100. A narrow red peak is centered at 2081 nm with a measured width of 1.1 nm indicated by two horizontal arrows.
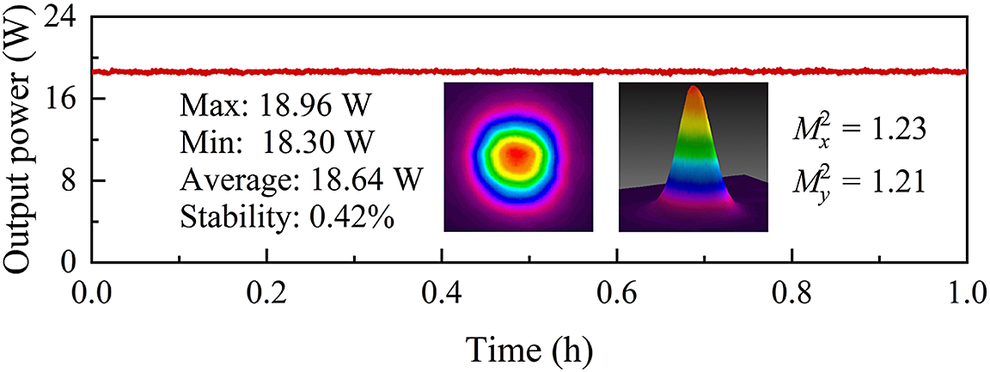
For a maximum output power of 18.64 W, the Ho:CYA laser displays weak power fluctuations, as demonstrated in Figure 5. The RMS stability of the laser was calculated to be 0.42% within a 1-hour time range. The beam profile of the output laser in the far-field was observed using a beam quality analyser (Ophir, PYROCAM, IV), as illustrated in the inset of Figure 5. It is evident that the laser maintains the optimal beam quality at the maximum output power. The M 2 values obtained by fitting the 90/10 scanning-knife-edge method are 1.23 in the x-direction and 1.21 in the y-direction.
RMS stability of maximum output power. Insert, far-field two-dimensional and three-dimensional beam profiles.

Figure 5 Long description
A line graph with a horizontal x-axis labeled Time in h ranging from 0.0 to 1.0 and a vertical y-axis labeled Output power in W ranging from 0 to 24. A red line remains nearly flat at approximately 18.6 W across the entire duration.
To the left of the center, a text block lists:
* Max: 18.96 W
* Min: 18.30 W
* Average: 18.64 W
* Stability: 0.42%
In the center, two inset panels show beam profiles:
* The first inset is a two-dimensional heat map with a circular gradient moving from a red core to yellow, green, blue, and purple outer rings.
* The second inset is a three-dimensional Gaussian-shaped peak with the same color gradient, rising from a dark purple base to a red tip.
To the right of the insets, two beam quality values are listed:
* M sub x super 2 = 1.23
* M sub y super 2 = 1.21
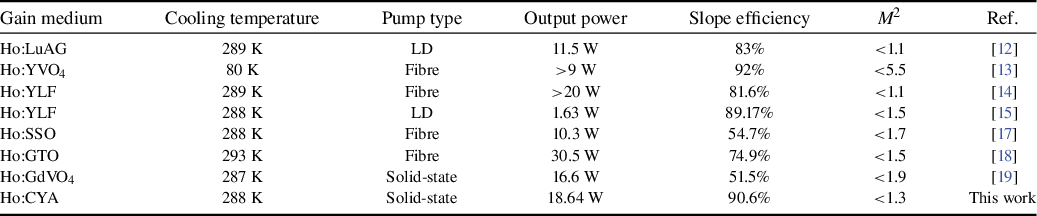
Table 1 provides a concise overview of the key performances of contemporary high-slope-efficiency Ho-doped solid-state lasers. The table encompasses critical parameters such as the gain medium, cooling temperature, pump type, output power, slope efficiency and beam quality. It is evident that under room temperature conditions (285–300 K), a slope efficiency approaching 90% was attained only in the Ho:YLF gain medium. The work presented here successfully achieves a slope efficiency of 90.6%, while concurrently attaining an output power of 18.64 W. It is hypothesized that high-slope-efficiency Ho:CYA lasers may find applications in space communication, minimally invasive medicine and military protection.
Comparison of output characteristics of Ho-doped solid-state lasers with high slope efficiency relative to absorbed pump power.

Table 1 Long description
The table consists of seven columns and eight data rows. The columns are Gain medium, Cooling temperature in Kelvin, Pump type, Output power in Watts, Slope efficiency in percentage, M super 2 beam quality, and Reference.
* Row 1: H o colon L u A G, 289 K, L D pump, 11.5 W, 83 percent, M super 2 less than 1.1, Reference 12.
* Row 2: H o colon Y V O sub 4, 80 K, Fiber pump, greater than 9 W, 92 percent, M super 2 less than 5.5, Reference 13.
* Row 3: H o colon Y L F, 289 K, Fiber pump, greater than 20 W, 81.6 percent, M super 2 less than 1.1, Reference 14.
* Row 4: H o colon Y L F, 288 K, L D pump, 1.63 W, 89.17 percent, M super 2 less than 1.5, Reference 15.
* Row 5: H o colon S S O, 288 K, Fiber pump, 10.3 W, 54.7 percent, M super 2 less than 1.7, Reference 17.
* Row 6: H o colon G T O, 293 K, Fiber pump, 30.5 W, 74.9 percent, M super 2 less than 1.5, Reference 18.
* Row 7: H o colon G d V O sub 4, 287 K, Solid-state pump, 16.6 W, 51.5 percent, M super 2 less than 1.9, Reference 19.
* Row 8: H o colon C Y A, 288 K, Solid-state pump, 18.64 W, 90.6 percent, M super 2 less than 1.3, This work.
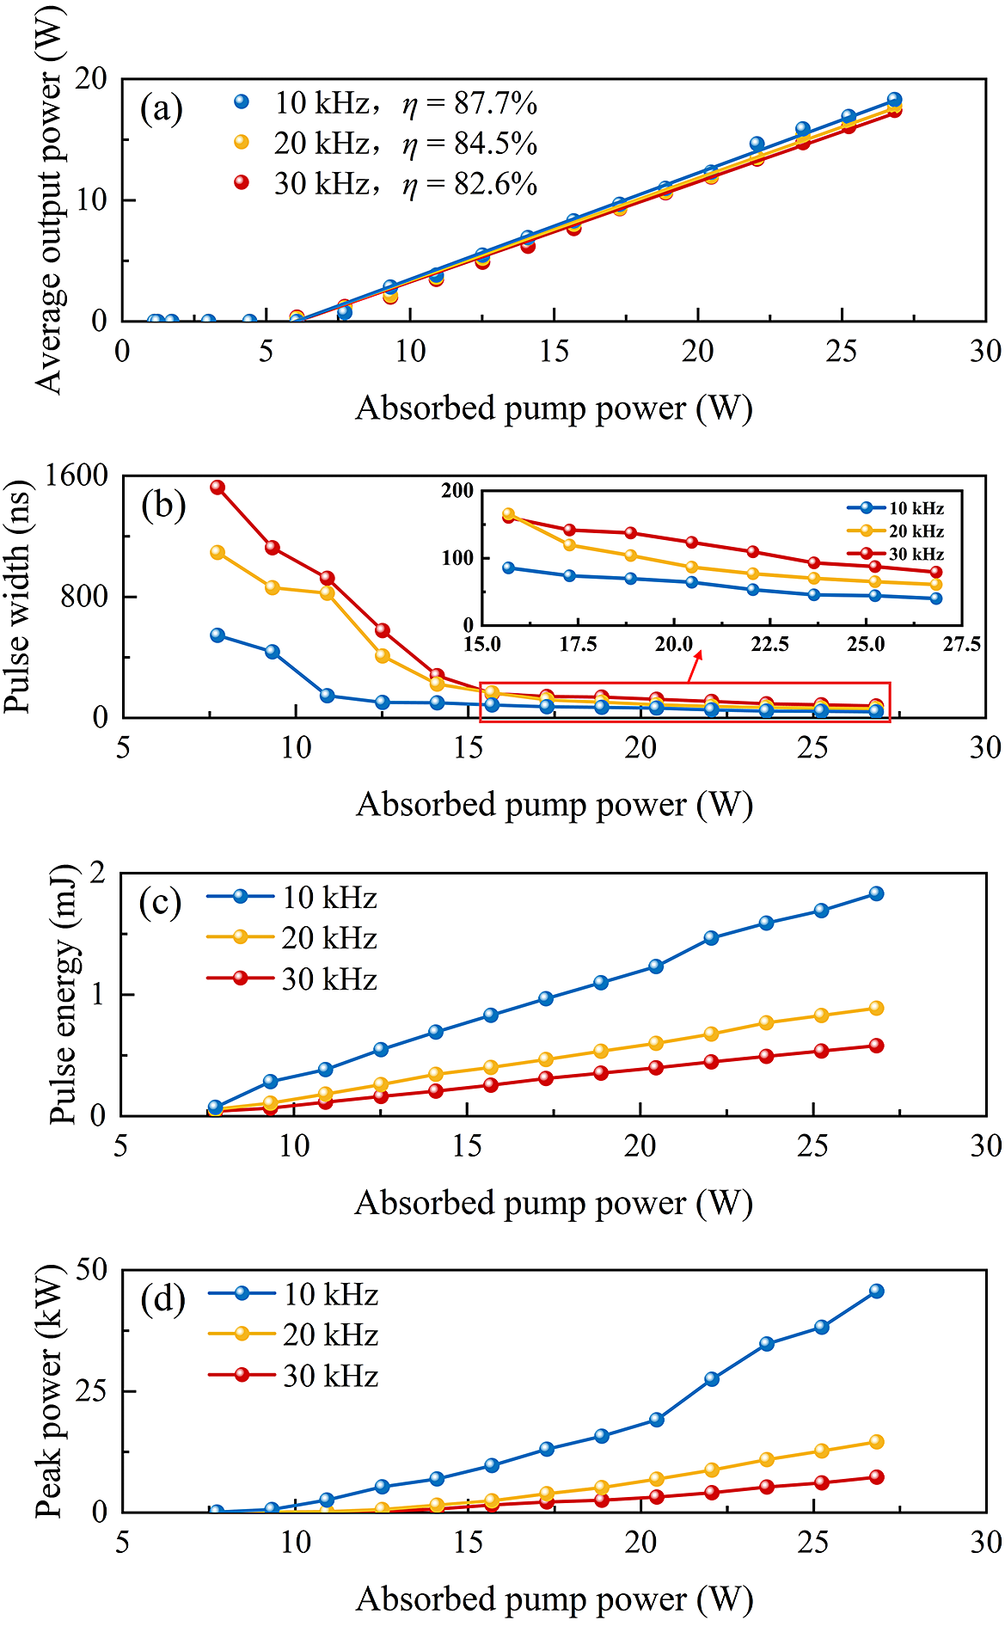
The output performances of the AQS Ho:CYA laser were verified by inserting an AOM with an operating frequency of 40.68 MHz and a drive power of 20 W (SGQ41-2000-1QC) in the resonator cavity. As demonstrated in Figure 6(a), at varying pulse repetition rates, the output power of the Ho:CYA laser displays a direct correlation with the absorbed pump power. The slope efficiencies obtained from the linear fitting were 87.7% (10 kHz), 84.5% (20 kHz) and 82.6% (30 kHz), respectively. At an absorbed pump power of 26.83 W, the maximum average output powers of the laser are 18.26 (10 kHz), 17.79 (20 kHz) and 17.42 W (30 kHz), respectively (the frequency setting of the AOM is below 10 kHz, resulting in insufficient modulation capability and the presence of a continuous wave laser in the output pulsed laser). Pulse waveform information was recorded using an InGaAs photodetector (EOT, ET-5000) and an 8 GHz digital oscilloscope (Tektronix, MSO64B). As demonstrated in Figure 6(b), under different pulse repetition rates, the pulse widths of the output laser display a decreasing trend with increasing absorbed pump powers, with the narrowest pulse widths being 40.1 ns (10 kHz), 61.0 ns (20 kHz) and 79.3 ns (30 kHz), respectively.
(a) Average output power, (b) pulse width, (c) pulse energy and (d) peak power versus absorbed pump power at different pulse repetition rates.

Figure 6 Long description
The figure consists of four panels, each with absorbed pump power in W on the x-axis ranging from 0 to 30. All panels feature three data series: 10 k H z in blue, 20 k H z in yellow, and 30 k H z in red.
Panel a: Average output power in W on the y-axis. All three series show a linear increase starting from a threshold of approximately 7 W. The 10 k H z series has the highest slope with an efficiency eta of 87.7 percent, followed by 20 k H z at 84.5 percent, and 30 k H z at 82.6 percent.
Panel b: Pulse width in n s on the y-axis. The curves show a sharp exponential decay from 8 W to 15 W, then level off. An inset graph zooms into the 15 to 27.5 W range, showing the 10 k H z pulse width decreasing from 100 to 50 n s, while the 30 k H z width decreases from 200 to 100 n s.
Panel c: Pulse energy in m J on the y-axis. All three series show a linear increase starting at 7 W. The 10 k H z series reaches nearly 2 m J, while the 30 k H z series reaches approximately 0.6 m J at maximum pump power.
Panel d: Peak power in k W on the y-axis. The 10 k H z series shows a steep, slightly upward-curving increase reaching nearly 50 k W. The 20 k H z and 30 k H z series show much shallower linear increases, reaching approximately 15 k W and 8 k W respectively.
The pulse energy of the laser at varying levels of absorbed pump power was calculated by dividing the average output power by the pulse repetition rate, as demonstrated in Figure 6(c). The pulse energy of the laser varied almost linearly with the absorbed pump power. Within the range of absorbed pump power from 7.73 to 26.83 W, the variation range of pulse energy is 0.07–1.83 mJ (10 kHz), 0.06–0.89 mJ (20 kHz) and 0.04–0.58 mJ (30 kHz), respectively. As is well established, the peak power is a pivotal metric for evaluating pulsed lasers. The ratio of the pulse energy to the pulse width was calculated to further determine the peak power of the laser under different absorbed pump powers, as demonstrated in Figure 6(d). At an absorbed pump power of 26.83 W, the peak power of the laser was 45.54 (10 kHz), 14.58 (20 kHz) and 7.32 kW (30 kHz), respectively. During AQS operation, the pulse width is predominantly influenced by the initial reversed particle density at the moment of Q-switch activation and the photon density within the cavity. At a fixed pump power, a repetition rate of 10 kHz results in longer pulse intervals, allowing for more complete accumulation of inverted particles and higher energy storage. Consequently, narrower pulses with higher peak power can be achieved. Conversely, a repetition rate of 30 kHz leads to incomplete recovery of inverted particles, causing the pulse width to broaden accordingly.
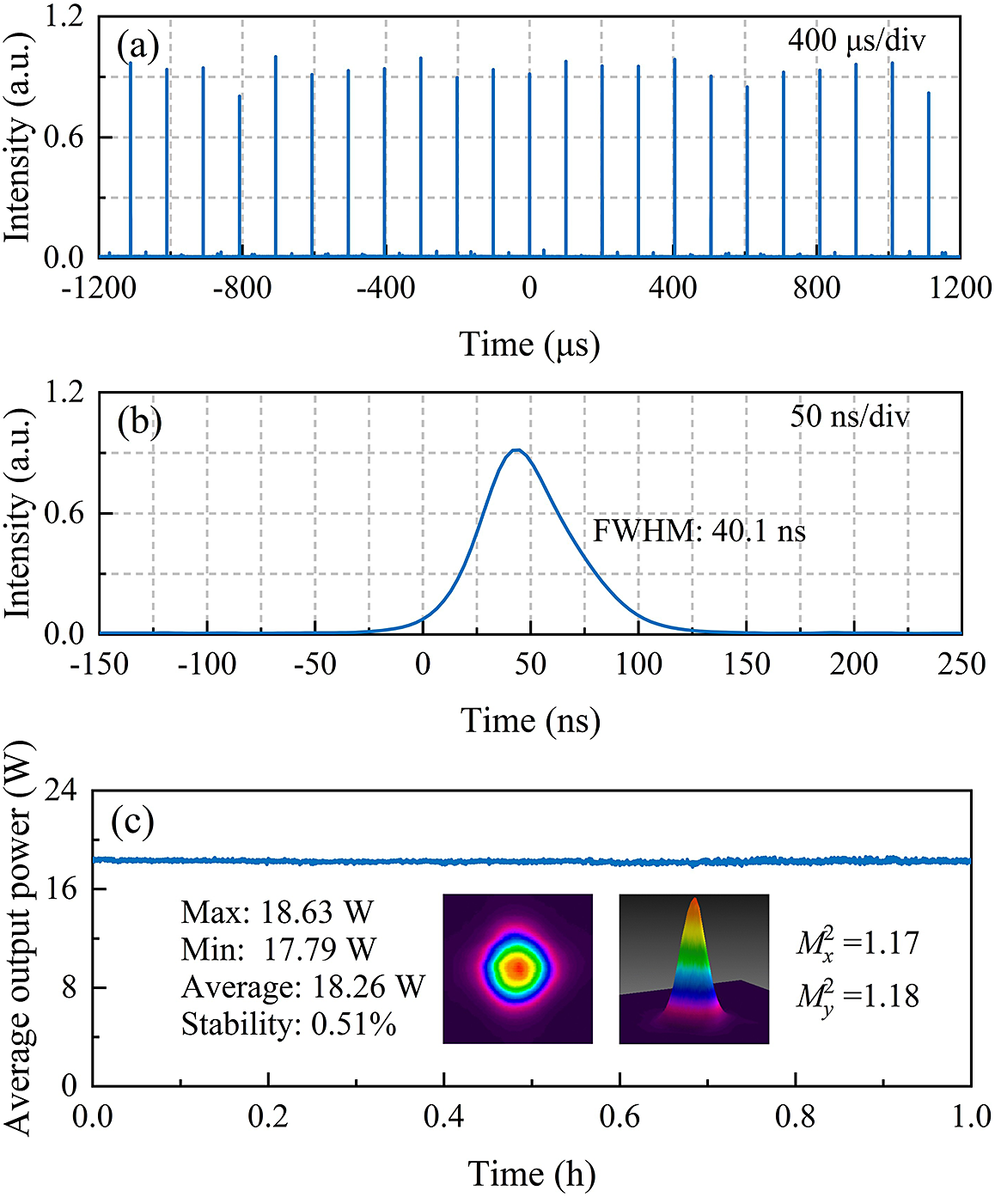
At a pulse repetition rate of 10 kHz, a stable pulse train of the laser was observed at a time-scale of 400 μs/div, as illustrated in Figure 7(a). It was observed that weak sub-pulses were presented at the baseline of the pulse sequence. The weak sub-pulse appearing on the trailing edge of the main pulse is closely related to the ground-state reabsorption effect of Ho3+. Its intensity directly depends on the instantaneous level of inverted particles. When the main pulse depletes the inverted particles but not completely, residual gain can be re-excited by cavity noise or backscattered light, forming such tail pulses. The pulse width of the laser at 50 ns/div was 40.1 ns, as depicted in Figure7(b). The power stability and beam quality of the AQS Ho:CYA laser were measured using the same method as that without the insertion of the AOM, as demonstrated in Figure 7(c). Before and after AOM insertion, the RMS stability of the Ho:CYA laser improved from 0.42% to 0.51%. It is noteworthy that the M 2 of the laser in the AQS mode is 1.17 in the x-direction and 1.18 in the y-direction. The enhancement in the M 2, as observed in AQS mode, may be associated with the dynamic characteristics of thermally induced wavefront aberrations when operating in a high-repetition-rate pulsed state. However, it should be noted that the measured continuous wave slope efficiency is slightly higher than that in AQS mode, suggesting that thermal loading in the AQS system may not be significantly reduced. It has been demonstrated that factors such as insertion loss, introduced by the AOM, may contribute to an additional thermal load. Consequently, the enhancement in M 2 may be partly ascribed to the mitigation of higher-order modes by pulse extraction dynamics.
(a) Stable pulse train, (b) single pulse profile and (c) RMS stability at maximum average output power in AQS mode. Insert, far-field two-dimensional and three-dimensional beam profiles.

Figure 7 Long description
Panel a is a line graph of Intensity in a.u. versus Time in microseconds. It shows a stable pulse train with vertical blue peaks of approximately 1.0 intensity spaced evenly across a range from negative 1200 to 1200 microseconds. A label in the top right reads 400 microseconds forward slash div.
Panel b is a line graph of Intensity in a.u. versus Time in nanoseconds. It displays a single Gaussian-shaped pulse peaking at approximately 0.9 intensity around 45 nanoseconds. The text F W H M 40.1 ns is positioned next to the curve. The time axis ranges from negative 150 to 250 nanoseconds. A label in the top right reads 50 ns forward slash div.
Panel c is a line graph of Average output power in Watts versus Time in hours. A horizontal blue line remains steady at approximately 18 Watts from 0.0 to 1.0 hours. To the left of the center, text lists Max 18.63 W, Min 17.79 W, Average 18.26 W, and Stability 0.51 percent. To the right, two beam profiles are shown. The first is a two-dimensional circular heat map with a red and yellow core transitioning to green, blue, and purple. The second is a three-dimensional conical peak with similar color mapping. To the far right, text indicates M sub x super 2 equals 1.17 and M sub y super 2 equals 1.18.
5 Conclusion
In summary, a high-slope-efficiency Ho:CYA laser using the traditional water-cooling method was successfully achieved. Through meticulous regulation of the radius of the pump and laser spots, an overlapping efficiency exceeding 98% was attained in the gain medium. Utilizing an OC with a transmittance of 30%, a maximum output power of 18.64 W at 2081 nm was achieved, and this corresponds to a slope efficiency of 90.6% relative to the absorbed pump power. Furthermore, the insertion of an AOM within the resonator cavity enabled the development of a high-slope-efficiency AQS Ho:CYA laser. The experimental findings demonstrate that the slope efficiency can reach 87.7%, which corresponds to a maximum average output power of 18.26 W with a pulse width as narrow as 40.1 ns. The calculated pulse energy and peak power are 1.83 mJ and 45.54 kW, respectively. Notably, the slope efficiency of this laser is the highest among Ho-doped solid-state lasers at room temperature.
Acknowledgements
This work was supported by the Key Research and Development Plan of Xinjiang Uygur Autonomous Region (Grant Nos. 2022B01040 and 2022B01040-2), the Key Project of Heilongjiang Natural Science Foundation (Grant No. ZD2021F002), the National Natural Science Foundation of China (Grant No. 62405363) and the National Funded Postdoctoral Fellowship Program of CPSF (Grant No. GZC20232960).

 Open access

