Implications
Mycotoxins are secondary metabolites of filamentous fungi able to negatively affect animal health and performance and could enter the human food chain through animal products. Maize-based feedstuff may be contaminated by different blends of mycotoxins with negative effects on animal health and performance. The presence of mycotoxins in feed has different thresholds for growing and lactating cattle in EU. The feeding of replacement heifers from 5 to 10 months of age with different blends of aflatoxin and fumonisin–co-contaminated maize grain was tested to assess the effects on their growth and physiology. The aflatoxin–fumonisin co-contamination worsened growth and reproductive performance.
Introduction
Mycotoxins are secondary metabolites produced by certain fungi as a result of their growth on feeds. Aspergillus, Fusarium and Penicillium spp. are the genera of major interest for their capacity to produce several toxins that can negatively affect animal health and enter the human food chain, (Sweeney and Dobson, Reference Sweeney and Dobson1998). The Aspergillus mycotoxin aflatoxin B1 (AFB1) is of great interest for the dairy farmer because it contaminates feeds, which are commonly fed to lactating cows (Sweeney and Dobson, Reference Sweeney and Dobson1998). The AFB1 is metabolized by the cow and excreted as its derivative aflatoxin M1 (AFM1) into the milk (Masoero et al., Reference Masoero, Gallo, Moschini, Piva and Diaz2007). The EU regulation is extremely severe about the contamination with aflatoxins in the diets of lactating cattle, with a threshold of 0.005 ppm; instead, diets for growing cattle can contain up to 0.020 ppm (European Commission, 2003). For this reason, the feed industry chooses with great caution ingredients for lactating cows, although it is more common to find some moderate contaminations in the diets of replacement heifers. The Fusarium spp. produce three families of toxic molecules: trichothecenes, fumonisins and zearalenone (ZEA) (Sweeney and Dobson, Reference Sweeney and Dobson1998; Placinta et al., Reference Placinta, D’Mello and Macdonald1999). These molecules are of relatively low toxicity, but they show a subtle capacity to cause chronic damage of tissues and organs that leads to weight loss, immunodepression and worsened reproductive performance (Diekman and Green, Reference Diekman and Green1992; Tripathi et al., Reference Tripathi, Mondal and Karim2008; Martin et al., Reference Martin, Wood, McEwen, Smith, Mandell, Yannikouris and Swanson2010). Fumonisin B1 (FB1), deoxynivalenol (DON, or vomitoxin) and ZEA may be present in several cereals, and cases of co-contamination are documented for maize (Placinta et al., Reference Placinta, D’Mello and Macdonald1999).
Ruminants are generally considered less susceptible to mycotoxin-related health problems than non-ruminants, because the components of rumen microbiota can detoxify or bind these molecules (Gallo and Masoero, Reference Gallo and Masoero2010). However, some aspects of their resistance are not fully clear and, in some circumstances, they do not appear to be effective: for example, when rumen is not fully developed, or when it does not function properly or when animals are chronically fed contaminated feeds. Both AFB1 and fumonisins are classified as hepatotoxins; fumonisins are also classified as nephrotoxins and affect the lung and respiratory tract (Turk and Casteel, Reference Turk and Casteel1997). The co-contamination from both Aspergillus and Fusarium toxins is a possible case that needs to be monitored, especially in maize. This co-contamination in EU Countries was recently analysed and confirmed to be a problem by Streit et al. (Reference Streit, Schatzmayr, Tassis, Tzika, Marin, Taranu, Tabuc, Nicolau, Aprodu, Puel and Oswald2012). The use of feeds with this co-contamination is difficult in lactating ruminants because of the risk to contaminate the milk with AFM1; therefore, a shift in the feeding practice of the growing non-lactating heifer may be suspected. The combined action of these toxins might not be simply additive, but more probably synergic (Speijers and Speijers, Reference Speijers and Speijers2004), and research on this topic is still scarce.
The aim of this paper was to assess the long-term effects of feeding a different blend of aflatoxin and fumonisin from naturally contaminated maize grains (below the levels recommended by the European Commission, 2003) on heifer growth, haematology, metabolic profile and puberty onset, to compare the effect of a mild AFB1 contamination both when it is or it is not linked to a fumonisin co-contamination.
Material and methods
Animals, diets, ingredients and trial management
The trial was conducted at the ‘Porcellasco’ experimental farm of the ‘Consiglio per la Ricerca e la Sperimentazione in Agricoltura’ (Agricultural Research Council), Cremona, Italy.
A total of 36 Italian Friesian heifers (18 to 21 weeks old) were randomly allotted to three experimental groups. The heifers were previously blocked by age and BW, to obtain three experimental groups (C, A and A-F) that were homogeneous for these features. At the start of the experimental period (EP), heifers’ age and BW were 20.4±0.7 weeks and 114±13 kg in C, 20.6±1.1 weeks and 111±12 kg in A, and 21.1±1.0 weeks and 120±14 kg in A-F, respectively.
During the 24 weeks of EP, the groups were fed the same diet, but with maize meal from three differently contaminated lots: with very low contamination from mycotoxins, as control (C); medium–low aflatoxin-contaminated (A); and contaminated with both AFB1 and FB1 (A-F). At the end of the EP, the heifers returned to a common diet with very low contaminated maize meal (as in C during the EP), and they were monitored during a post-experimental period (PEP) of 12 weeks.
The diet for the EP was formulated for Holstein-type heifers from 5 to 10 months of age, and for a live weight gain of 0.800 kg/day according to National Research Council (2001) (Supplementary Table S1). The basal diet was formulated as total mixed ration (TMR) distributed once daily in the morning, on a group basis. Within each experimental group, three sub-groups of four heifers (12 heifers/group) were submitted to the trial, to be fed with a total dry matter (DM) availability calculated according to the average BW of the group; a refusal amount of <5% was expected. Consequently, the average feed DM administered was 3.4, 3.7, 4.2, 4.8, 5.3 and 5.8 kg/day per head at 20, 24, 28, 32, 36 and 40 weeks of age, respectively. This feeding strategy was applied to avoid a bias, which would be a consequence of variable TMR availability with a fixed amount of contaminated maize meal.
During the EP, heifers were fed identical amounts of maize meal, but of different origins. To match our experimental goal, we identified three different lots of maize meal, with different levels of natural mycotoxin contamination. The C meal was chosen after a specific survey of the lot with very low contamination. The A meal was chosen after specific research of the lot with low contamination of Aspergillus to respect the threshold of 20 ppb from official recommendation (European Commission, 2003) and after analytical confirmation of a fumonisin B1+B2 contamination ranging below 3000 ppb (geometric mean of B1+B2). The A-F meal was chosen with the same procedure after the assessment of a natural co-contamination from aflatoxins above 10 ppb (geometric mean) and fumonisins (B1+B2), ranging from 5000 to 20 000 ppb (geometric mean above 5000 ppb). The contamination by other mycotoxins (i.e. DON) was also monitored to avoid a bias in the interpretation of the results of our trial. The individual amount of contaminated maize meal was added as top-dressed in the morning for each animal during a short self-locking, with the operator who assessed the total intake of the meal.
Growth measurements and blood sampling on heifers
Heifers’ BW, wither height (WH), hip height (HH), body length (BL) and heart girth (HG) were measured every 4 weeks from the beginning of EP to the end of PEP. At the same time, the body condition score of each heifer was assessed according to our previous research (Abeni et al., Reference Abeni, Calamari, Stefanini and Pirlo2000).
In the same time schedule, blood samples were taken to determine haematological, serum protein and metabolic profiles. According to our previous papers (Abeni et al., Reference Abeni, Bergoglio, Masoero, Terzano and Borghese2003, Reference Abeni, Federici, Speroni, Petrera, Pisacane, Terzano, Capelletti, Pirlo and Aleandri2012b), a weekly sampling schedule from 40 to 60 weeks of age was adopted to assess the age at puberty by measuring plasma progesterone (P4) concentration in venous blood. Blood samples were drawn from the jugular vein, before morning ration distribution.
Chemical analysis in feeds
Feed analysis was performed at the Feed and Food Science and Nutrition Institute (Università Cattolica del Sacro Cuore, Piacenza, Italy). Briefly, the aflatoxins in feeds were extracted with a methanol : water solution (80 : 20 vol/vol) and analysed according to Masoero et al. (Reference Masoero, Gallo, Diaz, Piva and Moschini2009). The fumonisins (i.e. FB1 and FB2) and DON were, respectively, extracted with a methanol : water (75 : 25 vol/vol) and an acetonitrile : water (10 : 90 vol/vol) solutions and analysed according to Pietri et al. (Reference Pietri, Bertuzzi, Pallaroni and Piva2004). The HPLC analysis to determine aflatoxin and fumonisin concentrations was performed by a Perkin Elmer LC equipped with a model LC-200 pump (Perkin Elmer, Norwalk, CT, USA) and a Jasco FP-920 fluorescence detector (Jasco, Tokyo, Japan). The system and data acquisition were controlled by Perkin Elmer Turbochrom PC software. The DON was quantified by gas chromatographic analysis, carried out by a Perkin Elmer model 8500 equipped with 63Ni electron-capture detector (Perkin Elmer). Data acquisition was carried out by Perkin Elmer PC Nelson software.
Blood analysis
Blood samples for haematological profile were drawn in K3EDTA-treated tubes (5 ml, Venoject; Terumo, Leuven, Belgium), and immediately analysed using a Cell-Dyn® 3700 haematology analyser (Abbott Diagnostics, Roma, Italy). The results from the instrument were monitored with whole blood reference control (Cell-Dyn® Control; Abbott Diagnostics). The measurements were: total red blood cell number (RBC, M/μl); haemoglobin (g/dl); haematocrit (Hct, %); mean corpuscular volume (MCV, fl); mean corpuscular haemoglobin (MCH, pg); mean corpuscular haemoglobin concentration (g/dl); width of RBC volume distribution (RDW, %); total white blood cell number (WBC, K/μl); neutrophils (K/μl and % of WBC); lymphocytes (K/μl and % of WBC); monocytes (K/μl and % of WBC); eosinophils (K/μl and % of WBC); basophils (K/μl and % of WBC); total platelet number (K/μl); mean platelet volume (MPV, fl); plateletcrit (PCT, %); and platelet volume distribution width (PDW, %). Blood samples for serum protein profile were drawn in tubes without anticoagulant and allowed to clot at room temperature; then, serum was separated and frozen at −20°C until analysis. Serum protein profile was assessed by agarose gel electrophoresis using a standard kit for blood serum proteins (Hydragel 30; Sebia Italia, Firenze, Italy) on an automated multiparametric agarose gel electrophoresis system (Hydrasis; Sebia Italia). The gels were analysed by a densitometer and dedicated software (Phoresis; Sebia Italia). The obtained fractions were: albumin, alpha-1 (α 1), alpha-2 (α 2), beta (β) and gamma (γ) globulins. Blood samples for biochemical metabolic profile were drawn in lithium–heparin-treated tubes (10 ml Venoject; Terumo) and immediately centrifuged for the separation of plasma, which was frozen at −20°C until analysis. Plasma metabolites (glucose, cholesterol, urea, total protein, albumin, creatinine, Ca, inorganic P, Mg, Na, K and Cl), enzymatic activities (aspartate aminotransferase, AST; γ-glutamyl transferase, GGT; alkaline phosphatase, ALP; lactate dehydrogenase, LDH), total and conjugated bilirubin were determined using an automated analyser for biochemical chemistry (ILAB 600 Plus; Instrumentation Laboratory, Lexington, MA, USA), and its dedicated kits. Plasma levels of reactive oxygen metabolites (ROM) and total thiol groups (SHp) were run with colorimetric methods (Diacron, Grosseto, Italy). Progesterone level was determined by a solid phase P4 radioimmunoassay kit (DPC-solid phase RIA kit P4; Diagnostic Products Corporation, Los Angeles, CA, USA).
Data calculations and statistical analysis
Plasma globulin concentration was obtained as the difference between total protein and albumin; then, the plasma albumin/globulin ratio (A/G ratio) was calculated. Plasma cation–anion balance (CAB) was calculated for each blood sample according to the formula: CAB (meq/l)=Na (meq/l)+K (meq/l)−Cl (meq/l). The age at puberty was considered as the 1st week when P4 was above 1 ng/ml if confirmed by a successive cycle (two of three samples above 1 ng/ml).
Data from body growth measurements were analysed both by ANOVA of average daily gain (ADG) of EP and PEP separately, and by the analysis of growth curve parameters. In the first case, the ADG of each heifer for each variable was analysed by ANOVA using MIXED procedure of SAS/STAT software in the SAS System for Windows, release 9.3 (SAS Institute Inc. 2008). The statistical model included the fixed effect of the experimental diet, with the individual heifer as a random effect. To describe the growth curve, three models were analysed with the aim to assess which best fitted the data of BW measurement: first- and second-order polynomial regressions using the PROC REG; the Laird’s form of Gompertz’s growth curve using the PROC NLIN. The curves that best fitted our data (highest R 2) were the second-order polynomial, and their parameters (intercept b 0, linear coefficient b 1 and quadratic coefficient b 2) were then submitted to ANOVA, where the main factor analysed was the diet during EP. Data obtained on the same subject were evaluated by repeated measurements ANOVA using the MIXED procedure of SAS/STAT software in the SAS System for Windows, release 9.3 (SAS Institute Inc. 2008). The main effects were the diet during EP (C, A or A-F), time of sampling (0, 4, 8, 12, 16, 20 and 24 weeks for EP; 4, 8 and 12 weeks for PEP), season of sampling (summer, autumn, winter and spring) and their interaction with time of sampling as repeated measurement. The repeated measurements on the same subjects determined the block diagonal structure of the residual covariance matrix used in the analyses. For each variable, different covariance structures were tested (SIMPLE, CS, AR1, ANTE1, UN), and the best was chosen according to the Akaike’s Information Criteria. The least squares means (LS means) were calculated and pairwise tested for each effect in each model, and the r.s.d. jointly reported. Orthogonal contrasts (C v. A, A-F; C, A v. A-F) were also tested. Results of season effect will not be discussed in the present paper unless they interact with the diet. Significance was set at P<0.05, and a trend was considered for P<0.10. The effect of EP diet on puberty attainment was tested calculating the χ 2 test comparing the number of heifers reaching puberty within the monitored period in A and A-F groups, with the number of heifers reaching puberty in C. The ANOVA was also performed on the age at puberty for the heifers that attained it within 60 weeks.
Results
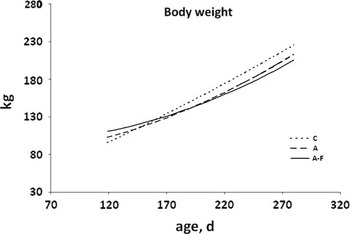
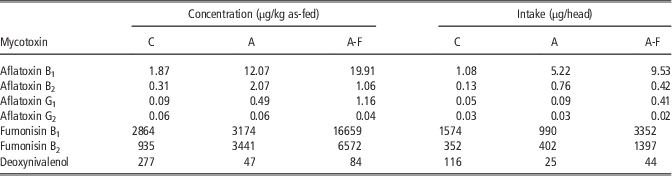
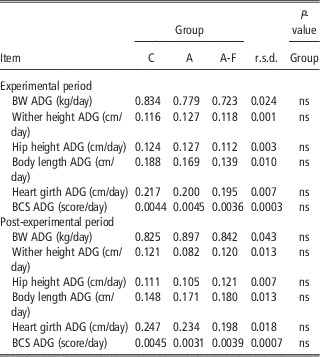
The mycotoxin concentrations found in maize meals during the trial were reported in Table 1. To compare the results of this trial with those of previous ones, Table 1 also reports the estimated values (from the geometric mean of concentration) of mycotoxins ingested by heifers throughout the trial. One heifer in group A had to be eliminated because of a gastrointestinal parasitosis, so that her data were excluded from the statistical analysis. The results on the increase of body growth measurement during EP and PEP are reported in Table 2. The comparison of BW growth curves during EP is summarized by the second-order polynomial regressions shown in Figure 1. Administration of contaminated maize meal in A and A-F heifers affected heifer growth, but this was reflected more in the BW growth curve than in the ADG of BW, HH and BL during EP. Values b 0 and b 1 of the growth curve of heifers fed A-F diet were lower (P<0.05) than those of C and A, indicating that contamination caused a delay in the heifers growth pattern. None of these variables recorded in the PEP were affected by EP treatment (Table 2).
Growth curves for BW of dairy heifer in the three groups during the experimental period.

Mycotoxins concentrations (as-fed) in the maize meal feeds and their mean daily intake throughout the trial for the three experimental groups

C=group fed non-contaminated maize meal; A=group fed low aflatoxin-contaminated maize meal; A-F=group fed mixed aflatoxin–fumonisin-contaminated maize meal.
Effect of differently contaminated diets on body growth measurements

C=group fed non-contaminated maize meal; A=group fed low aflatoxin-contaminated maize meal; A-F=group fed mixed aflatoxin–fumonisin-contaminated maize meal; ADG=average daily gain; BCS=body condition score.
The results on erythrocytary and thrombocytary variables during EP (not reported) and PEP (not reported) evidenced that only RBC tended to be affected by diet during EP; specifically, the orthogonal contrast evidenced a lower (P=0.036) RBC count in A-F than in the other groups. In the same period, time of sampling affected all the erythrocytary and thrombocytary variables, with the exception of MPV. We did not observe any significant effect of EP diet on the erythrocytary and thrombocytary features during PEP, whereas time of sampling affected MCV and MCH. The results of leukocytary variables during EP (not reported) and PEP (not reported) were unaffected by the experimental diet.
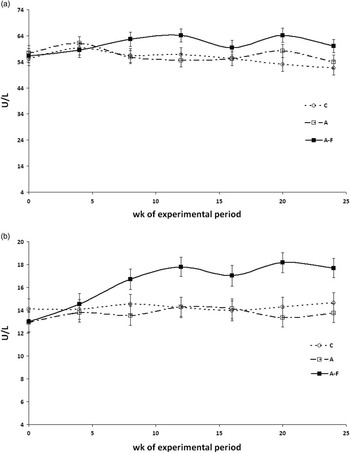
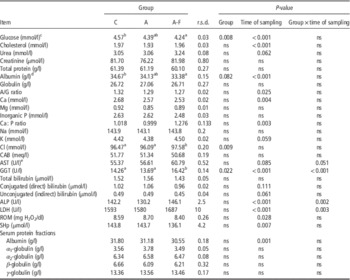
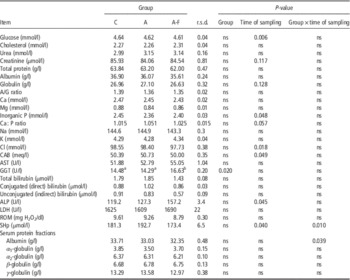
The results on metabolic profile during EP were summarized in Table 3. Plasma glucose of A-F heifers was lower than C heifers from pairwise comparisons. Orthogonal contrasts evidenced a lower (P=0.005) glucose concentration in both groups fed contaminated diets when compared with C. Plasma albumin concentration tended (P=0.082) to be affected by diet, with a decrease in A-F compared with C heifers. Orthogonal contrasts evidenced a lower (P=0.04) albumin concentration in A-F group when compared with the other two. Among the markers of hepatic and hepatobiliary function, the AST activity was higher (P=0.04) in A-F (Figure 2a) than in the other diets, as evidenced from orthogonal contrast. The GGT activity was affected by mycotoxin contamination, with a higher mean value for the overall period in A-F than C and A heifers, and with an interaction with age (Figure 2b). During EP, the heifers fed on A-F diet reported higher (P<0.05) plasma Cl than those fed on C and A diets (Table 3). Age affected the plasma concentration of glucose, cholesterol, albumin, A/G ratio, Ca, Ca : P ratio, GGT, ALP, LDH, ROM, SHp, and tended to affect urea, K, AST and unconjugated bilirubin (Table 3). During the PEP (Table 4), the only significant effect of EP diet on metabolic profile concerned plasma GGT activity, with the highest value in A-F heifers.
Change in plasma (a) aspartate aminotransferase (AST) and (b) γ-glutamyl transferase (GGT) activities in dairy heifers during the experimental period.

Effect of differently contaminated diets on metabolic profile of dairy heifers during the experimental period

C=group fed non-contaminated maize meal; A=group fed low aflatoxin-contaminated maize meal; A-F=group fed mixed aflatoxin–fumonisin-contaminated maize meal; A/G=albumin/globulin; CAB=cation–anion balance; AST=aspartate aminotransferase; GGT=γ-glutamyl transferase; ALP=alkaline phosphatase; LDH=lactate dehydrogenase; ROM=reactive oxygen metabolites; SHp=total thiol groups.
Time of sampling=0, 4, 8, 12, 16, 20 and 24 weeks of experimental period.
abWithin a row, values with different superscripts are significantly different (P<0.05).
c Contrast C v. A, A-F with P=0.005.
d Contrast C, A v. A-F with P=0.040.
e Contrast C, A v. A-F with P=0.040.
Effect of differently contaminated diets on metabolic profile of dairy heifers during the post-experimental period

C=group fed non-contaminated maize meal; A=group fed low aflatoxin-contaminated maize meal; A-F=group fed mixed aflatoxin–fumonisin-contaminated maize meal; A/G=albumin/globulin; CAB=cation–anion balance; AST=aspartate aminotransferase; GGT=γ-glutamyl transferase; ALP=alkaline phosphatase; LDH=lactate dehydrogenase; ROM=reactive oxygen metabolites; SHp=total thiol groups.
Time of sampling=0, 4, 8, 12, 16, 20 and 24 weeks of experimental period.
abWithin a row, values with different superscripts are significantly different (P<0.05).
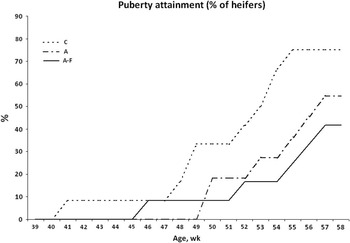
At the end of the trial (60 weeks of age), 75% of C heifers reached puberty, instead of 55% and 42% of heifers in A and A-F group, respectively (Figure 3); according to the χ 2 test, these differences were significant. Among the heifers that reached puberty within the monitored period, the mean (±s.d.) age at the onset was 50.4±4.4, 53.4±3.0 and 53.1±4.4 weeks for C, A and A-F, respectively, without any significant difference.
Puberty attainment of dairy heifer in the three experimental groups during the monitored period for puberty assessment.

Discussion
Effect of mycotoxins on growth
This work gave us the opportunity to analyse a case of possible natural co-contamination by aflatoxins and fumonisins in the diet of dairy heifers, during a long period of the animal’s growing phase. According to the aim of the trial, the A diet was characterized by a mid-level of AFB1 and a low contamination by fumonisins (6615 μg/kg of FB1+FB2 in maize meal). The results from diet A must be critically interpreted at the light of the previous study by Osweiler et al. (Reference Osweiler, Kehrli, Stabel, Thurston, Ross and Wilson1993). In their trial, the low dietary contamination level from fumonisins was set at 31.000 μg/kg (v. a control diet with fumonisins below 5000 μg/kg), and they did not report any effect on BW gain, nor on plasma enzymatic activities related to liver damage. The A-F diet was characterized by higher fumonisins contamination together with the higher aflatoxins content. The control diet (C) was accidentally characterized by a mild contamination with DON; however, this level was abruptly the half of that reported by Martin et al. (Reference Martin, Wood, McEwen, Smith, Mandell, Yannikouris and Swanson2010) in their trial as control diet (v. Fusarium toxin-contaminated diets). The small number of animals within group limited the chance to emphasize the effects on growth; for example, the power of the test (1−β) for BW ADG was <0.40. However, the trend for a delayed growth in the A-F group confirmed that aflatoxin (even at low daily intake, but for an extended period) and fumonisins can negatively affect the performance in young ruminants. These observations agree with those reported by Edrington et al. (Reference Edrington, Harvey and Kubena1994) in lambs. Aflatoxins can reduce BW ADG of growing animals (Edrington et al., Reference Edrington, Harvey and Kubena1994); there are, however, contrasting results (Tripathi et al., Reference Tripathi, Mondal and Karim2008). To the best of our knowledge, specific comparisons on growing dairy heifers are not available. Baker and Rottinghaus (Reference Baker and Rottinghaus1999) fed Holstein steers 86 to 127 kg of BW with 2.36 mg fumonisin/kg BW (at the beginning) to 3.54 mg fumonisin/kg BW after 23 weeks, but they did not report growth measurements. At the beginning of the present trial, mean daily intake of fumonisins was 13.92 and 47.49 μg/kg BW in A and A-F, respectively, which was much lower than values reported by Baker and Rottinghaus (Reference Baker and Rottinghaus1999). According to Tripathi et al. (Reference Tripathi, Mondal and Karim2008), the best regression to describe the growth delay of heifers fed mycotoxin-contaminated diet was a second-order polynomial regression, with the two extreme curves (C v. A-F) differing both in intercept and linear coefficient. We did not observe any kind of compensatory growth in A-F heifers during PEP. This result might be related to the cause of growth delay, which is probably an impairment in liver cells function, and not only a simple temporary nutrient restriction. Therefore, it seems reasonable to suppose a liver tissue damage that also persists in the PEP, as confirmed by the still high GGT in A-F after the end of the treatment.
Mycotoxins effect on blood measurements and puberty onset
The main result on haematological profile was the reduction of circulating RBC in A-F, which was the blend with the highest AFB1 and FB1 levels. The extent of the difference among groups was mild, and this agrees with the results by Tripathi et al. (Reference Tripathi, Mondal and Karim2008) in weaner lambs. These ‘on-field’ results may be partially explained with the suggestion of Parent-Massin (Reference Parent-Massin2004) on the haematotoxicity of trichothecenes that frequently co-contaminate feeds together with fumonisins, leading to a decrease of circulating blood cells. In our case (see Table 1), there was a mild contamination with DON in C diet. Studying the effects of a co-contamination from AFB1 and FB1 in piglets, Dilkin et al. (Reference Dilkin, Zorzete, Mallmann, Gomes, Utiyama, Oetting and Corrêa2003) reported no change in leukocyte populations, but evidenced an increase both in RBC and Hct. Contrary to Edrington et al. (Reference Edrington, Harvey and Kubena1994) in growing lambs, we did not observe a specific effect from aflatoxin on Hct and WBC, probably because of our lower mycotoxin concentration. Our results on RBC features differed from those by Swamy et al. (Reference Swamy, Smith, MacDonald, Boermans and Squires2002) probably because of the differences in the Fusarium mycotoxins blend (in that case, based on DON and fusaric acid).
The decrease in plasma glucose in A-F heifers was not comparable with other trials because there were no similar studies on long-time response to this contamination in growing cattle. One possible reason might be the different ability of their liver (see hepatocellular function markers) to synthesize glucose from its precursors. In growing heifers, Abeni et al. (Reference Abeni, Calamari, Stefanini and Pirlo2012a) reported that plasma glucose was correlated with the parameters of the BW growth curve; this could explain the relationship between the low plasma glucose in A-F heifers and their delay in BW growth. The reduction in plasma albumin in A-F heifers (compared with C) was a sign of damaged hepatic synthesis because of the action of fumonisins. In veal calves, feeding maize grain naturally contaminated with Fusarium mycotoxins (mainly DON and ZEA) tended to increase ADG and to improve feed conversion, but with higher urea N and lower glucose concentrations in plasma (Martin et al., Reference Martin, Wood, McEwen, Smith, Mandell, Yannikouris and Swanson2010); the higher urea N may be explained as the result of an inhibition of rumen microbial protein synthesis by the mycotoxins. From these comparisons, it is clear that different Fusarium mycotoxins may almost act in an opposite manner on the animal, so that it seems necessary to have specific markers for a mycotoxicosis diagnosis. The impairment of nitrogen metabolism caused by AFB1 intoxication was specifically studied by Lynch et al. (Reference Lynch, Smith, Covey and Gordon1973), who analysed the urinary depletion of N, evidencing a high N urinary loss through high creatinine excretion. The long-term feeding of low dietary FB1 levels in rats increased plasma creatinine compared with a control group (Gelderblom et al., Reference Gelderblom, Lebepe-Mazur, Snijman, Abel, Swanevelder, Kriek and Marasas2001). From our results, plasma creatinine was unaffected by mycotoxin contamination, evidencing the lack of a specific impairment of N metabolism in this kind of chronic intoxication. The increased plasma Cl level in A-F heifers agrees with the observation described by Swamy et al. (Reference Swamy, Smith, MacDonald, Boermans and Squires2002) in swine fed grains naturally contaminated with Fusarium mycotoxins (mainly DON and fusaric acid). The same increase in plasma Cl was observed in rats (Takahashi et al., Reference Takahashi, Shibutani, Sugita-Konishi, Aihara, Inoue, Woo, Fujimoto and Hirose2008), as a sign of subchronic toxicity from a nivalenol contamination. In our growing heifers, this change was accompanied by a decrease in Ca and P concentrations (Table 3), but the statistical constraints in this trial did not allow it to reach a significant difference. Lynch et al. (Reference Lynch, Shalkop, Jacoby, Smith and Miller1971) reported a reduction in plasma inorganic P as a sign of liver glycogen mobilization during an acute aflatoxin toxicosis; the condition of chronic contamination in the present trial was not sufficient to elicit such a response. The main effect on metabolic profile in our data was the increase in GGT activity for heifers fed the A-F blend. In addition, it is very important to underline the persistency of increased GGT activity after the suspension of A-F treatment, which could be considered a signal of deep damage to intrahepatic hepatobiliary ducts in the previous phase. The increase in GGT activity in A-F heifers agrees with the results by Osweiler et al. (Reference Osweiler, Kehrli, Stabel, Thurston, Ross and Wilson1993) and Mathur et al. (Reference Mathur, Constable, Eppley, Waggoner, Tumbleson and Haschek2001), confirming the role of GGT as a metabolic marker for intoxication from fumonisins. In growing lambs, Edrington et al. (Reference Edrington, Harvey and Kubena1994) confirmed the damage caused by aflatoxins to hepatic and hepatobiliary cells function with an increase both in serum GGT and AST activities. This latter enzyme activity was higher in the A-F group than in the other two groups (from the orthogonal contrast). According to Baker and Rottinghaus (Reference Baker and Rottinghaus1999) and Gelderblom et al. (Reference Gelderblom, Lebepe-Mazur, Snijman, Abel, Swanevelder, Kriek and Marasas2001), these changes in enzymes activity evidence that hepatic and hepatobiliary tissues are the main target of these mycotoxins. The ALP and total bilirubin values recorded during the EP did not differ among diets probably because of the chronic kind of this challenge. This was the reason for the difference between the results obtained in our trial and those obtained by Lynch et al. (Reference Lynch, Todd, Shalkop and Moore1970 and Reference Lynch, Shalkop, Jacoby, Smith and Miller1971) with AFB1 and by Osweiler et al. (Reference Osweiler, Kehrli, Stabel, Thurston, Ross and Wilson1993) with FB1 and FB2 contaminations; in these two studies, in fact, the challenge was acute. Gelderblom et al. (Reference Gelderblom, Lebepe-Mazur, Snijman, Abel, Swanevelder, Kriek and Marasas2001) also did not report any effect on ALP in rats, after a treatment of chronic intoxication from fumonisins. The lack of a joint change in ALP and total bilirubin was another difference between the present trial and the results from scientific literature (Lynch et al., Reference Lynch, Shalkop, Jacoby, Smith and Miller1971); this difference was probably because of less severe damage to the extra hepatic biliary ducts. In the present trial, the diet did not statistically affect SHp levels, but the mean values declined as the Fusarium toxins increased. As reported by Tanaka et al. (Reference Tanaka, Kamiya, Kamiya, Shioya and Nakai2007), the total SHp concentration in dairy cattle largely reflects the plasma albumin SH groups. There is little information about the markers of oxidative status in growing dairy heifers. The SHp values in PEP were higher than those in EP, and its evolution with age seems to be confirmed by the significant effect of the time of sampling within EP and PEP. Our results also agree with those reported by Piccione et al. (Reference Piccione, Borruso, Giannetto, Morgante and Giudice2007), considering the low metabolic activity of a growing heifer compared with an early lactating dairy cow.
The delay of puberty onset was an important result of this trial, and it was another important sign of the chronic impairment of the metabolism of heifers fed a contaminated diet for a long period. This is especially true when we consider that energy and protein metabolisms were not significantly altered during EP. If we also consider the mild (even significant) change in markers of hepatobiliary damage, we may argue that the main factor that could cause a delay of puberty onset was the delayed attainment of an adequate BW. The puberty onset is generally determined by metabolic and endocrine signals related to the nutritional status of the heifer (Sejrsen and Purup, Reference Sejrsen and Purup1997). Among Fusarium mycotoxins, one of the most active in reproductive endocrinology disruption is ZEA but specific controlled studies on dairy heifers are lacking (Fink-Gremmels and Malekinejad, Reference Fink-Gremmels and Malekinejad2007). In the present study, ZEA was not monitored; however, considering both the lower plasma glucose in A and A-F as a marker of nutritional status, and the signals of hepatic damage in these groups, we suppose that puberty delay was mainly attributable to the reduced growth and impaired liver function. This hypothesis also fits the suggestions proposed by Diekman and Green (Reference Diekman and Green1992). Nevertheless, specific controlled studies will be necessary to address the real impact of ZEA on the peripubertal physiology of dairy heifer.
Conclusion
The effect of feedstuff quality on young dairy cattle health and performance is often underestimated. The prolonged use of mycotoxin-contaminated grains in the diet of peripubertal heifers can lead to subclinical mycotoxicosis, which can be revealed by the plasma metabolic profile. From this trial, the GGT activity and plasma glucose concentration are very sensitive markers for this subclinical challenge. The growth curve of BW was particularly impaired in the A-F group, with a co-occurrence of aflatoxin and fumonisins. No negative effects were reported in the haematological profile of A and A-F group.
One important result from this trial is the reduced percentage of heifers attaining puberty at the end of the monitored period in groups, which have been fed the diet contaminated with high levels of aflatoxins and fumonisins. This seems to have a combined effect on the delay in the growth curve and, probably, on the damage in the liver function as well.
These results suggest that a greater attention had to be paid in the selection of feed for young dairy cattle, even not yet productive, because they represent a key part of the dairy farm system, and their reproductive performance is strategic for the whole efficiency of the productive cycle.
Acknowledgements
This work was funded by the Italian Ministry of Agriculture, Alimentary, and Forestry Policies (MIPAAF), AFLARID Project, coordinated by Gianfranco Piva. We want to thank Mr Gianluca Brusa for his technical support in the management of the herd during the trial.