Introduction
The Great East Japan Earthquake (magnitude 9.0) caused severe damage and generated a massive tsunami along the coast of the Tohoku district on March 11, 2011. Liquefaction and land subsidence occurred in the South Kanto area, which damaged the water supply and sewerage system of a hospital located in the Tokyo Bay area, causing a 4-day suspension of water service that initiated a continuity crisis at that hospital. To manage this crisis, an urgent conference consisting of representatives of each department of the hospital was held. In this meeting, a request for external support and strategies for saving water were discussed and implemented. As a result, the medical treatment of inpatients and emergency care were maintained even with the insufficient water supply.
In a disaster, health care facilities in an affected area can fall into functional decline. If hospitals are damaged by a major disaster, such as an earthquake, hospital functions and activities may see a marked decrease, and immediate external support may not be always available. The sudden halt of all hospital activities not only endangers patients’ lives and the continuity of care for the surrounding community, but can also affect hospital staff and associated suppliers. Therefore, it is necessary for a hospital to maintain critical activities, even in an unexpected crisis.
Reports from previous disasters suggest that hospital disruptions in disaster areas are not caused by building destruction or a decrease in medical supplies, but are due to the prolonged absence of essential services, such as water or gas. However, management strategies and approaches for the unanticipated absence of services essential to efficient hospital operation have received little attention. Examining the experiences of hospitals affected by the Great Hansin Earthquake disaster in 1995 revealed that the biggest cause of functional shortages was suspension of the water supply. Similarly, in the Great East Japan Earthquake, suspension of water, not electricity or gas, occurred in many local hospitals. Therefore, in this study, the focus was on the impact of disrupted water supply.
There have been some reports about water failures in hospitals during disasters and articles about disaster planning.Reference Peters 1 – Reference Gerald 3 In 2012, the Emergency Water Supply Planning Guide for Hospitals and Health Care Facilities was published as a collaborative effort of the Centers for Disease Control and Prevention (CDC, Atlanta, Georgia USA) and the American Water Works Association (Denver, Colorado USA). 4 This planning guide was useful in understanding the emergency water supply plan and identifying typical water usage functions and services or emergency water conservation measures. However, it did not assign priority to operations or estimate daily water consumption in a fully operating hospital.
Recently, the importance of building a comprehensive business continuity plan (BCP) for health care organizations has been emphasized. 5 The BCP is a documented set of procedures and information developed, compiled, and maintained for use during a disaster or other adverse incident, 5 and is a useful tool for averting or managing potential crises. The BCP was developed by several companies as a technique for crisis control and has been adopted by a number of large enterprises; furthermore, several recent articles have mentioned the importance of developing BCPs for medical institutions.Reference Luecke and Hoopingarner 6 – Reference Rozek and Groth 14
The first step in devising a BCP is to perform a business impact analysis (BIA). Following a BIA can facilitate the prioritization of operations and clarifies the medical resources and essential services, such as water supply, necessary for business continuity, thus resulting in a prompt response in disaster situations. In this study, the BIA was applied to investigate the use and priority of water consumption of each department in the hospital and the options for securing water in an emergency. From the results of the BIA, the optimal ways to use and conserve water in the hospital during the disruption of the water supply were investigated. Furthermore, methods to increase the abilities of hospital personnel to manage a disruption in the water supply were explored.
Method
This study was a simulation of the use of a BIA based on the real damage from the major earthquake that occurred on March 11, 2011. The water requirement was estimated under the conditions that followed this disaster, which caused a suspension of the water supply and drainage systems for four days; the interruption of the drainage system continued for a further six days. Water conservation and external sources were used to ensure the availability of the necessary minimum amount of water.
The goals of a BIA are: (1) to identify the types of resources and duties that support business continuity; (2) evaluate these resources quantitatively and qualitatively; (3) determine how severe the results would be when each resource or duty is interrupted; (4) classify resources according to their priority for business recovery; and (5) confirm the important duties at individual levels.Reference Luecke and Hoopingarner 6
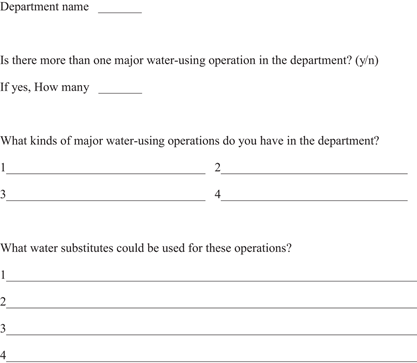
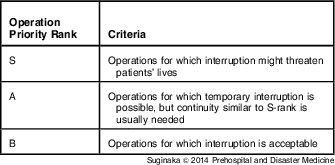
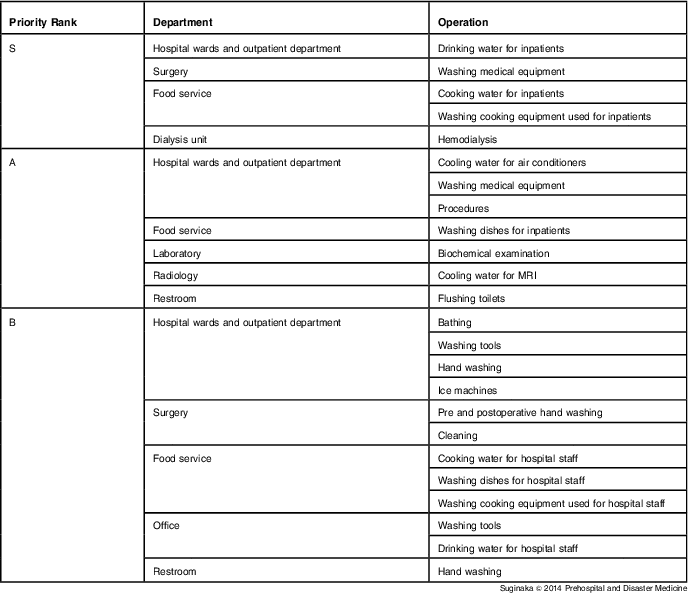
A team of two doctors, two nurses, and one office worker in the hospital devised a BIA questionnaire to examine all operations using water (Appendix). Hospital department, operation name, available substitutes for water, and estimated daily water consumption were included in this questionnaire. Using the results of the questionnaire, the priority of each operation was decided by discussion among the team. Each operation was placed into one of three priority ranks according to the impact on patients’ lives and the need for operational continuity. The “S” rank operations, the highest priorities, were the operations for which interruption might threaten patients’ lives; these operations must never be interrupted. The “A” rank operations were those which could have temporary interruptions, but for which a level of continuity similar to S-rank operations is usually needed. The “B” rank operations were those for which interruption was acceptable (Table 1). Estimated daily water consumption was calculated in two ways: (1) reading the water meters of each section in the hospital (eg, cooling water for air conditioners and cooking water for inpatients and staff), and (2) estimating the water requirement by multiplying one-time standard water consumption for common use or from the design information of each equipment by frequency of use per day (eg, bathing, biochemical examination, hemodialysis, or flushing toilets). Estimated daily water use is presented as the mean (standard deviation). The margin of error for water requirement was calculated based on the daily bed occupancy rate of each day of the week in this hospital in 2012.
Priority Ranking Criteria

Results
This hospital is a university affiliate with 27 departments and 653 beds, including 21 intensive care unit beds. Approximately 2,000 outpatients, 600 inpatients, 25 patients requiring hemodialysis, and 20 surgical operations are managed by 1,500 hospital staff on a regular weekday. In the emergency room, approximately 45 walk-in patients and 15 transported patients are treated each day. Water is supplied to the hospital through underground pipes, saved in two tanks (each storing 160 m3), and delivered to each department. The average daily water consumption is 500-600 m3 on weekdays and 400 m3 on weekends/holidays.
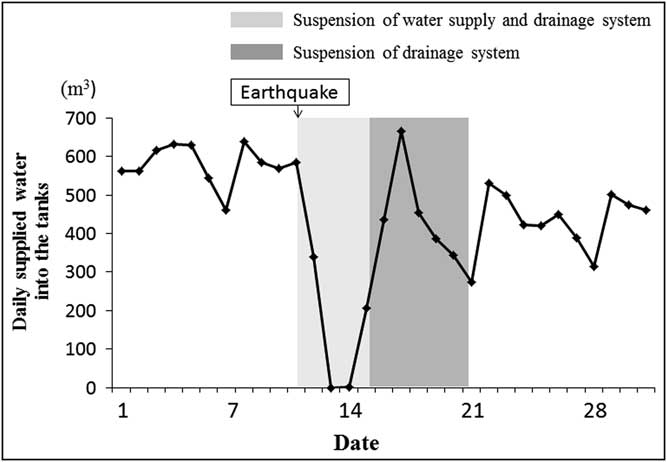
The daily use of water from the water storage tanks in the hospital in March 2011 is shown in Figure 1. On the day of the earthquake, only half of the usual daily water was supplied to the water storage tanks because the underground pipes were broken; furthermore, for the following two days, no water was supplied to the tanks through underground pipes from outside. Meanwhile, the water was supplied by the external support systems, for example, water tankers from neighboring cities.
Daily supplied water into the tanks in the hospital before and after the Great East Japan Earthquake. The Y-axis is the amount of daily supplied water into the water tanks in the hospital through underground pipes. The dates in March 2011 are on the X-axis. The light gray area is the period of water supply and drainage systems disruption. The dark gray area is the period of drainage system disruption. The amount of supplied water is as much as daily use of water except during four days after the earthquake.
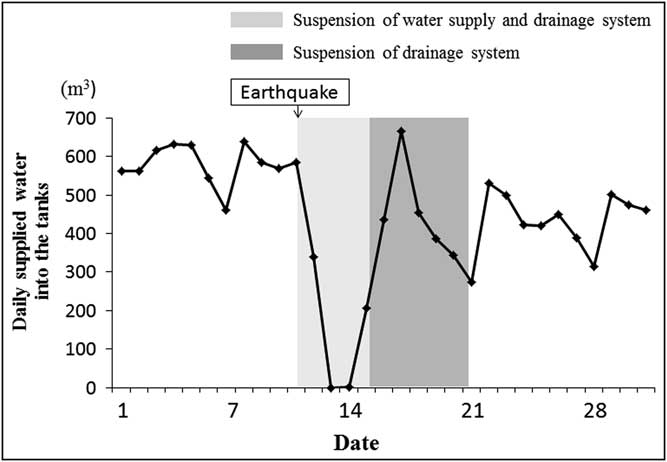
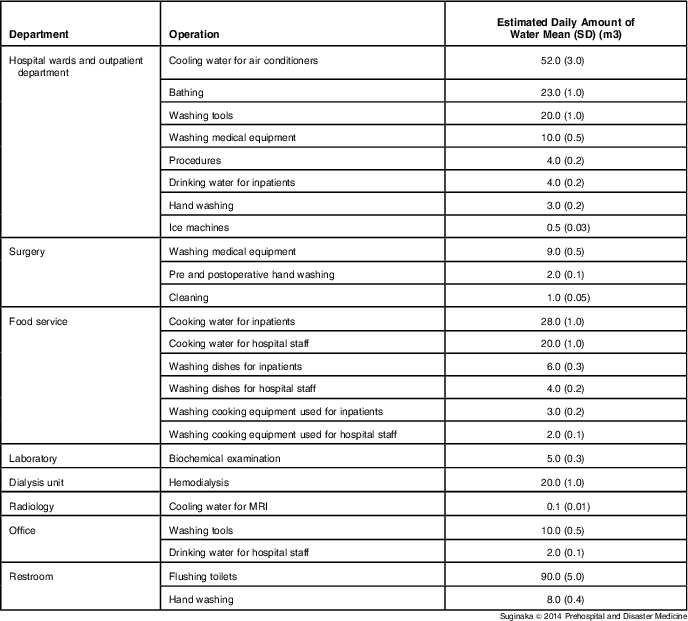
Table 2 shows the operations of each department in the hospital where water was necessary and the estimated water consumption for each department. There were 24 operations in eight departments: (1) wards and outpatients, (2) surgery, (3) dialysis unit, (4) laboratory, (5) radiology, (6) food service, (7) offices, and (8) restrooms.
Water Use
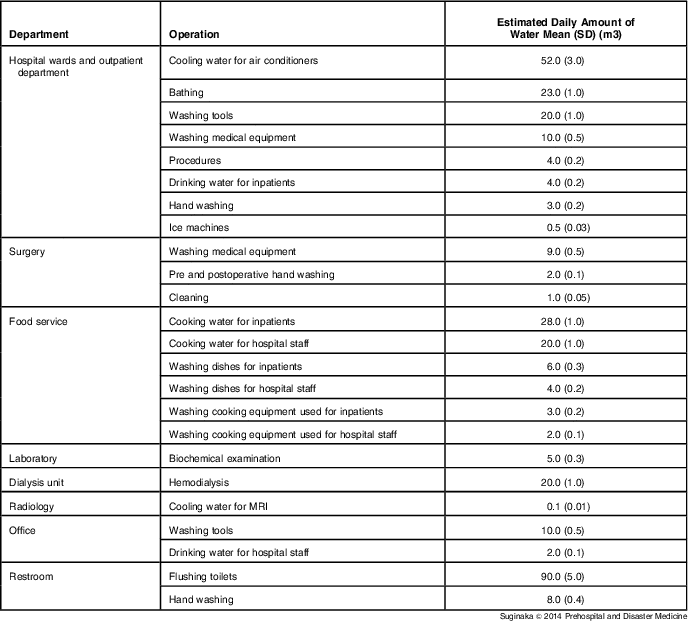
Abbreviation: MRI, magnetic resonance imaging.
All activities were classified by the operation priority rank according to the information generated by the BIA questionnaire. Five activities (21%), such as hemodialysis and drinking water for inpatients, were classified as “S;” seven activities (29%), such as biochemical examination and water for washing in the restroom, were classified as “A;” 12 activities (50%), such as cooking water for hospital staff and water for bathing, were classified as “B” (Table 3). The S- and A-rank operations accounted for one-half of all hospital activities requiring water (50%).
Operation Priority Rank
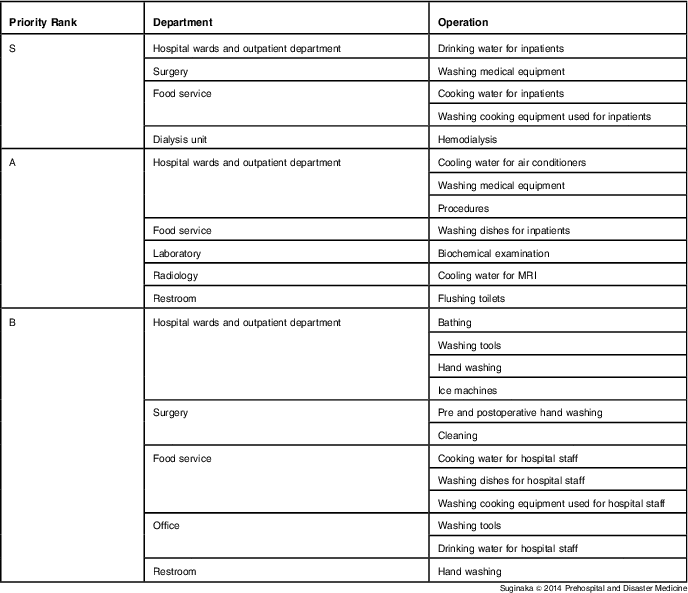
Abbreviation: MRI, magnetic resonance imaging.
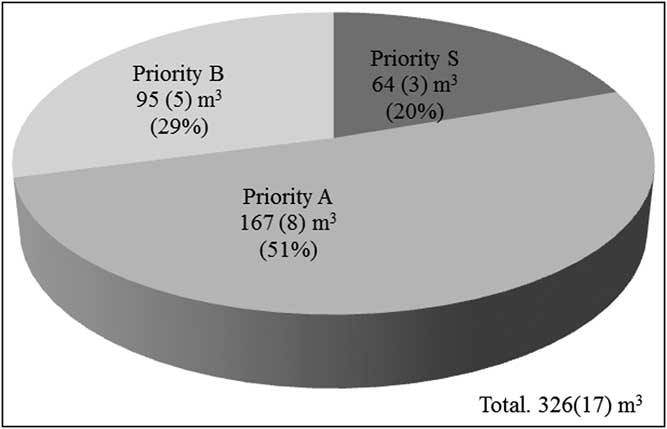
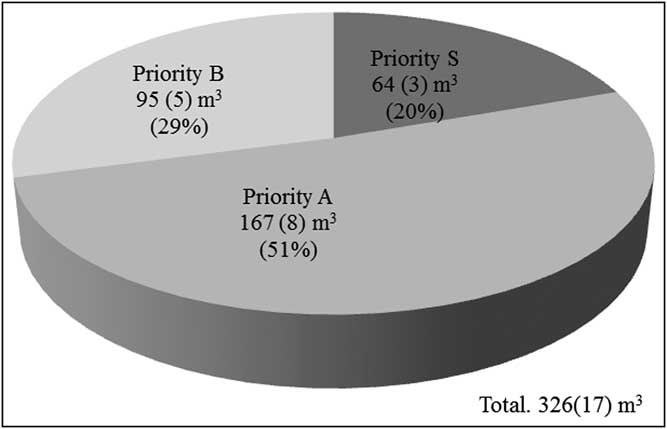
The total estimated water consumption in the hospital was approximately 326 (SD = 17) m3 per day. S-rank operations used about 64 (SD = 3) m3 (20%) of water per day. Approximately 167 (SD = 8) m3 of water (51%) was used for the A-rank operations, and 95 (SD = 5) m3 (29%) was used for the B-rank operations. The S- and A-rank operations accounted for 71% of the total consumption (Figure 2).
Estimated water consumption and ratio in each rank. According to the business impact analysis, the estimated water consumption in the hospital was approximately 326 (SD = 17) m3 per day. The estimated water consumption of S- A-, and B-rank operations was about 64 (SD = 3) m3 or 20%; 167 (SD = 8) m3 or 51%; and 95 (SD = 5) m3 or 29% per day, respectively.
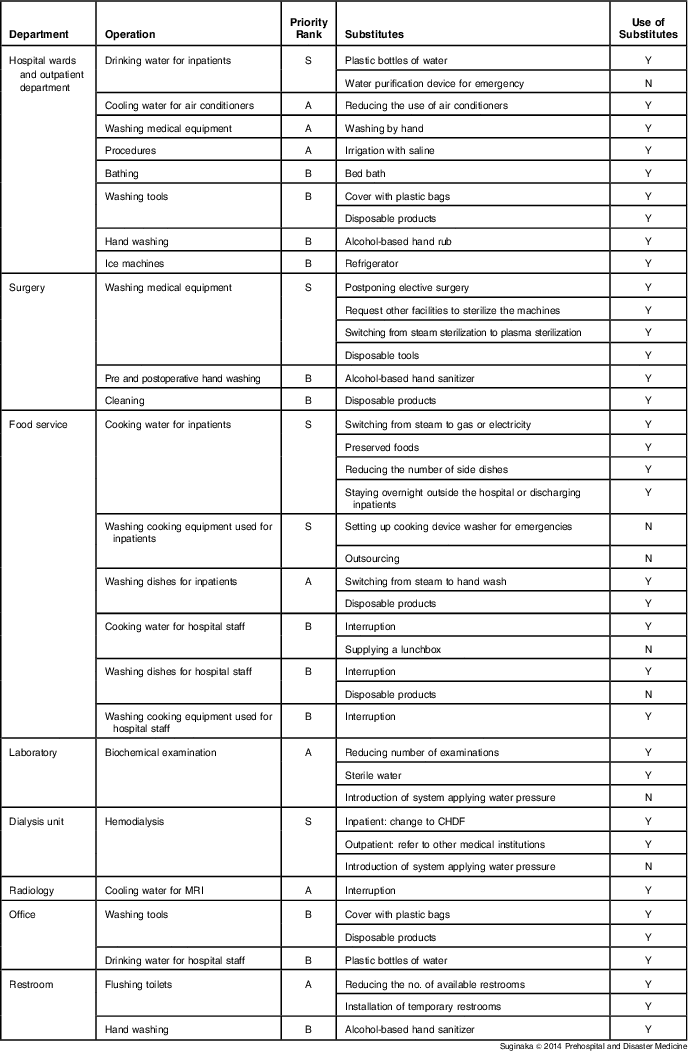
The substitutes for water in each operation included the use of gas or electricity instead of steam, preserved foods, and disposable tableware for inpatients (Table 4). During the suspension of the water supply, 86% of possible substitute methods were in practice. Of these substitutes, 81% were for S- and A-rank operations.
Water Substitutes
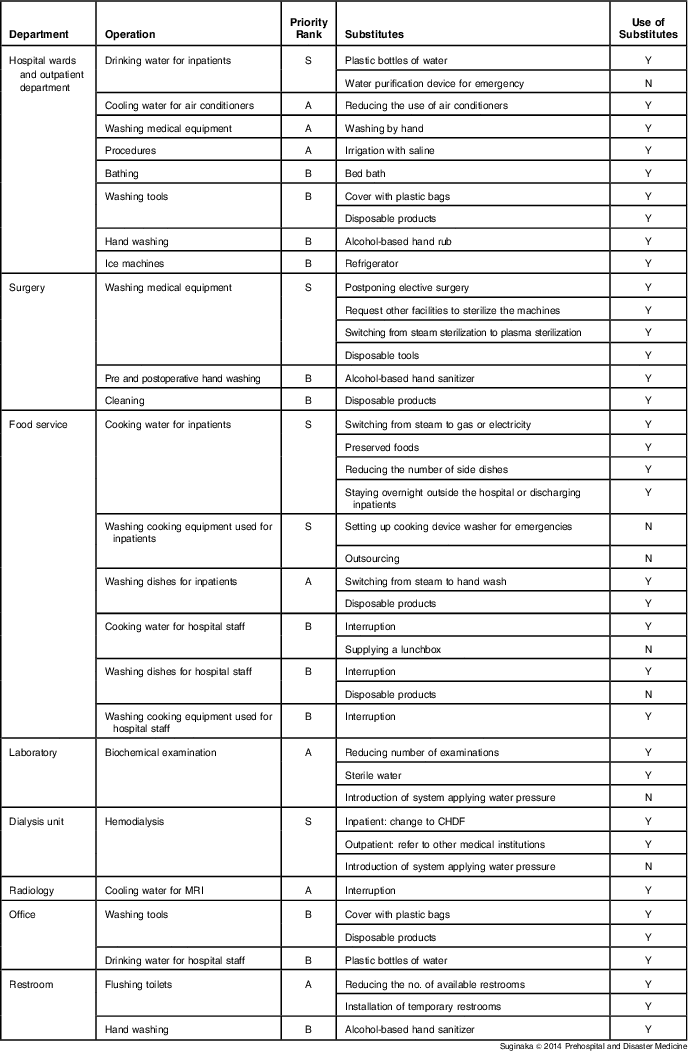
Abbreviation: CHDF, continuous hemodiafiltration; MRI, magnetic resonance imaging.
Recovery time objective (RTO), which is equivalent to the maximum tolerable period of disruption, was predicted to be four days. Recovery time objective is the goal for the restoration and recovery of function or resources in case of a disruption of operations based on the acceptable downtime. The total amount of usable water, supplied by the tanks at the hospital and water tankers from Urayasu city or other locations, over the four days of disruption was calculated. The total available water was 520 m3, consisting of 320 m3 from the storage tanks and 200 m3 from the water tankers, which carried 50 m3 per day to the hospital for four days.
Discussion
This study examined the management of water consumption in a hospital necessary to conserve and supply water to maintain important hospital functions during disruption of the water supply. In the hospital, the daily water consumption was approximately 500-600 m3 on weekdays, and the reservoir water tanks stored up to 320 m3. Therefore, water tanks would empty within one day if the external supply of water were suspended. Creating a BCP for prolonged disruption of the water supply had never been attempted until after the 4-day-long suspension of the water supply due to the Great East Japan Earthquake.
In this study, usage of water, priority of water consumption, estimated water consumption, and substitutes for water were examined in the BIA. As previously mentioned, the use of the BIA resulted in total estimated water consumption in the hospital of approximately 326 (SD = 17) m3 a day, much less than the actual water consumption on weekdays. For the first time, concrete data demonstrating that water consumption could be reduced intentionally and successfully, based on a BIA, were obtained. However, water conservation procedures that are too strict, for example restricting hand washing, may cause hygiene to deteriorate and result in poor outcomes, such as food poisoning and nosocomial infection. Thus, it is important to understand the priority of operations and minimum daily water requirements to enact appropriate countermeasures in a disaster.
The RTO was projected to be four days and the total amount of available water was 520 m3. Thus, 130 m3 per day could be used. However, because the estimated water consumption of S- and A-rank operations used about 231 m3 per day, it might be necessary to halt or substitute all B-rank operations and, furthermore, to secure approximately 101 m3 by saving and substituting in the S- and A-rank operations. The BIA of the Great East Japan Earthquake showed that the estimated daily amount of water for flushing toilets and cooling water for air conditioners accounted for most of the A-rank water consumption. Furthermore, 81% of substitutes were for S- and A-rank operations during the suspension of the water supply. Therefore, a water saving plan for hospitals during a disaster would help in saving enough water to maintain essential operations.
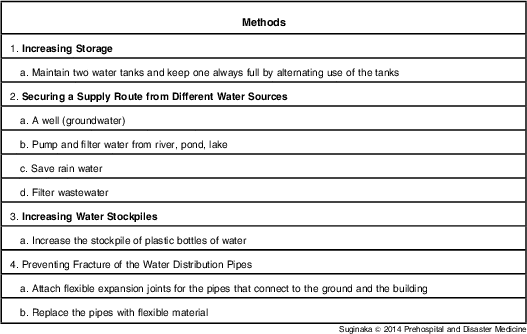
It is important to reduce the daily water use and increase water management abilities in hospitals. Methods of increasing the ability to better manage a disruption in the water supply include increasing storage, securing a supply route from different water sources, and increasing drinking water stockpiles (Table 5). For increasing storage, with a projected RTO of four days, at least two 720 m3 water tanks would be needed for this hospital because estimated daily water consumption of S- and A-rank operations was about 231 m3. In general, hospitals are obligated to store three days of drinking water for the inpatients. Thus, if the RTO is projected to be four days, additional 4 m3 water stockpiles are needed.
Methods for Increasing Hospital Water Supplies
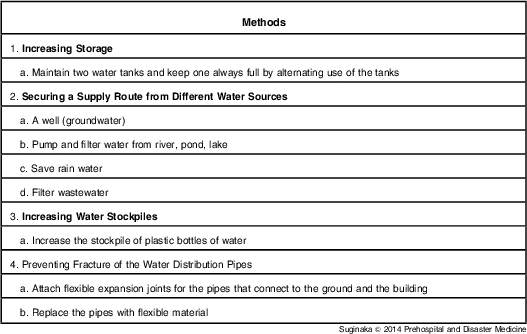
There may be nearby water resources, such as a river, pond, lake, or rainwater reservoir, that should be investigated. The estimated daily water supply of a river, pond, lake, or reservoir may be dependent on water purification systems. Some water purification devices in Japan can purify water at speeds from 0.5 m3 to 12 m3 per hour. In addition, approximately 78 m3 water per day may be harvested at this hospital based on the annual amount of rainfall in this city and region.
A well is another dependable emergency source of water; facility management should determine if any wells that could be used for emergency water supplies exist or could be drilled on the facility's grounds or nearby properties. If well water is available for use, its potability must be determined. Even if the groundwater is nonpotable, it can provide potential benefits to a health care facility in the event of water supply emergency, including for cooling and toilet flushing. In addition, hospitals might aim to prevent fractures in the water distribution pipes. It is crucial to identify and develop better systems for securing water in case of emergencies.
Finally, for hospital disaster management, strategic planning, such as the BCP and BIA, and physical preventative measures, such as ensuring that structures are earthquake proof, are essential.
Limitations
This study has some limitations that should be noted. First, some of the estimated water consumption is ambiguous. According to the Emergency Water Supply Planning Guide, a difference between a meter reading and the sum of estimates could be due to “unaccounted-for water,” which can result from water leakage, uncertain estimates, and missed activities that require water. It is necessary to calculate a more accurate estimate of daily water use by conducting a prospective examination. Second, this study was conducted in one hospital with approximately 650 beds in March 2011. Priorities of each operation may differ by the scale, location, and role of the hospital. In addition, seasonal variations in water consumption, especially during summer, should be considered. Therefore, generalization to other hospitals in Japan and elsewhere is cautioned. Finally, only a few staff members in each department were questioned, which could lead to selection bias.
Conclusion
This is the first study that identified and prioritized hospital operations necessary for the continuation of medical treatment in hospitals with suspended water supplies by applying a BIA. The total estimated water consumption in this hospital per day was estimated and evaluated by operational rank. The highest rank operations, those that are essential to patients’ lives (S-rank) used 20% of the estimated water per day, while the second and third ranks (A- and B-rank) used 51% and 29%, respectively. Understanding the priority of operations that use water and the minimum daily amount of water necessary is important to the continuation of medical treatment in a hospital in unexpected situations. It is valuable not only to reduce the daily water use, but also to explore potential sources of water and other methods of saving water. Establishing the BCP by a BIA in each medical department is essential for business continuity in a hospital following a major disaster.
Appendix