Implications
Tannin-rich extracts from different plants and rapeseed tannin monomers have different potential to reduce methane production by rumen microbes. The reduction in methane production may be associated with reduced fermentation and volatile fatty acid production; however, we found no indication for an alteration in the efficiency of microbial protein synthesis. The relevance of these results, which were obtained in vitro, can only be evaluated after the most promising products have been tested in animal studies.
Introduction
Tannins are a group of secondary plant compounds that are usually classified as hydrolyzable or condensed tannins. Hydrolyzable tannins are polymers of gallic and ellagic acid esters with a common core of glucose, whereas condensed tannins (proanthocyanidins) consist of polymers of flavan-3-ols linked by an interflavan carbon bond (Reed, Reference Reed1995). In contrast to hydrolyzable tannins, no cleavage of monomers of condensed tannins (e.g. (epi)catechin and (epi)gallocatechin, both flavan-3-ols) from the heterocyclic ring system occurs in the rumen (McSweeney et al., Reference McSweeney, Palmer, McNeill and Krause2001). It has been well established that tannins complex predominantly via hydrogen bonds with proteins from feed, rumen bacteria and extracellular secreted enzymes, resulting in reduced N availability in the rumen and increased protein and amino acid flow to the lower gut (Waghorn et al., Reference Waghorn, Ulyatt, John and Fisher1987; McSweeney et al., Reference McSweeney, Palmer, McNeill and Krause2001). Tannins are also thought to suppress internal parasites and methanogenesis in ruminants (Patra and Saxena, Reference Patra and Saxena2011; Jayanegara et al., Reference Jayanegara, Leiber and Kreuzer2012). Six to 12% of feed energy is lost as methane, which contributes to the greenhouse effect (Johnson and Johnson, Reference Johnson and Johnson1995). The inhibitory effects of tannins on rumen methanogenesis have been attributed to their direct effects on methanogenic archaea and protozoa, indirectly leading to a depression of fibre degradation in the rumen (Patra and Saxena, Reference Patra and Saxena2011).
In several studies, a reduction in methane production was accompanied with a reduction in digestibility (e.g. Puchala et al., Reference Puchala, Min, Goetsch and Sahlu2005; Animut et al., Reference Animut, Puchala, Goetsch, Patra, Sahlu, Varel and Wells2008). However, when tannin-containing plants are used, it is difficult to distinguish between the potential effects of the tannins and the other constituents of the supplemented plant. Studies using tannin monomers are scarce (Lowry and Kennedy, Reference Lowry and Kennedy1996), although numerous in vitro and in vivo studies have investigated the effects of tannin-rich extracts, among which chestnut (Castanea sativa), acacia (Acacia mearnsii) and quebracho (Schinopsis quebracho-colorado) extracts are prominent (Śliwiński et al., Reference Śliwiński, Soliva, Machmüller and Kreuzer2002; Carulla et al., Reference Carulla, Kreuzer, Machmüller and Hess2005; Beauchemin et al., Reference Beauchemin, McGinn, Martinez and McAllister2007). In addition to the reduced methane production observed in vivo (up to 29%, Grainger et al., Reference Grainger, Clarke, Auldist, Beauchemin, McGinn, Waghorn and Eckard2009), supplementation of these tannin-rich extracts often decrease faecal digestibility (e.g. CP, NDF, and ADF) and tend to decrease total volatile fatty acid (VFA) concentration in the rumen, indicating their effects on the microbial community in the rumen.
The protein supply in the duodenum of ruminants is highly related to microbial protein synthesis in the rumen. Carulla et al. (Reference Carulla, Kreuzer, Machmüller and Hess2005) observed reduced urinary allantoin excretion in sheep fed diets containing acacia extract, which indicated that microbial protein synthesis was reduced. In contrast, Makkar et al. (Reference Makkar, Blummel and Becker1995) reported that microbial protein synthesis was enhanced in the presence of tannins in vitro. In their study, 15N incorporation into microbes was significantly increased by tannins and was negatively related to VFA production, indicating that the energy derived from nutrient fermentation was shifted from VFA production towards microbial protein synthesis. As no consistent effects of tannins on microbial protein synthesis have been described (Patra and Saxena, Reference Patra and Saxena2011), additional studies examining the potential conflicting effects of tannin feeding on methane production and microbial protein synthesis are needed.
Our first objective was an extensive screening of tannin-rich extracts and tannin monomers using the Hohenheim gas test (HGT; Menke et al., Reference Menke, Raab, Salewski, Steingass, Fritz and Schneider1979) to identify a specific reduction in methane production that is achievable without a reduction in total gas production (GP) as an indicator of overall fermentation. The second objective was to study the effect on methane production together with nutrient degradation and different microbial fractions using a rumen simulation technique (Rusitec; Czerkawski and Breckenridge, Reference Czerkawski and Breckenridge1977) with the tannins that were most promising in the HGT screening.
Material and methods
In Experiment 1, the HGT was used in four consecutive trials to screen 14 tannin-rich extracts and tannin monomers for methane reduction when added to grass silage. In Experiment 2, five tannin-rich extracts were chosen for further investigation using a Rusitec to study the effects on nutrient degradation and microbial protein synthesis. The grass silage used in both experiments was ground to pass through a 1-mm screen, and its chemical composition was as follows: organic matter (OM), 922; CP, 129; crude fibre (CF), 264; NDF, 444; and ADF, 283 g/kg dry matter (DM). Rumen content was obtained before the morning feeding from two rumen fistulated, non-lactating cows (Holstein-Friesian). The same amount from both cows was mixed and collected into pre-warmed thermos flasks, filtered and flushed with carbon dioxide until incubation. The cows had ad libitum access to hay and received 2 kg/day of a mixed concentrate. They had free access to water and pasture during the daytime.
Tannin-rich extracts and tannin monomers
Ten tannin-rich extracts were used: chestnut (Castanea sativa, total tannin (TT) concentration according to the manufacturer ⩾76%), mimosa (Acacia negra, TT ⩾ 72%), myrabolan (Terminalia chebula, TT ⩾ 70%), quebracho (Schinopsis balansae, TT ⩾ 76%), sumach (Rhus coriaria, TT ⩾ 62%), tara (Caesalpinia spinosa, TT ⩾ 61%), valonea (Quercus valonea, TT ⩾ 67%; all from Baeck GmbH & Co. KG, Norderstedt, Germany), oak (Oaktan FU; Quercus robur, TT ⩾ 55%), cocoa (OmniCoa 55; Theobroma cacao, polyphenol (PP) concentration according to the manufacturer ⩾55%) and grape seed (OmniVin 20R; Vitis vinifera, PP ⩾ 95%; all from S.A. Ajinomoto OmniChem N.V., Louvain-la-Neuve, Belgium). These tannin-rich extracts were available in amounts that allowed for animal studies at a later stage, if they would be selected. Four rapeseed tannin monomers were also used, pelargonidin (pelargonidin chloride Rotichrom, Chemical Abstracts Service Number (CAS): 134-04-3), catechin ((+)-catechin Rotichrom, CAS: 154-23-4), cyanidin (cyanidin chloride Rotichrom, CAS: 528-58-5) and sinapinic acid (sinapinic acid ⩾97%, CAS: 530-59-6) (Carl Roth GmbH, Karlsruhe, Germany). According to Naczk et al. (Reference Naczk, Amarowicz, Sullivan and Shahidi1998), these monomers are the basic units of condensed tannins of rapeseed.
Experiment 1
The HGT was performed according to Menke et al. (Reference Menke, Raab, Salewski, Steingass, Fritz and Schneider1979) and with modifications according to the official method (method 25.1, Verband Deutscher Landwirtschaftlicher Untersuchungs- und Forschungsanstalten (VDLUFA, 2006). Approximately, 120 mg of grass silage was weighed and placed in 100-ml glass syringes. The tannin-rich extracts were administered in doses of 6 and 12 mg/syringe in the first trial. The supplementation level of 5% in DM represents the native tannin concentration in Lotus pedunculatus (Chiquette et al., Reference Chiquette, Cheng, Rode and Milligan1989). We also used twice this level because it was assumed that the different tannin-rich extracts consist of different tannin phenols. The concentrations of rapeseed monomers that were initially used were 0.3 and 0.7 mg/syringe. This was based on the concentration of proanthocyanidins in crude tannin-rich extracts of rapeseed hulls (5% according to Naczk et al., Reference Naczk, Amarowicz, Sullivan and Shahidi1998) and the initial dosage of the tannin-rich extracts (6 mg). Tannin substances were diluted in double distilled water, and 500 μl of these solutions or 500 μl of double distilled water (control) were added to pre-warmed syringes before incubation. Syringes were inoculated with 30 ml of a rumen fluid–buffer mix (10 ml rumen fluid, 20 ml buffer) at 39°C for 24 h. In total, four consecutive trials comprising four runs each were conducted. Each treatment was incubated in duplicate within one of the four runs (days) using two incubators (WTC Binder, Tuttlingen, Germany; Memmert, Schwabach, Germany). Therefore, there were eight syringe replicates per treatment and trial. After 24 h, GP was measured, the inoculum was decanted and the methane concentration in the produced gas was analysed. GP and methane production were corrected using blanks (incubation of rumen fluid–buffer mix without grass silage) and standardized to 120 mg DM of grass silage. In each trial, the GP and methane production of treatments that included tannins were compared with the respective control treatment. On the basis of the results obtained with the previously mentioned initial doses, two to four subsequent trials were carried out for each tannin to identify the optimum dose. This optimum was defined by the maximum reduction in methane production without a significant effect on GP. Tannin products that reduced both methane production and GP, increased GP, or were not able to reduce methane production, were no longer considered. The maximum tannin-rich extract dose was set at 32 mg/syringe (i.e. 27% on substrate basis).
Experiment 2
Five of the 10 tannin-rich extracts from Experiment 1 were used (chestnut, grape seed, myrabolan, sumach and valonea) in the Rusitec. In two consecutive runs, six treatments (the five tannin-rich extracts and a tannin-free control) were allocated to 24 vessels (12 in each run) with four replicates per treatment. Two vessels were randomly assigned to each treatment in both runs. The technical details and general incubation procedure were previously described in detail by Boguhn et al. (Reference Boguhn, Kluth and Rodehutscord2006). In brief, each vessel contained two nylon bags (100 μm pore size), containing 15 g of grass silage each. The tannin-rich extract was weighed on top of the grass silage. A supplementation level of 1.5 g was chosen for all tannin-rich extracts as the objective of Experiment 2 was not to study dose–response effects but to understand better the effects on nutrient degradation and microbial protein synthesis. Each day, one nylon bag was introduced into the vessel and removed 48 h later, so that two bags were placed in a vessel at any time. At the start of each run, vessels were inoculated with 400 ml of artificial saliva (McDougall, Reference McDougall1948), 400 ml of strained rumen fluid and 60 g of solid rumen content, originating and mixed in equal parts from the donor animals as mentioned before. The bag containing the solid rumen content was retrieved after 24 h. The artificial saliva (572 ml/day, s.d. = 88.9) contained 0.0378 g 15N-enriched NH4Cl/l (104 mg 15N/g N analysed; Chemotrade Chemiehandelsgesellschaft mbH, Leipzig, Germany) and was continuously infused. After a 7-day adaptation period, enrichment plateaus of 15N in the microbes were reached (Boguhn et al., Reference Boguhn, Kluth and Rodehutscord2006), and samples were collected at feeding times for 7 days. The pH was measured daily before the nylon bags with feed were changed. Feed residue from the bags was collected from day 8 to day 13 and pooled per vessel. Samples (50 ml/day) were taken from well-mixed effluent to analyse the ammonia-N, 15N and VFA concentrations. From days 8 to 13, a suspension from the vessel (25 ml/day) was taken to separate the fraction of liquid-associated microbes (LAM). On day 14, solid-associated microbes (SAM) were separated from feed residues according to Ranilla and Carro (Reference Ranilla and Carro2003), using a methylcellulose solution (1 g/l plus 9 g NaCl/l).
For VFA, ammonia-N and 15N analysis, the liquid effluent was centrifuged for 15 min at 27 000 × g at 4°C, and the supernatant was frozen at −20°C until analysis. The LAM and SAM fractions were separated from the suspensions by differential centrifugation (Boguhn et al., Reference Boguhn, Kluth and Rodehutscord2006). The obtained LAM and SAM fractions were immediately frozen and stored at −20°C until analysis or freeze-dried for 15N analysis.
The Rusitec was modified to be air-tight and allow for quantitative collection of fermentation gas without dilution by the air originally contained in the flask. Tubes were made from fluoroethylen propylen (Zinsstag, Stuttgart, Germany) and connectors from polypropylene (VWR, Darmstadt, Germany) (Figure 1). A glass cylinder (b, 34 mm in diameter and 230 mm long) was interconnected between each vessel (a) and the corresponding effluent flask (e). At the bottom, the glass cylinder was equipped with an inlet for both gas and effluent from the vessel and an outlet that led to an effluent-collecting flask. At the top of the glass cylinder, the accumulated gas was directed into a gas-tight plastic bag (d, 10 L Plastigas; Linde AG, Munich, Germany). The glass cylinder was placed in a water bath (4°C) and filled at the start of each run with a mix of artificial saliva and rumen fluid as previously mentioned. Glass valves between the vessel (c1), glass cylinder (c2) and outlet to the gas bag (c3) were closed before the daily replacement of nylon bags, gas bags and effluent flasks, and opened again thereafter. The GP was measured as the volume contained in the bags using a drum-type gas meter (TG3; Dr.-Ing. Ritter Apparatebau GmbH & Co. KG, Bochum, Germany). Samples of the gas (100 ml) were collected in gas sampling tubes with septa according to DIN-12-373 (Hofmann, Staudt, Germany). This tube was interposed between the gas bags and the drum-type gas meter, flushed thoroughly with sample and valves closed after filling.
Schematic diagram of a vessel (a) of the Rusitec extended by a glass cylinder (b) and valves (c1 to c3) to ensure gas separation from the effluent and collection in a gas-tight plastic bag (d) without dilution from the dead volume of the flask-collecting effluent (e). The glass cylinder (b) was filled with a rumen fluid–buffer mix at the start of incubation. The glass cylinder and the effluent flask were placed in an ice-cold water bath (not shown).

Analytical procedures and calculations
In Experiment 1, the methane concentration in total gas was analysed using an infrared methane analyser (Pronova Analysentechnik GmbH & Co. KG, Berlin, Germany) calibrated using a reference gas (18.0 vol% CH4; Air Liquide Deutschland GmbH, Düsseldorf, Germany). Syringes were directly connected to the analyser and ∼20 ml of gas was injected for about 20 s until the displayed methane concentration was constant. In Experiment 2, carbon dioxide and methane were analysed by gas chromatography (GC 14 A; Shimadzu Deutschland GmbH, Duisburg, Germany) equipped with an on-column injector and a thermal conductivity detector. A HayeSep DB, 100 to 120 mesh, 6.0 m, 1/8 in. (Alltech, Düsseldorf, Germany) was used as stationary phase, carrier gas was Helium 5.0 with a flow rate of 30 ml/min. Injector and detector temperatures were at 100°C and 120°C, respectively, oven temperature following an initial period of 40°C for 9.5 min was increased to 120°C at 40°C/min and kept finally at 120°C for 10 min as described by Wischer et al. (Reference Wischer, Boguhn, Steingaß, Schollenberger, Hartung and Rodehutscord2013). Samples were drawn out of the gas collection tubes through the septa using a gas-tight GC syringe (Hamilton, Bonaduz, Switzerland). The injection volume was 50 μl and the GC was calibrated using a reference gas (5.16 vol% CH4; 74.8 vol% CO2, Air Liquide Deutschland GmbH).
The feed and feed residue were analysed for crude nutrients according to official methods (VDLUFA, 2006): DM (method 3.1), crude ash (method 8.1), CP (method 4.1.1), ether extract (EE, extraction with petroleum ether after treatment with HCl, method 5.1.1b) and CF (method, 6.1.1). Samples were also analysed for NDF (Fibretherm, Fa. C. Gerhardt GmbH & Co. KG, Königswinter, Germany), assayed with heat-stable amylase and ADF, both without residual ash (methods 6.5.1 and 6.5.2, VDLUFA, 2006). All chemical analyses were run in duplicate and were averaged before further use if deviation between duplicates was below the level specified for each analysis. Otherwise analysis was repeated. Degradation was calculated as the difference between the input and output of each vessel in relation to input and expressed as a percentage. The amount of OM and CP in feed residue was corrected for the contribution by SAM (Boguhn et al., Reference Boguhn, Kluth and Rodehutscord2006).
Grass silage, residue from the bags, freeze-dried particle-free liquid effluent, LAM, SAM and ammonium chloride were analysed for 15N and, in the case of SAM, for total N, using an elemental analyser (EA 1108; Carlo Erba Instruments, Biberach, Germany) combined with an isotope mass spectrometer (MS Finnigan MAT; Thermoquest Italia S.p.A., Milan, Italy). Microbial protein (microbial N multiplied by 6.25) from LAM was calculated as the difference between the input and output of 15N divided by the 15N concentration in LAM. Microbial protein originating from SAM was calculated according to Hildebrand et al. (Reference Hildebrand, Boguhn and Rodehutscord2011). The daily amount of microbial protein originating from LAM and SAM together was used to calculate the efficiency of microbial protein synthesis (EMPS, in g/kg of degraded OM, dOM). The analysis of VFA was performed by vacuum distillation according to the method by Zijlstra et al. (Reference Zijlstra, Beukema, Wolthers, Byrne, Groen and Ankert1977), and modifications and GC measurements were as described by Wischer et al. (Reference Wischer, Boguhn, Steingaß, Schollenberger, Hartung and Rodehutscord2013).
Ammonia-N was measured by Kjeldahl steam distillation using phosphate buffer (90 g Na2HPO4 12 H2O/L, adjusted to pH 11.0 with sodium hydroxide) (Wischer et al., Reference Wischer, Boguhn, Steingaß, Schollenberger, Hartung and Rodehutscord2013). The tannin-rich extracts used in Experiment 2 were analysed for total phenol concentration, non-tannin phenol concentration and extractable condensed tannins according to Makkar (Reference Makkar2003b), Jayanegara et al. (Reference Jayanegara, Wina, Soliva, Marquardt, Kreuzer and Leiber2011) and Porter et al. (Reference Porter, Hrstich and Chan1986) modified as follows. For extraction, a 10-ml mixture of acetone/water (70/30 v/v) was added to 100 mg of sample and sonicated three times for 15 min on ice with 5 min breaks. After centrifugation at 3000 × g for 15 min at 4°C, the supernatants were analysed. To remove the polyvinylpolypyrrolidone used for the separation of tannin phenols from total phenols, the sample was centrifuged for 15 min, the supernatant was decanted and the sample was centrifuged again for 10 min. Extracts were diluted between 1 : 667 and 1 : 333 for total phenols and between 1 : 40 and 1 : 25 for non-tannin phenols, and 1 ml of diluted extract was mixed with Folin–Ciocalteu's phenol reagent (500 μl, diluted 1 : 1 v/v with distilled water) and sodium carbonate solution (2.5 ml, 88.5 g Na2CO3·10H2O in 500 ml distilled water). After 60 min, the absorbance of total phenols and non-tannin phenols was recorded at 725 nm using a UV-VIS spectrophotometer. Tannic acid was used as calibrant, and values were expressed as tannic acid equivalents. Condensed tannins were expressed as leucocyanidin equivalents. All analyses were run in duplicate. Chemicals were purchased from VWR International GmbH, Darmstadt, Germany.
Statistical analyses
The MIXED procedure in the software package SAS (version 9.2, SAS Institute, Cary, NC, USA) was used for statistical analysis and the level of significance was set at P < 0.05. For both the experiments, the model was as follows: yijk = μ + αi + βj + eijk, where the model included tannin i (αi) as a fixed effect, the incubation run j (βj) as a random effect and eijk as a residual effect. Significant differences between treatments were compared using the t-test. In Experiment 1, each trial was analysed separately.
Results
Experiment 1
In trials 1 to 4, the GP of the control treatment was 30.1 ± 0.4, 26.7 ± 0.5, 25.0 ± 0.4 and 26.7 ± 0.2 ml (LSM ± s.e.), and the respective methane production was 5.0 ± 0.1, 4.3 ± 0.1, 4.1 ± 0.1 and 4.0 ± 0.1 ml. Pelargonidin and cyanidin supplementation did not reduce methane production; however, catechin and sinapinic acid at 0.7 mg/syringe reduced methane production by 13% and 10%, respectively, as compared with the control. However, these effects could not be confirmed for both monomers in a second trial (Figure 2).
Effect of different doses of rapeseed tannin monomers on total gas production (white bars) and methane production (black bars) relative to the control (set to 100; s.e. accordingly) using the Hohenheim gas test. The asterisks indicate treatments that differ significantly from the control treatment within the respective trial.
The effects of the tannin-rich extracts are presented in Figure 3. Tara extract significantly increased GP. Because the focus of this experiment was a reduction in methane production and an unchanged GP, this extract was not further considered. The individual adaptations in the doses of the remaining tannin-rich extracts resulted in maximum methane production reductions from 8% to 28% without significant effects on GP. The greatest reductions in methane production at an unchanged GP were detected with grape seed (28% relative to the control at 24 mg/syringe), myrabolan (22% at 32 mg), valonea (17% at 6 mg), oak (15% at 6 mg), chestnut (14% at 6 mg), quebracho (13% at 6 mg), sumach (11% at 12 mg), mimosa (10% at 6 mg) and cocoa extract (8% at 12 mg). On the basis of these results, chestnut, grape seed, myrabolan, sumach and valonea extracts were selected for further investigation in Experiment 2. The decision to use sumach in Experiment 2 was inconsistent and the result of a misinterpretation of preliminary results for this extract from Experiment 1.
Effect of different doses of tannin-rich extracts on total gas production (white bars) and methane production (black bars) relative to the control (set to 100; s.e. accordingly) using the Hohenheim gas test. The asterisks indicate treatments that differ significantly from the control within the respective trial.
Experiment 2
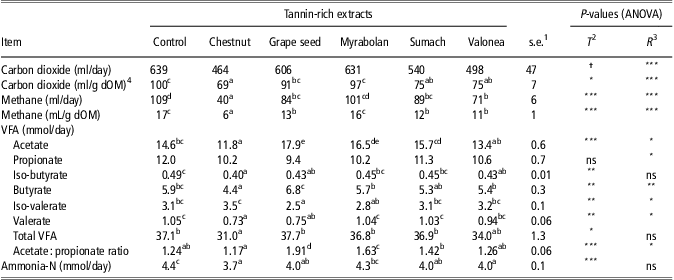
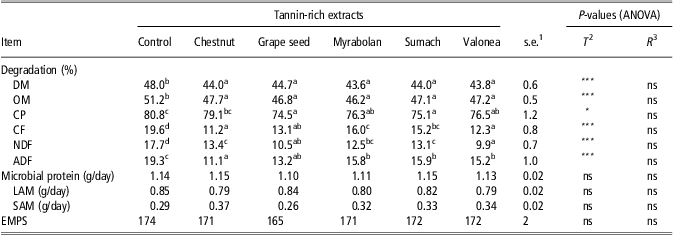
The concentrations of total phenols and tannin phenols (% in DM) for chestnut, grape seed, myrabolan, sumach and valonea were 74 and 54, 122 and 99, 60 and 55, 36 and 33, and 72 and 63, respectively. Grape seed also contained condensed tannins (14% in DM). No condensed tannins were detected in the other tannin-rich extracts. The average pH of the vessel fluid was 6.81, and was affected by run (P < 0.001) but not by tannins (P = 0.48; data not shown). Although carbon dioxide production was not influenced by tannin supplementation (P = 0.08), the variation between treatments was high and ranged from 464 to 639 ml/day (Table 1). Chestnut caused the greatest decline in methane production (63%), followed by valonea (35%), grape seed (23%), sumach (18%) and myrabolan (7%; not significantly different from the control). Expressed per unit dOM, the production of both carbon dioxide and methane was affected by tannin supplementation (P = 0.02 and P < 0.001, respectively). Tannin supplementation significantly affected VFA production, except propionate, which was on average 10.6 mmol/day across all treatments. Chestnut extract significantly reduced acetate production by 19%, whereas grape seed and myrabolan significantly increased acetate production by 22% and 13%, respectively, compared with the control. The average total VFA production was 35.6 mmol/day and was only significantly reduced by chestnut supplementation. The ratio of acetate to propionate ranged from 1.17 (chestnut) to 1.91 (grape seed) compared with 1.24 of the control. The production of ammonia-N was significantly reduced by the addition of all tannins, except myrabolan. The addition of chestnut led to the greatest reduction in ammonia-N production. Supplementation with tannin-rich extracts decreased the degradation of all chemical fractions studied (P < 0.05, Table 2). Incubation of grass silage alone resulted in DM and OM degradation of 48.0% and 51.2%, respectively, whereas in treatments supplemented with tannin-rich extracts, the degradation of DM and OM ranged from 43.6% to 44.7% and from 46.2% to 47.7%, respectively. Significant differences in DM and OM degradation were not detected between the different tannin treatments. CP degradation was reduced by supplementation with grape seed, myrabolan, sumach and valonea, whereas CP degradation in the presence of chestnut extract did not differ from that of the control. In the control treatment, degradation of CF, NDF and ADF was 19.6%, 17.7% and 19.3%, respectively, and was significantly reduced in the presence of tannin-rich extracts. Microbial protein synthesis ranged from 1.10 to 1.15 g/day and was not affected by tannin supplementation (P = 0.18). The microbial protein averages in the LAM and SAM fractions were 0.82 and 0.32 g/day, respectively, and were not significantly influenced by tannin treatment. The EMPS ranged between 165 and 174 g/kg dOM and did not differ significantly between treatments (P = 0.13).
Effect of tannin-rich extracts on carbon dioxide, methane, volatile fatty acid (VFA) and ammonia-N production using the Rusitec (Experiment 2)
1s.e. = standard error of the mean (pooled for all treatments).
2Fixed effect, T = tannin.
3Random effect, R = run.
4Degraded organic matter.
a,b,c,d,eMeans with different superscripts within a row differ significantly according to the t-test (P < 0.05).
*P < 0.05; **P < 0.01; ***P < 0.001; † = tendency (P < 0.1); ns = non-significant (P > 0.1).
Effect of tannin-rich extracts on the degradation of chemical fractions and microbial protein synthesis using the Rusitec (Experiment 2)
DM = dry matter; OM = organic matter; CF = crude fibre; LAM = liquid-associated microbes; SAM = solid-associated microbes; EMPS = Efficiency of microbial protein synthesis (g microbial protein/kg degraded organic matter).
1s.e. = standard error of the mean (pooled for all treatments).
2Fixed effect, T = tannin.
3Random effect, R = run.
a,b,c,dMeans with different superscripts within a row differ significantly according to the t-test (P < 0.05).
*P < 0.05; **P < 0.01; ***P < 0.001; † = tendency (P < 0.1); ns = non-significant (P < 0.1).
Discussion
One of our objectives was to screen different tannin substances commonly used in the food and leather industries along with rapeseed tannin monomers to determine their potential to reduce methane production without changing GP. Supplementation of grass silage with catechin, pelargonidin, cyanidin and sinapinic acid did not inhibit GP (Figure 1). In contrast, Lowry and Kennedy (Reference Lowry and Kennedy1996) reported that catechin supplementation reduced in vitro GP. These authors incubated 25 mg of catechin together with 75 mg of a fibrous substrate. This discrepancy may have been caused by the different doses of tannin monomers used in both studies. The highest dose of catechin investigated in the present study was 0.8 mg/syringe (corresponding to 6.66 mg/g of feed). However, the reduction in methane production by catechin and sinapinic acid in trial 1 of Experiment 1 could not be confirmed in trial 2 (Figure 1). It is possible that the difference between these trials was caused by variation in the composition of the rumen liquor sampled in each trial. The latter may affect the fermentation characteristics measured with in vitro techniques such as the HGT and the Rusitec (Rymer et al., Reference Rymer, Huntington, Williams and Givens2005). The anti-nutritive effects of tannins are associated with their ability to build complexes with dietary proteins, polymers (cellulose, hemicellulose and pectin) and minerals (McSweeney et al., Reference McSweeney, Palmer, McNeill and Krause2001), and their concentrations in the rumen liquor may have differed. It is not clear to what extent the monomers of condensed tannins have these complexion properties. It remains open why cyanidin and pelargonidin were not able to reduce methane production as the degradation of condensed tannins has not been demonstrated in the rumen so far (McSweeney et al., Reference McSweeney, Palmer, McNeill and Krause2001).
All tannin-rich extracts, except tara extract, had inhibitory effects on methane production ranging from 8% to 28% but did not alter GP. The concentration of total phenols, tannin phenols and condensed tannins was analysed in the tannin-rich extracts used in Experiment 2 (chestnut, grape seed, myrabolan, sumach and valonea). They were characterized by a concentration of tannin phenols, ranging from 33% to 98% of DM. Whereas grape seed contained 14% extractable condensed tannins, chestnut, myrabolan, sumach and valonea only contained hydrolysable tannins. For grape seed extract, a total phenol concentration of 122% (of DM) was calculated. We assume that this extract contained proteins bound to phenols, which may have interfered with the analysis (Salminen and Karonen, Reference Salminen and Karonen2011). The quantification basis of the Folin–Ciocalteu method is the oxidizability of the phenolic compounds determined (Medina, Reference Medina2011), which is dependent on molecular structure. Thus, using tannic acid calibrant, as done in the present paper, may lead to other results for total phenol content than using gallic acid, which is often used as reference in the literature. This might be an explanation for differences in tannin contents between own results and specifications given by the suppliers.
When the methane production observed in Experiment 1 is correlated with the amount of tannin phenols supplemented, it becomes clear that valonea and chestnut extract were more efficient in reducing methane production than sumach, myrabolan and grape seed. This was confirmed by the results of Experiment 2, in which chestnut and valonea caused the highest reductions in methane production (63% and 35%, respectively) compared with the control, followed by grape seed and sumach. Myrabolan supplementation did not significantly reduce methane production. The production of carbon dioxide tended to be affected by tannin treatment (P = 0.08), which indicates that higher dosages, for example, of chestnut extract would probably decrease other fermentation characteristics besides methane production, such as degradation of the fibre fraction. It is unknown whether the dose for myrabolan used in Experiment 2 was too low compared with the doses used in Experiment 1. However, the tannin phenol concentration was more than 1.5-fold higher than that of sumach extract, which significantly reduced methane production by 18% in Experiment 2. In contrast to Experiment 1, in Experiment 2 the selected tannin-rich extracts were supplemented at equal doses of 1.5 to 15 g of grass silage, resulting in a trend towards reduced carbon dioxide production (P = 0.08). The tannin-rich extracts had different effects on acetate production. Whereas chestnut extract supplementation led to lower acetate production than the control, the inclusion of valonea, sumach, grape seed and myrabolan extract did not change or enhance acetate production. Lower acetate production indicates depression of in vitro fermentation, which is in line with the lower ADF and NDF degradation in tannin-containing treatments. However, the equal or enhanced acetate production in the presence of valonea, sumach, grape seed and myrabolan extract, which was not reflected in equal or enhanced degradation of fibre fractions, may be because of other fermentable substances in the tannin-rich extracts that contributed to acetate production or the accumulation of acetate originating from the degradation of hydrolyzable tannins (McSweeney et al., Reference McSweeney, Palmer, McNeill and Krause2001). Propionate production was not affected by tannin inclusion. In contrast to other substances such as monensin, saponins and essential oils, the effects of tannins on methanogenesis are often not associated with an increased propionate production (Stanier and Davies, Reference Stanier and Davies1981; Patra, Reference Patra2010). Regarding the numerically lower production of carbon dioxide and the significantly reduced total VFA production observed for chestnut extract, it is possible that the chestnut extract dose was already too high for a selective inhibition of methane production; therefore, in vitro fermentation was adversely affected.
Degradation of fibre fractions was significantly reduced in all tannin treatments; hence, DM and OM degradation was also affected. The negative effects on degradation of fibre fractions suggest that fibre-degrading microbes were inhibited by tannin-rich extracts. As previously mentioned, this probably interfered with the degradation of hydrolyzable tannins, resulting in acetate as the end product (McSweeney et al., Reference McSweeney, Palmer, McNeill and Krause2001). Therefore, it is possible that the reduction in methane production was partly because of a decline in the degradation of fibre fractions, which supports the hypothesis that decreased hydrogen availability leads to reduced methane production (Bodas et al., Reference Bodas, López, Fernández, García-González, Rodríguez, Wallace and González2008). However, a meta-analysis by Patra (Reference Patra2010) indicated only a weak relationship between decreased methane production due to tannin supplementation and decrease in OM digestibility (P = 0.08, R 2 = 0.19) or NDF digestibility (P = 0.12, R 2 = 0.23).
Varying amounts of OM introduced into the vessels may also contribute to the differences. Compared with the control (15 g grass silage), tannin treatments received 1.5 g of tannin-rich extract additionally. For some of the investigated tannin rich extracts, for example, sumach, chestnut or myrabolan, the non-phenol fraction can be high. This fraction similarly contains OM, which can be fermented or affect fermentation (Medina, Reference Medina2011).
It is well known that tannins complex with proteins, thereby reducing their degradation in the rumen, which seems not to be related to their potential to reduce methane (Patra, Reference Patra2010). In the present study, the degradation of CP was reduced for all tannin treatments, except chestnut. This was in agreement with the lower ammonia-N accumulation in effluent observed for grape seed, sumach and valonea. This also indicates that tannins form complexes with feed and microbial proteins and render them undegradable. Moreover, it has been suggested that these tannin-rich extracts reduce the growth of proteolytic bacteria (Haslam, Reference Haslam1981). Jones et al. (Reference Jones, McAllister, Muir and Cheng1994) previously reported that condensed tannins (Onobrychis viciifolia) inhibited the growth and protease activity of Butyrivibrio fibrisolvens and Streptococcus bovis, and to a lesser extent, Prevotella ruminicola and Ruminobacter amylophilus.
In the present study, microbial protein synthesis was not significantly affected by tannin inclusion (P = 0.18), which is probably owing to the fact that the reduced ammonia-N concentration was still sufficient for microbial protein synthesis (>5 mg ammonia-N/100 ml rumen fluid, Roffler and Satter, Reference Roffler and Satter1975). The microbial protein synthesis originating from SAM tended to be increased by tannin treatment (P = 0.07), whereas the microbial protein synthesis originating from LAM was not affected by tannin inclusion (P = 0.21). Makkar (Reference Makkar2003a) found a 16% decline in total VFA production upon chestnut extract addition, but the EMPS remained unaffected. Our results contradict his hypothesis that tannins increase EMPS by channelling a higher proportion of available nutrients towards synthesis of microbial protein. The discrepancies between his and the present findings perhaps were related to the different in vitro systems used (HGT v. Rusitec). In future investigations, a reduction in the grass silage to compensate for the inclusion of tannin-rich extracts, or the use of more purified tannin-rich extracts may allow for better clarification of the effects on EMPS.
Conclusions
Nine of the 10 tannin-rich extracts tested and two of the rapeseed tannin monomers reduced methane production without inhibiting GP. The Rusitec results showed that chestnut and valonea extracts have great potential to reduce methane production in vitro. We hypothesized that similar effects may be found in vivo, and we will test this hypothesis in a long-term respiration study using sheep.
Acknowledgements
Support for this study from the H. Wilhelm Schaumann Stiftung (Hamburg, Germany) through a doctoral scholarship for G. Wischer is gratefully acknowledged. The authors thank Helga Terry and Sibylle Rupp for their excellent technical support in gas and tannin analyses.