
1. Introduction
One of the most salient features of turbulent flows is enhanced rates of energy dissipation ( $\epsilon$) and mixing. Turbulence rapidly produces fine-scale variations in the velocity field. The dynamics of this process has been of enduring interest for understanding and modelling turbulent flows across a wide range of applications. The resulting broadband range of length and time scales, evolving under intrinsically nonlinear dynamics, lies at the centre of what makes turbulent flows challenging to analyse, model and predict.
The kinetic energy cascade is the predominant concept for illuminating the production of small scales in turbulence (Richardson Reference Richardson1922; Kolmogorov Reference Kolmogorov1941b; Onsager Reference Onsager1949; Frisch Reference Frisch1995). Turbulent kinetic energy is produced primarily in the form of large-scale motions with size comparable to that of the shear flow that serves as the energy source. The kinetic energy is dissipated to thermal energy by viscosity ( $\nu$) primarily acting on the smallest-scale motions in the flow, which are comparable in size to the Kolmogorov length scale,
 $\eta = \nu ^{3/4} \epsilon ^{-1/4}$ (Kolmogorov Reference Kolmogorov1941b). The energy cascade describes the process of transferring kinetic energy from the largest-scale motions where it is produced to the smallest-scale motions responsible for irreversible dissipation. The cascade phenomenology asserts that the predominant exchanges of energy occur between coherent motions having nearly the same size, so that energy is passed in a quasi step-wise manner to successively smaller-scale motions. The cascade terminates when the smallest scales are finally energized and viscous dissipation removes kinetic energy at the rate it is supplied.
The energy cascade provides a conceptually simple phenomenological explanation for the observed complex, chaotic behaviour of turbulence. Supposing that the energy transfer processes are chaotic and somewhat independent across length scales, the cascade idea provides an attractive explanation for why universal properties are observed for such a wide range of turbulent flow scenarios. However, two significant questions are raised.
First, is the net transfer of energy from large to small scales in turbulence actually accomplished primarily by interactions between motions having nearly the same size? This is the question of scale locality, which is a necessary property for the cascade phenomenology to be plausible. Strictly speaking, the energy transfer does not occur in a well-defined step-like manner (Lumley Reference Lumley1992). In this sense, the cascade is ‘leaky’. However, the question of scale locality may be answered more rigorously by quantifying the relative contribution of interactions between differently sized motions to the energy cascade rate. Theoretical analysis predicts that the contribution to the cascade rate across scale  $\ell$ due to interactions with motions at scale
 $\ell ^\prime < \ell$ decays as a power law for
 $\ell ^\prime \ll \ell$, specifically,
 ${\sim }( \ell ^\prime / \ell )^{4/3}$ (Kraichnan Reference Kraichnan1966, Reference Kraichnan1971; Eyink Reference Eyink2005; Eyink & Aluie Reference Eyink and Aluie2009). This power law indicates the degree of ultra-violet locality (L'vov & Falkovich Reference L'vov and Falkovich1992). Numerous numerical investigations have revealed at least some degree of scale locality in the mean energy transfer across scales, with general support for the theoretical scaling (Zhou Reference Zhou1993a,Reference Zhoub; Aoyama et al. Reference Aoyama, Ishihara, Kaneda, Yokokawa, Itakura and Uno2005; Mininni, Alexakis & Pouquet Reference Mininni, Alexakis and Pouquet2006; Domaradzki & Carati Reference Domaradzki and Carati2007a,Reference Domaradzki and Caratib; Mininni, Alexakis & Pouquet Reference Mininni, Alexakis and Pouquet2008; Aluie & Eyink Reference Aluie and Eyink2009; Domaradzki, Teaca & Carati Reference Domaradzki, Teaca and Carati2009; Eyink & Aluie Reference Eyink and Aluie2009; Cardesa et al. Reference Cardesa, Vela-Martín, Dong and Jiménez2015; Doan et al. Reference Doan, Swaminathan, Davidson and Tanahashi2018).
The second question of significant importance to the energy cascade phenomenology is: What dynamical mechanism is responsible for driving such a cascade? To some degree, answering this second question should also shed some light on the first. That is, identifying the dynamical mechanism of the cascade should provide some basis for examining the scale locality of that mechanism. For example, consider the most commonly cited mechanism for the cascade, i.e. vortex stretching (Taylor Reference Taylor1938; Onsager Reference Onsager1949; Tennekes & Lumley Reference Tennekes and Lumley1972). The vortex stretching mechanism of the energy cascade is illustrated in figure 1 and may be described as follows. A compact region characterized by elevated vorticity (i.e. a vortex) subjected to an extensional strain rate along its axis of rotation will have its cross-section reduced. As this occurs, the vorticity in that region will be enhanced in keeping with Kelvin's theorem. In this way, kinetic energy is passed from straining motions to vortical motions that decrease in size. Owing to this proposed cascade mechanism, the role of vortex structures in turbulence dynamics has been an active subject of research over the years (Lundgren Reference Lundgren1982; Chorin Reference Chorin1988; Pullin & Saffman Reference Pullin and Saffman1994, Reference Pullin and Saffman1998; Jiménez & Wray Reference Jiménez and Wray1998; Lozano-Durán, Holzner & Jiménez Reference Lozano-Durán, Holzner and Jiménez2016). For instance, numerical simulations have been used to confirm that interactions between vortices and straining regions are strongest when the vortical structure is only somewhat smaller than the straining region (Doan et al. Reference Doan, Swaminathan, Davidson and Tanahashi2018).
A simplified illustration of vortex stretching.

The question of dynamical mechanism is of high importance in its own right (Carbone & Bragg Reference Carbone and Bragg2020). This is especially true for reduced-order models of turbulence, a practical step for predicting many turbulent flows. Large-eddy simulations (LES) are widely used and increasing in popularity with growing computational resources. The LES approach directly calculates the dynamics of large-scale motions on a computational grid while requiring a closure model for representing the effect of smaller, unresolved scales on the computed large-scale motions. Arguably the most important feature of an LES closure model is that it removes energy from the resolved scales in an accurate manner. However, eddy viscosity closures remain the most common approach to LES alongside heuristic approaches which rely on implicit modelling via specially designed discretization errors. From a physical perspective, these popular models are known to be deficient despite their widespread use (Borue & Orszag Reference Borue and Orszag1998). In contrast, the stretched vortex model of Misra & Pullin (Reference Misra and Pullin1997) attempts to build a model on more explicit physical grounds, appealing to the classical vortex stretching mechanism of the cascade. It has also been proposed to use vortex stretching to determine an eddy viscosity (Silvis & Verstappen Reference Silvis and Verstappen2019).
More recently, the self-amplification of straining motions has been proposed as an alternative cascade mechanism (Tsinober Reference Tsinober2009; Paul, Papadakis & Vassilicos Reference Paul, Papadakis and Vassilicos2017; Carbone & Bragg Reference Carbone and Bragg2020; Johnson Reference Johnson2020a), casting doubt on the widespread view that the cascade is driven primarily by vortex stretching. Strain-rate self-amplification is illustrated in figure 2. A region of enhanced strain rate with one strong negative eigenvalue experiences a strengthening of that compressive strain rate as faster moving fluid catches up with slower moving fluid in front of it. This decreases the spatial extent of strong compressive strain rate. This mechanism is responsible for the finite-time singularity and shock formation in the inviscid Burgers equation, but has received much less attention in the context of Navier–Stokes. The restricted Euler equation, a dynamical system more relevant to three-dimensional (3-D) Navier–Stokes than the Burgers equation, displays a finite-time singularity that includes both strain self-amplification and vorticity stretching (Vieillefosse Reference Vieillefosse1982).
A simplified schematic of strain self-amplification.

Indeed, more careful accounting of the relative contributions of vortex stretching and strain self-amplification in turbulent flows indicate that the latter is responsible for a larger share of the energy cascade rate. Most notably, Johnson (Reference Johnson2020a) derived an exact, spatially local relationship between the energy cascade rate and the dynamical mechanisms of vortex stretching and strain self-amplification. It is the goal of this paper to leverage this result to illuminate key aspects of the cascade as seen from the perspective of velocity gradient dynamics.
In this paper, the roles of vortex stretching and strain self-amplification in determining the energy cascade rate are elucidated. First, § 2 reviews turbulent velocity gradients dynamics and the framework for studying the energy cascade in terms of spatial filtering. The connection between the velocity gradients and the cascade is established in § 3, enhancing and building upon the results of Johnson (Reference Johnson2020a). Simulation results highlight the relative importance of each mechanism to the energy cascade. Also included is a brief discussion of the inverse energy cascade in 2-D flows, demonstrating a comprehensive framework for turbulent cascades. Following that, § 4 builds on the concept of cascade efficiency from Ballouz & Ouellette (Reference Ballouz and Ouellette2018), examining the efficiency of the dynamical mechanisms comprising the cascade rate. This analysis reveals the relevance of the restricted Euler dynamics to the energy cascade, while judging the relative suitability of an eddy viscosity hypothesis for representing the various dynamical processes involved. Then, § 5 returns to the question of scale locality in terms of both vorticity stretching and strain self-amplification. It is shown that the concept of cascade efficiency can be examined on a scale-by-scale basis to test the de-correlation idea of Eyink (Reference Eyink2005). Conclusions are drawn in § 6.
2. Background
2.1. Simulation database: homogeneous isotropic turbulence
In this paper, the kinetic energy cascade is quantified via direct numerical simulation (DNS) of forced homogeneous isotropic turbulence (HIT) in a triply periodic domain. The incompressible Navier–Stokes equations,
 \begin{equation} \frac{\partial u_i}{\partial t} + u_j \frac{\partial u_i}{\partial x_j} ={-} \frac{\partial p}{\partial x_i} + \nu \nabla^2 u_i + f_i, \quad \frac{\partial u_j}{\partial x_j} = 0, \end{equation}
are solved using a pseudo-spectral method with  $1024$ collocation points in each direction. The velocity field,
 $\boldsymbol {u}$, is advanced in time with a second-order Adams–Bashforth scheme, and the pressure
 $p$ simply enforces the divergence-free condition. The
 $2\sqrt {2}/3$ rule for wavenumber truncation is used with phase-shift dealiasing (Patterson & Orszag Reference Patterson and Orszag1971). The forcing,
 $\boldsymbol {f}$, is specifically designed to maintain constant kinetic energy in the first two wavenumber shells. After a startup period, statistics are computed over
 $6$ large-eddy turnover times. The Taylor-scale Reynolds number is approximately
 $Re_\lambda = 400$ with grid resolution
 $k_{max} \eta = 1.4$. The integral length scale is
 $L/\eta = 460$.
HIT is a very useful canonical flow to efficiently explore the energetics of small- and intermediate-scale turbulence dynamics. The analysis performed in this paper is not limited to HIT in principle, and the inertial range results are expected to be representative of a wide range of turbulent shear flows at sufficiently high Reynolds numbers.
2.2. Velocity gradient tensor
Vorticity stretching and strain self-amplification are dynamical processes defined via the velocity gradient tensor,  $\boldsymbol {A}$, which is comprised of the strain-rate tensor,
 $\boldsymbol {S}$, and the rotation-rate tensor,
 $\boldsymbol {\varOmega }$,
 \begin{equation} A_{ij} = \frac{\partial
u_i}{\partial x_j} = S_{ij} + \varOmega_{ij}, \quad S_{ij}
= \frac{1}{2}(A_{ij} + A_{ji}),\quad \varOmega_{ij} =
\frac{1}{2}(A_{ij} -
A_{ji}),
\end{equation}
where the rotation-rate tensor may be written in terms of the vorticity vector  $\boldsymbol {\omega } = \boldsymbol {\nabla } \times \boldsymbol {u}$,
 \begin{equation} \varOmega_{ij} ={-}\tfrac{1}{2} \epsilon_{ijk} \omega_k, \quad \omega_i ={-} \epsilon_{ijk} \varOmega_{jk}. \end{equation}
This decomposition is foundational to the energetics of turbulent flows because viscosity resists deformation but not rotation. Thus, the rate at which kinetic energy is dissipated into thermal energy depends only on the (Frobenius norm of the) strain-rate tensor,
 \begin{equation} \epsilon = 2 \nu S_{ij} S_{ij} = 2 \nu \| \boldsymbol{S} \|^2. \end{equation}
On the other hand, the vorticity plays no direct role in the viscous dissipation of kinetic energy. However, vorticity is still essential to the dynamics leading to energy dissipation, as seen from the first relation of Betchov (Reference Betchov1956) for incompressible homogeneous turbulence,
 \begin{equation} \langle \| \boldsymbol{S}\|^2 \rangle = \tfrac{1}{2}\langle |\boldsymbol{\omega}|^2 \rangle. \end{equation}
Angle brackets denote ensemble averaging. The Betchov relation shows that the average (or global) amount of vorticity and strain rate is held in balance for incompressible flows, presumably by the action of the pressure as it enforces  $\boldsymbol {\nabla } \boldsymbol {\cdot } \boldsymbol {u} = 0$. Thus, the significantly enhanced dissipation rates in turbulence cannot occur without equally enhanced enstrophy. At sufficiently high Reynolds numbers, this relationship holds to good approximation even for inhomogeneous flows.
Similarly, the norm of the velocity gradient is the sum of the vorticity and strain-rate norms,
 \begin{equation} \tfrac{1}{2 }\|\boldsymbol{A}\|^2 = \tfrac{1}{4} |\boldsymbol{\omega}|^2 + \tfrac{1}{2} \| \boldsymbol{S} \|^2, \end{equation}
so that (2.5) implies a statistical equi-partition between enstrophy and dissipation. Thus, the second invariant of the velocity gradient tensor,
 \begin{equation} Q ={-}\tfrac{1}{2} A_{ij} A_{ji} = \tfrac{1}{4} |\boldsymbol{\omega}|^2 - \tfrac{1}{2} \| \boldsymbol{S} \|^2, \end{equation}
has an average of zero.
The strain-rate tensor, being symmetric, has 3 real eigenvalues,  $\lambda _1 > \lambda _2 > \lambda _3$, associated with a set of orthogonal eigenvectors. The eigenvalues sum to zero for incompressible flows,
 $\lambda _1 + \lambda _2 + \lambda _3 = 0$. Therefore, the largest eigenvalue is always extensional along its eigenvector,
 $\lambda _1 \geq 0$, and the smallest one is always compressive,
 $\lambda _3 \leq 0$. The intermediate eigenvalue,
 $\lambda _2$, may be positive or negative. The sign of
 $\lambda _2$ indicates the topology of fluid particle deformations, figure 3, and has more important dynamical effects as discussed below.
Depiction of the velocity gradient tensor in the strain-rate eigenframe. Velocity gradients with two extensional eigenvalues (a) tend to deform initially spherical fluid particles into disk-like oblate spheroids. Velocity gradients with two compressive eigenvalues (b) deform spherical fluid particles to prolate spheroids, like a rugby ball shape.

2.3. Velocity gradient dynamics
Consider a Lagrangian view of turbulence as a collection of fluid particles characterized by their deformational and rotational behaviour, i.e. their velocity gradient tensor. The Lagrangian evolution equation for the velocity gradient tensor is derived as the gradient of (2.1a,b),
 \begin{equation}
\frac{\textrm{D}A_{ij}}{\textrm{D}t} = \underbrace{ -
A_{ik}A_{kj} - \frac{2}{3} Q \delta_{ij}
}_{\mathit{autonomous\ dynamics}} - \underbrace{
\iiint_{PV} \left[
\frac{Q(\boldsymbol{x}+\boldsymbol{r})}{2{\rm \pi}
|\boldsymbol{r}|^3} \left( \delta_{ij} - 3 \frac{r_i
r_j}{|\boldsymbol{r}|^2} \right) \right]
\textrm{d}\boldsymbol{r} + \nu \nabla^2 A_{ij}
}_{\mathit{nearby\ particle\ interactions}},
\end{equation}
where the formal solution of the pressure Poisson equation,  $\nabla ^2 p = 2 Q$, is used to write the pressure Hessian as the sum of the second and third terms in (2.8) (Ohkitani & Kishiba Reference Ohkitani and Kishiba1995). The contribution of pressure to the autonomous dynamics is due to the enforcement of
 $\boldsymbol {\nabla } \boldsymbol {\cdot } \boldsymbol {u} = 0$ at the point on the trajectory, while the non-local integral arises from the enforcement of
 $\boldsymbol {\nabla } \boldsymbol {\cdot } \boldsymbol {u} = 0$ at all surrounding points. For HIT simulations with large-scale forcing, the gradient of the force is typically negligible compared to other terms in (2.8) at high Reynolds numbers.
Significant insight may be gained into velocity gradient dynamics by focusing only on its autonomous dynamics using the restricted Euler equation,
 \begin{equation} \frac{\textrm{D}A_{ij}}{\textrm{D}t} ={-} A_{ik}A_{kj} - \frac{1}{3} A_{mn} A_{nm} \delta_{ij}. \end{equation}
By neglecting the interaction with the velocity gradients of other surrounding fluid particles, the restricted Euler equation represents a dramatic mathematical simplification of turbulent flows while retaining some key dynamical processes. In fact, rigorous mathematical results are possible (Vieillefosse Reference Vieillefosse1982, Reference Vieillefosse1984; Cantwell Reference Cantwell1992).
The most salient feature of solutions to the restricted Euler equation is a finite-time singularity for (almost) all initial conditions. The cause of this singularity may be readily identified using the equation for the velocity gradient norm in restricted Euler dynamics,
 \begin{equation} \frac{\textrm{D}}{\textrm{D}t}\left( \frac{1}{2} \| \boldsymbol{A} \|^2 \right) = \underbrace{ \frac{1}{4} \omega_i S_{ij} \omega_j }_{P_\omega} - \underbrace{ S_{ij} S_{jk} S_{ki} }_{P_s}. \end{equation}
The two terms on the right side of (2.10) represent production of velocity gradient magnitude by vorticity stretching and strain self-amplification, respectively.
The local rate of velocity gradient production by vorticity stretching/compression,
 \begin{equation} P_\omega= \tfrac{1}{4} |\boldsymbol{\omega}|^2 \sum_{i=1}^{3} \lambda_i \cos^2(\theta_{\omega,i}), \end{equation}
depends strongly on how the vorticity vector aligns in the strain-rate eigenframe, figure 3. Here,  $\theta _{\omega ,i}$ is the angle between the vorticity and the
 $i$th eigenvector of the strain-rate tensor. The local enstrophy, and hence the velocity gradient magnitude, is increased when the vorticity vector aligns more with eigenvectors having positive (extensional) eigenvalues. Velocity gradient production rate via strain self-amplification is,
 \begin{equation} P_s ={-} 3 \lambda_1 \lambda_2 \lambda_3. \end{equation}
The strain rate amplifies itself when  $\lambda _2 > 0$ but self-attenuates when
 $\lambda _2 < 0$, see figure 3. It is no surprise, then, that restricted Euler solutions tend toward a state with two positive strain-rate eigenvalues,
 $\lambda _1 = \lambda _2 = -\frac {1}{2}\lambda _3$, as they approach the finite-time singularity. Furthermore, the vorticity aligns with the eigenvector associated with the intermediate eigenvalue,
 $\lambda _2$, in this approach to singularity. Thus, both strain self-amplification and vorticity stretching together drive the finite-time singularity in restricted Euler.
Incompressible Navier–Stokes dynamics, with the non-local pressure Hessian and viscous term reintroduced, do not exhibit the finite-time singularity seen for the restricted Euler equation. Instead, there is a balance between vorticity and strain-rate as already discussed with (2.5). Betchov (Reference Betchov1956) provided another relation for incompressible homogeneous turbulence, namely,
 \begin{equation} -\langle S_{ij} S_{jk} S_{ki} \rangle = \tfrac{3}{4}\langle \omega_i S_{ij} \omega_j \rangle \quad \text{or} \quad \langle P_s \rangle = 3 \langle P_\omega \rangle, \end{equation}
which means that the average value of  $R$ (the third invariant of the velocity gradient tensor) is also zero, as enforced by the pressure via the constraint
 $\boldsymbol {\nabla } \boldsymbol {\cdot } \boldsymbol {u} = 0$. As with (2.5), (2.13a,b) is approximately true for high Reynolds number inhomogeneous flows. What this means is that, while the pressure enforces
 $\boldsymbol {\nabla } \boldsymbol {\cdot } \boldsymbol {u} = 0$ leading to an equal partition between dissipation and enstrophy, it also causes the strain-rate self-amplification to produce stronger velocity gradients at three times the rate of vorticity stretching.
The significance of the restricted Euler equation is that its signature features are unmistakably observed in the statistics of experiments and DNSs of the Navier–Stokes equations. Indeed, turbulent flows show a tendency of the vorticity to align with the strain-rate eigenvector associated with the intermediate eigenvalue,  $\lambda _2$, which tends to be positive much more often than it is negative (Ashurst et al. Reference Ashurst, Kerstein, Kerr and Gibson1987; Kerr Reference Kerr1987; Tsinober, Kit & Dracos Reference Tsinober, Kit and Dracos1992; Lund & Rogers Reference Lund and Rogers1994; Mullin & Dahm Reference Mullin and Dahm2006; Gulitski et al. Reference Gulitski, Kholmyansky, Kinzelbach, Luthi, Tsinober and Yorish2007). In addition, turbulence is characterized by enhanced probabilities of strong velocity gradients along the Vieillefosse manifold,
 $4 Q^3 + 27 R^2 = 0$ in the fourth quadrant, which is an attracting manifold along which the finite-time singularity occurs for restricted Euler (Cantwell Reference Cantwell1993; Soria et al. Reference Soria, Sondergaard, Cantwell, Chong and Perry1994; Chong et al. Reference Chong, Soria, Perry, Chacin, Cantwell and Na1998; Nomura & Post Reference Nomura and Post1998; Ooi et al. Reference Ooi, Martin, Soria and Chong1999; Gulitski et al. Reference Gulitski, Kholmyansky, Kinzelbach, Luthi, Tsinober and Yorish2007; Elsinga & Marusic Reference Elsinga and Marusic2010). While the non-local part of the pressure Hessian tensor, along with viscous effects, are important for describing turbulence quantitatively, many of the unique qualitative features of turbulent velocity gradients can be connected to restricted Euler dynamics.
In summary, velocity gradients in a fluid undergoing nonlinear self-advection ( $\boldsymbol {u}\boldsymbol {\cdot }\boldsymbol {\nabla }\boldsymbol {u}$) naturally strengthen via vorticity stretching and strain self-amplification. Of these two dynamical processes, strain self-amplification is three times as strong on average, as enforced by the non-local action of the pressure. For more discussion about velocity gradient dynamics, as well as measurement and modelling, the reader is referred to (Tsinober Reference Tsinober2009; Wallace Reference Wallace2009; Meneveau Reference Meneveau2011). Next, the energy cascade is introduced using a spatial filtering formulation. As will be shown, this framework allows for directly relating the velocity gradient dynamics to the energy cascade.
2.4. Spatial filtering and the energy cascade
A spatial low-pass filter,
 \begin{equation} \bar{a}^\ell(\boldsymbol{x}) = \iiint_{-\infty}^{\infty} G_\ell(\boldsymbol{r}) a(\boldsymbol{x} + \boldsymbol{r}) \,\textrm{d}\boldsymbol{r}, \quad \mathcal{F}\{ \bar{a}^\ell \} = (2{\rm \pi})^3\mathcal{F}\{ G_\ell\} \mathcal{F}\{ \widehat{a} \} \end{equation}
retains features of a field  $a(\boldsymbol {x})$ that are larger than
 $\ell$ while removing features smaller than
 $\ell$ (Leonard Reference Leonard1975; Germano Reference Germano1992). Here,
 $\mathcal {F}$ denotes the 3-D Fourier transform,
 \begin{equation} \mathcal{F}\{ a \}(\boldsymbol{k}) = \frac{1}{(2{\rm \pi})^3} \iiint_{-\infty}^{\infty} a(\boldsymbol{x}) \exp( -\textrm{i} \boldsymbol{k}\boldsymbol{\cdot}\boldsymbol{x} )\, \textrm{d}\boldsymbol{x}, \end{equation}
with inverse transform,
 \begin{equation} \mathcal{F}^{{-}1}\{ b \}(\boldsymbol{x}) = \iiint_{-\infty}^{\infty} b(\boldsymbol{k}) \exp( \textrm{i} \boldsymbol{k}\boldsymbol{\cdot}\boldsymbol{x})\, \textrm{d}\boldsymbol{k}. \end{equation}
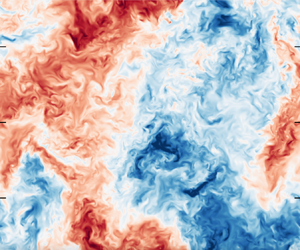
An example velocity field from the DNS of HIT is shown in figure 4, before and after the application of a spatial filter. The spatial filter may be interpreted as a form of local averaging, weighted by the filter kernel  $G_\ell (\boldsymbol {r})$. Following Germano (Reference Germano1992), the generalized second moment is the difference of the filtered product and the product of two filtered fields,
 \begin{equation} \tau_\ell(a,b) = \overline{a b}^\ell - \bar{a}^\ell \bar{b}^\ell. \end{equation}
It is a generalized covariance of small-scale activity (smaller than  $\ell$).
The fluid velocity in the  $z$ direction on an
 $xy$ plane in the HIT simulation: (a) unfiltered, (b) filtered at
 $\ell = 25\eta$ using a Gaussian filter, (3.1a,b).

The kinetic energy can be thus defined as the sum of large-scale and small-scale energies,
 \begin{equation} \tfrac{1}{2}\overline{u_i u_i}^\ell = \tfrac{1}{2}\bar{u}_i^\ell \bar{u}_i^\ell + \tfrac{1}{2}\tau_\ell(u_i, u_i). \end{equation}
If the filter kernel is positive semi-definite, i.e.  $G_\ell (\boldsymbol {r}) \geq 0$ for all
 $\boldsymbol {r}$, then the subfilter-scale energy is positive everywhere,
 $\tau (u_i, u_i)(\boldsymbol {x}) \geq 0$ for all
 $\boldsymbol {x}$ (Vreman, Geurts & Kuerten Reference Vreman, Geurts and Kuerten1994).
Applying a low-pass filter to the incompressible Navier–Stokes equations, (2.1a,b), results in an evolution equation for the filtered velocity field,
 \begin{equation} \frac{\partial \bar{u}_i^\ell}{\partial t} + \bar{u}_j ^\ell\frac{\partial \bar{u}_i^\ell}{\partial x_j} ={-} \frac{\partial \bar{p}^\ell}{\partial x_i} + \nu \nabla^2 \bar{u}_i^\ell - \frac{\partial \tau_\ell(u_i, u_j)}{\partial x_j} + \bar{f}_i^\ell. \end{equation}
The main difference with the unfiltered Navier–Stokes equation (2.1a,b), is the introduction of the subfilter stress tensor's divergence on the right side. The dynamical equation for the large-scale kinetic energy directly follows from multiplication of (2.19) by  $\bar {u}_i^\ell$,
 \begin{equation} \frac{\partial (\tfrac{1}{2}\bar{u}_i^\ell \bar{u}_i^\ell)}{\partial t} + \frac{\partial \varPhi_j^\ell}{\partial x_j} = \bar{u}_i^\ell \bar{f}_i^\ell + \tau_\ell(u_i,u_j) \bar{S}_{ij}^\ell - 2 \nu \bar{S}_{ij}^\ell \bar{S}_{ij}^\ell, \end{equation}
where
 \begin{equation} \varPhi_{j}^\ell = \tfrac{1}{2}\bar{u}_i^\ell \bar{u}_i^\ell \bar{u}_j^\ell + \bar{p}^\ell \bar{u}_j^\ell - 2 \nu \bar{u}_i^\ell \bar{S}_{ij}^\ell + \bar{u}_i^\ell \tau_\ell(u_i,u_j). \end{equation}
There are three source/sink terms. First, large-scale kinetic energy is produced though work done by the applied forcing function,  $\bar {u}_i^\ell \bar {f}_i^\ell$. Second, the subfilter stress may add or remove energy depending on its alignment with the filtered strain-rate tensor,
 $\tau _\ell (u_i,u_j) \bar {S}_{ij}^\ell$. Finally, the direct dissipation of large-scale kinetic energy by viscosity,
 $-2\nu \bar {S}_{ij}^\ell \bar {S}_{ij}^\ell$, is typically negligible if
 $\ell \gg \eta$.
An equation for total kinetic energy,  $\tfrac {1}{2} \overline {u_i u_i}^\ell$, is constructed by multiplying (2.1a,b) by
 $u_i$ and then filtering. Equation (2.20a) is subtracted from the resulting equation to form the transport equation for the small-scale energy,
 \begin{equation} \frac{\partial ( \tfrac{1}{2}\tau_\ell(u_i,u_j) )}{\partial t} + \frac{\partial \phi_j^\ell}{\partial x_j} = \tau_\ell(u_i, f_i) - \tau_\ell(u_i, u_j) \bar{S}_{ij}^\ell - 2 \nu \tau_\ell(S_{ij}, S_{ij}), \end{equation}
where
 \begin{equation} \phi_j^\ell = \tfrac{1}{2} \tau_\ell(u_i, u_i) \bar{u}_j^\ell + \tfrac{1}{2}\tau_\ell(u_i, u_i, u_j) + \tau_\ell(p, u_j) - 2 \nu \tau_\ell(u_i, S_{ij}), \end{equation}
where the second transport term is a generalized third moment (Germano Reference Germano1992),
 \begin{equation} \tau_\ell(a, b, c) = \overline{a b c}^\ell - \bar{a}^\ell \tau_\ell(b,c) - \bar{b}^\ell \tau_\ell(a,c) - \bar{c}^\ell \tau_\ell(a,b) - \bar{a}^\ell \bar{b}^\ell \bar{c}^\ell. \end{equation}
There are three sources/sinks in (2.21a), which have the following significance. The first source is direct forcing of the small scales,  $\tau _\ell (u_i, f_i)$, which is typically negligible for
 $\ell \ll L$. The second is the same term,
 $- \tau _\ell (u_i, u_j) \bar {S}_{ij}^\ell$, as appears with opposite sign in the large-scale energy equation (2.20a). This term represents the rate at which energy is transferred from motions of size larger than
 $\ell$ to motions of size smaller than
 $\ell$. Thus, the energy cascade rate is defined as (Leonard Reference Leonard1975; Germano Reference Germano1992; Meneveau & Katz Reference Meneveau and Katz2000),
 \begin{equation} \varPi^\ell ={-} \mathring{\tau}_\ell(u_i, u_j) \bar{S}_{ij}^\ell, \end{equation}
where the overset circle indicates the deviatoric component of the tensor,
 \begin{equation} \mathring{\tau}_\ell(u_i, u_j) = \tau_\ell(u_i, u_j) - \tfrac{1}{3} \tau_\ell(u_k, u_k) \delta_{ij}. \end{equation}
The isotropic part of the subfilter stress tensor does not contribute to the energy cascade rate,  $\varPi ^\ell$, because the trace of
 $\bar {\boldsymbol {S}}^\ell$ is zero due to incompressibility. Positive cascade rate indicates energy transfer from large to small scales and negative rate indicates backscatter or inverse cascade. It may be interpreted as the rate at which large-scale motions do work on small-scale motions (Ballouz & Ouellette Reference Ballouz and Ouellette2018).
Averaging (2.20a) and (2.21a) for a stationary, homogeneous flow yields, respectively,
 $$\begin{gather} 0 = \langle \bar{u}_i^\ell \bar{f}_i^\ell \rangle + \langle \tau_\ell(u_i,u_j) \bar{S}_{ij}^\ell \rangle - 2 \nu \langle \bar{S}_{ij}^\ell \bar{S}_{ij}^\ell \rangle, \end{gather}$$
 $$\begin{gather}0 = \langle \tau_\ell(u_i, f_i) \rangle - \langle \tau_\ell(u_i, u_j) \bar{S}_{ij}^\ell \rangle - 2 \nu \langle \tau_\ell(S_{ij}, S_{ij})\rangle. \end{gather}$$
In the inertial range of turbulence,  $\eta \ll \ell \ll L$, the viscous dissipation of the large scales and forcing of the small scales may be neglected,
 \begin{equation} \langle u_i f_i \rangle \approx \langle \bar{u}_i^\ell \bar{f}_i^\ell \rangle \approx{-} \langle \tau_\ell(u_i,u_j) \bar{S}_{ij}^\ell \rangle \approx 2 \nu \langle \tau_\ell(S_{ij}, S_{ij})\rangle \approx 2 \nu \langle S_{ij} S_{ij} \rangle. \end{equation}
More simply, the inertial range is the range length scales,  $\ell$, for which
 $\langle \varPi \rangle \approx \langle \epsilon \rangle$. Figure 5(a) tests for scales where this relation approximately holds.
(a) The pre-multiplied third-order longitudinal structure function alongside the mean interscale energy transfer. (b) The average norm of the filtered strain-rate tensor as function of filter width,  $\ell$. A
 $-2/3$ power law is consistent with inertial range behaviour. The inset is premultiplied by
 $\ell ^{2/3}$. In both panels, the two vertical grey lines are at
 $2\ell /\eta = 50$ and 150, indicating the approximate inertial range of scales. The integral length scale is
 $2 L / \eta = 920$.

2.5. Filtered velocity gradients
Velocity increments,
 \begin{equation} \delta u_i(\boldsymbol{r}; \boldsymbol{x}) = u_i(\boldsymbol{x}+\boldsymbol{r}) - u_i(\boldsymbol{x}) \end{equation}
and structure functions are prominent tools of classical turbulence theory. Filtered velocity gradients are intimately related to velocity increments (Eyink Reference Eyink1995),

where the filter kernel is assumed to be spherically symmetric. That is, the filtered velocity gradient is an averaging of velocity increments weighted by the gradient of the filter kernel. Thus, filtered velocity gradients contain information about velocity increments in the flow, arranged so as to illuminate the local topology of the flow at scale  $\ell$. Filtered velocity gradients can be decomposed into rotation and deformation at scale
 $\ell$,
 $$\begin{gather} \bar{A}_{ij}^\ell = \bar{S}_{ij}^\ell + \bar{\varOmega}_{ij}^\ell, \quad \bar{S}_{ij}^\ell = \tfrac{1}{2} ( \bar{A}_{ij}^\ell + \bar{A}_{ji}^\ell), \quad \bar{\varOmega}_{ij}^\ell = \tfrac{1}{2} ( \bar{A}_{ij}^\ell - \bar{A}_{ji}^\ell), \end{gather}$$
 $$\begin{gather}\bar{\varOmega}_{ij}^\ell ={-} \tfrac{1}{2} \epsilon_{ijk} \bar{\omega}_k^\ell, \quad \bar{\omega}_i^\ell ={-} \epsilon_{ijk} \bar{\varOmega}_{jk}^\ell, \end{gather}$$
 $$\begin{gather}\tfrac{1}{2} \| \bar{\boldsymbol{A}}^\ell \|^2 = \tfrac{1}{4} | \bar{\boldsymbol{\omega}}^\ell |^2 + \tfrac{1}{2}\| \bar{\boldsymbol{S}}^\ell \|^2, \quad \langle \| \bar{\boldsymbol{S}}^\ell \|^2 \rangle = \tfrac{1}{2} \langle |\bar{\boldsymbol{\omega}}^\ell|^2 \rangle. \end{gather}$$
The K41 scaling of the filtered strain-rate norm,  $\|\bar {\boldsymbol {S}}^{\ell }\| \sim \ell ^{-2/3}$, is shown in figure 5(b) as another indication of what filter widths may be considered to be in the inertial range.
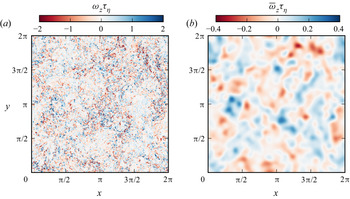
Figure 6 shows vorticity and filtered vorticity fields from the same snapshot used for figure 4. It is evident that the vorticity is predominantly organized at the smallest scales of motion, near  $\eta$. This is true of the velocity gradient tensor in general. However, the filtered velocity gradient, as demonstrated for the filtered vorticity, is primarily organized at a scale near the filter width. Thus, the filtered velocity gradient provides a good definition of fluid motions at scale
 $\ell$. Comparing figures 4 and 6, note the striking visual difference in how filtering effects the velocity field and the velocity gradient field.


Like the filtered velocity gradient, the subfilter stress tensor may also be written as a local averaging of velocity increments (Constantin, E & Titi Reference Constantin, E and Titi1994; Eyink Reference Eyink1995),
 \begin{align} \tau_\ell(u_i, u_j) &= \left[ \iiint \textrm{d}\boldsymbol{r} G_\ell(\boldsymbol{r}) \delta u_i(\boldsymbol{r}; \boldsymbol{x}) \delta u_j(\boldsymbol{r}; \boldsymbol{x}) \right]\nonumber\\ &\quad - \left[ \iiint \textrm{d}\boldsymbol{r} G_\ell(\boldsymbol{r}) \delta u_i(\boldsymbol{r}; \boldsymbol{x})\right] \left[ \iiint \textrm{d}\boldsymbol{r} G_\ell(\boldsymbol{r}) \delta u_j(\boldsymbol{r}; \boldsymbol{x})\right]. \end{align}
In this way, it can be directly shown that
 \begin{equation} \tau_\ell(u_i, u_j) \sim \delta u^2 \quad \text{and} \quad \bar{S}_{ij}^\ell \sim \delta u / \ell, \quad \text{therefore} \ \varPi^\ell \sim \delta u^3 / \ell, \end{equation}
so that the inertial range equation, from (2.27), in the form  $\langle \varPi ^\ell \rangle = \langle \epsilon \rangle$ is in some ways analogous to the celebrated four-fifths law of Kolmogorov (Reference Kolmogorov1941a), i.e.
 $\langle \delta u_L^3(r) \rangle = - \tfrac {4}{5} \langle \epsilon \rangle r$. The similarity between these two is highlighted in figure 5(a), which includes the pre-multiplied third-order longitudinal structure function alongside
 $\langle \varPi \rangle / \langle \epsilon \rangle$. These two are similar diagnostics of inertial range scales.
2.6. Filtered velocity gradient dynamics
Definitively linking the energy cascade rate with vorticity stretching and strain self-amplification is naturally done by considering the dynamics of filtered velocity gradients. Viewing the filtered flow as the collection of fluid particles of size  $\sim \ell$ following trajectories set by
 $\bar {\boldsymbol {u}}^\ell$, each particle's rotation and deformation dynamics may be described by the gradient of filtered Navier–Stokes, (2.19), which reads
 \begin{equation} \frac{\bar{\textrm{D}}\bar{A}_{ij}^\ell}{\overline{\textrm{D}t}} ={-} \underbrace{ \left( \bar{A}_{ik}^\ell \bar{A}_{kj}^\ell - \frac{1}{3} \bar{A}_{mn}^\ell \bar{A}_{nm}^\ell \delta_{ij} \right) }_{\mathit{autonomous\ dynamics}} - \left( \frac{\partial^2 \bar{p}^\ell}{\partial x_i x_j} - \frac{1}{3} \nabla^2 \bar{p}^\ell \delta_{ij} \right) + \nu \nabla^2 \bar{A}_{ij}^\ell - \frac{\partial \tau_\ell(u_i, u_k)}{\partial x_j \partial x_k}. \end{equation}
This equation gives the dynamical evolution of filtered velocity gradients along filtered Lagrangian trajectories,  $\bar {\textrm {D}}/\overline {\textrm {D}t} = \partial /\partial t + \bar {\boldsymbol {u}}^\ell \boldsymbol {\cdot }\boldsymbol {\nabla }$. The difference from unfiltered velocity gradients, (2.8), is the gradient of the subfilter scale force. The dynamical consequence of the subfilter-scale force is subtle, and the restricted Euler-like features observed for unfiltered velocity gradients are also seen for filtered ones (Danish & Meneveau Reference Danish and Meneveau2018). In other words, the autonomous dynamics of filtered velocity gradients is very influential in setting statistical trends in turbulent flows, as previously seen for unfiltered gradients.
The restricted Euler equation for filtered velocity gradient dynamics again results by neglecting all except the autonomous terms in (2.35),
 \begin{equation} \frac{\textrm{D}}{\textrm{D}t}\left( \frac{1}{2} \| \bar{\boldsymbol{A}}^\ell \|^2 \right) = P_{\bar{\omega}} + P_{\bar{s}} = \frac{1}{4} \bar{\omega}_i^\ell \bar{S}_{ij}^\ell \bar{\omega}_j^\ell - \bar{S}_{ij}^\ell \bar{S}_{jk}^\ell \bar{S}_{ki}^\ell. \end{equation}
This, which now neglects interactions with both nearby particles and subfilter scales, highlights the role of vorticity stretching and strain self-amplification in increasing the magnitude of filtered velocity gradients. Recall from (2.32a,b) that the filtered vorticity and strain-rate are also held in statistical equi-partition by the zero divergence condition,  $\boldsymbol {\nabla }\boldsymbol {\cdot }\bar {\boldsymbol {u}}^\ell = 0$, owing to the filtered pressure. In addition, the average amount of strain self-amplification is also held at three times the vorticity stretching for filtered fields,
 \begin{equation} -\langle \bar{S}_{ij}^\ell \bar{S}_{jk}^\ell \bar{S}_{ki}^\ell \rangle = \tfrac{3}{4}\langle \bar{\omega}_i^\ell \bar{S}_{ij}^\ell \bar{\omega}_j^\ell \rangle \quad \text{or} \quad \langle P_{\bar{s}} \rangle = 3 \langle P_{\bar{\omega}} \rangle. \end{equation}
Equation (2.36) is only meant to demonstrate the relationship of  $P_{\bar {s}}$ and
 $P_{\bar {\omega }}$ with the growth of filtered velocity gradients. For a full description of real turbulent flows, the pressure, viscous, and subfilter terms must be retained.
3. Energy cascade in terms of filtered velocity gradients
3.1. Theory
The local energy cascade rate,  $\varPi (\boldsymbol {x}, t)$, is determined by the filtered strain-rate tensor, the subfilter stress tensor and how those two align. Johnson (Reference Johnson2020a) demonstrated how the subfilter stress tensor may be phrased in terms of filtered velocity gradients across all scales
 $\leq \ell$, so that the energy cascade rate may be written solely in terms of filtered velocity gradients. This result directly connects the restricted Euler singularity with the fact that turbulence generates a net cascade from large to small scales. A summary of the derivation is presented below, with more details provided in Appendix C.
A Gaussian filter kernel
 \begin{equation} G_\ell(\boldsymbol{r}) = \mathcal{N} \exp\left( - \frac{|\boldsymbol{r}|^2}{2\ell^2}\right), \quad (2{\rm \pi})^3\mathcal{F}\{G_\ell\}(\boldsymbol{k}) = \exp\left( -\frac{1}{2} |\boldsymbol{k}|^2 \ell^2 \right), \end{equation}
decays rapidly in both physical space and wavenumber space, and is thus a popular choice for studies involving explicit filters (Borue & Orszag Reference Borue and Orszag1998; Domaradzki & Carati Reference Domaradzki and Carati2007b; Eyink & Aluie Reference Eyink and Aluie2009; Leung, Swaminathan & Davidson Reference Leung, Swaminathan and Davidson2012; Cardesa et al. Reference Cardesa, Vela-Martín, Dong and Jiménez2015; Lozano-Durán et al. Reference Lozano-Durán, Holzner and Jiménez2016; Buzzicotti et al. Reference Buzzicotti, Linkmann, Aluie, Biferale, Brasseur and Meneveau2018; Alexakis & Chibbaro Reference Alexakis and Chibbaro2020; Dong et al. Reference Dong, Huang, Yuan and Lozano-Durán2020; Portwood et al. Reference Portwood, Nadiga, Saenz and Livescu2020; Vela-Martín & Jiménez Reference Vela-Martín and Jiménez2021). Here, the definition of the filter width,  $\ell$, is chosen such that its gradient,
 $\textrm {d}G/\textrm {d}r$, is maximum at
 $r=\ell$. That is, velocity increments at separation
 $r = \ell$ have are the most heavily weighted when constructing the filtered velocity gradient according to (2.29). Note that in figure 5(a),
 $2\ell$ appears to correspond to the structure function separation
 $r$. This happens because, in (2.29), the velocity increments with equal and opposite separation vectors of length
 $\ell$ are essentially combined to form velocity increments at
 $2\ell$, which are integrated on a half-sphere to form the filtered velocity gradient.
The Gaussian filter has already been demonstrated in physical space in figures 4 and 6. Figure 7 shows average energy spectra with and without a Gaussian filter. Note that the unfiltered spectrum decays as a (stretched) exponential in the dissipation range (Townsend Reference Townsend1951; Kraichnan Reference Kraichnan1959; Novikov Reference Novikov1961; Qian Reference Qian1984; Sreenivasan Reference Sreenivasan1985; Foias, Manley & Sirovich Reference Foias, Manley and Sirovich1990; Smith & Reynolds Reference Smith and Reynolds1991; Manley Reference Manley1992; Sanada Reference Sanada1992; Chen et al. Reference Chen, Doolen, Herring, Kraichnan, Orszag and She1993; Saddoughi & Veeravalli Reference Saddoughi and Veeravalli1994; Sirovich, Smith & Yakhot Reference Sirovich, Smith and Yakhot1994; Ishihara et al. Reference Ishihara, Kaneda, Yokokawa, Itakura and Uno2005; Khurshid, Donzis & Sreenivasan Reference Khurshid, Donzis and Sreenivasan2018; Buaria & Sreenivasan Reference Buaria and Sreenivasan2020), and the effect of the Gaussian filter moves this exponential-like decay to lower wavenumbers. The unfiltered spectrum shows agreement with the standard Kolmogorov spectrum,  $E(k) = 1.6 \epsilon ^{2/3} k^{-5/3}$ over a limited range of wavenumbers
 $k \eta \ll 1$. A ‘spectral bump’, as typically observed, is evident near
 $0.1 < k\eta < 0.2$ (Qian Reference Qian1984; Falkovich Reference Falkovich1994; Lohse & Müller-Groeling Reference Lohse and Müller-Groeling1995; Kurien, Taylor & Matsumoto Reference Kurien, Taylor and Matsumoto2004; Bershadskii Reference Bershadskii2008; Frisch et al. Reference Frisch, Kurien, Pandit, Pauls, Ray, Wirth and Zhu2008; Meyers & Meneveau Reference Meyers and Meneveau2008; Mininni et al. Reference Mininni, Alexakis and Pouquet2008; Donzis & Sreenivasan Reference Donzis and Sreenivasan2010). This is usually associated with a ‘bottleneck effect’ at the end of the cascade in which viscosity is slightly too slow in dissipating energy as it arrives from larger scales, resulting in a slight pile-up of energy. While the filtering approach does smooth out this effect to some degree, it is visible for the filtered strain-rate norm in the inset of figure 5(b) in the range
 $5 < \ell /\eta < 10$.
(a) Average energy spectrum from the HIT simulation, and (b) filtered spectra using a Gaussian filter with various values of  $0.9 \eta \leq \ell \leq 170 \eta$ spaced evenly in logarithmic space. The black dashed line indicates the inertial range spectrum,
 $E(k) = 1.6 \epsilon ^{2/3} k^{-5/3}$. The inset in panel (a) shows the premultiplied spectrum on a log–linear plot.

Because the Gaussian kernel serves as the Green's function for the diffusion equation, a filtered quantity is the solution to
 \begin{equation} \frac{\partial \bar{a}^\ell}{\partial (\ell^2)} = \frac{1}{2} \nabla^2 \bar{a}^\ell, \quad \text{with initial condition} \ \bar{a}^{\ell=0}(\boldsymbol{x}) = a(\boldsymbol{x}), \end{equation}
where the square of the filter width,  $\ell ^2$, serves as a time-like variable. The initial condition at
 $\ell = 0$ is the unfiltered field. From this observation, it is straightforward to show that any generalized second moment may be written as
 \begin{equation} \frac{\partial \tau_\ell(a, b)}{\partial (\ell^2)} = \frac{1}{2} \nabla^2 \tau_{\ell}(a, b) + \frac{\partial \bar{a}^\ell}{\partial x_k} \frac{\partial \bar{b}^\ell}{\partial x_k}, \quad \text{with initial condition} \ \tau_{\ell=0}(a, b) = 0. \end{equation}
Thus, the generalized second moment is the solution to a forced diffusion equation with zero initial condition. The forcing is the product of filtered gradients as a function of scale (the time-like variable). The formal solution for this forced diffusion equation is
 \begin{equation} \tau_\ell(a,b) = \int_{0}^{\ell^2} \textrm{d}\alpha \overline{\overline{\frac{\partial a}{\partial x_k}}^{\sqrt{\alpha}} \overline{\frac{\partial b}{\partial x_k}}^{\sqrt{\alpha}} }^{\beta}, \end{equation}
where  $\beta \equiv \sqrt {\ell ^2 - \alpha }$ is the conjugate filter such that successively filtering at
 $\sqrt {\alpha }$ and
 $\beta$ is equivalent to applying a single filter at scale
 $\ell$,
 \begin{equation} \overline{\bar{a}^{\sqrt{\alpha}}}^{\beta} = \bar{a}^{\ell}. \end{equation}
The formal solution in (3.3) contains two components,
 \begin{equation} \tau_\ell(a,b) = \ell^2 \overline{\frac{\partial a}{\partial x_i}}^{\ell} \overline{\frac{\partial b}{\partial x_i}}^{\ell} + \int_{0}^{\ell^2} \textrm{d}\alpha \tau_\beta\left( \overline{\frac{\partial a}{\partial x_k}}^{\sqrt{\alpha}}, \overline{\frac{\partial b}{\partial x_k}}^{\sqrt{\alpha}} \right). \end{equation}
The first component is the product of gradients at the filter scale  $\ell$ and the second component involves subfilter-scale generalized second moments of gradients filtered at scales smaller than
 $\ell$. Equation (3.6) is applied to the subfilter stress,
 $\tau _\ell (u_i, u_j)$, by setting
 $a = u_i$ and
 $b = u_j$. Contracting with
 $\bar {S}_{ij}^\ell$ to compute the energy cascade rate,
 $\varPi ^\ell$, results in
 \begin{equation} \varPi^\ell = \varPi_{s1}^\ell + \varPi_{\omega 1}^\ell + \varPi_{s2}^\ell + \varPi_{\omega 2}^\ell + \varPi_{c}^\ell. \end{equation}
The five components of (3.7) are defined and interpreted as follows.
The first two terms involve velocity gradients filtered at scale  $\ell$ only. First, the self-amplification of the strain rate at scale
 $\ell$ transfers energy across scale
 $\ell$ at a rate,
 \begin{equation} \varPi_{s1}^\ell = \ell^2 P_{\bar{s}} ={-}\ell^2 \bar{S}_{ij}^\ell \bar{S}_{jk}^\ell \bar{S}_{ki}^\ell ={-}3 \ell^2 \lambda_1^\ell \lambda_2^\ell \lambda_3^\ell, \end{equation}
where  $\lambda _i^\ell$ are the
 $3$ eigenvalues of the strain-rate tensor filtered at scale
 $\ell$. This term gives mathematical definition to the simplified process sketched in figure 2. The strain-rate triple product represents the production of larger strain rates with smaller spatial extent which may be thought of as similar to the dynamics of the Burgers equation. The drawing in figure 2 is meant only to provide a useful intuitive feel for how
 $\varPi _{s1}^\ell$ transfers energy to smaller scales, not a sweeping claim that all regions with high
 $\varPi _{s1}$ resemble the simplified sketch.
Similarly, the vorticity at scale  $\ell$ is stretched by the strain rate at the same scale, which transfers energy
 \begin{equation} \varPi_{\omega 1}^\ell = \ell^2 P_{\bar{\omega}} = \frac{1}{4} \ell^2 \bar{S}_{ij}^\ell \bar{\omega}_{i}^\ell \bar{\omega}_j^\ell = \frac{1}{4} \ell^2 \left|\bar{\boldsymbol{\omega}}^\ell\right|^2 \sum_{i=1}^{3} \lambda_i^\ell \cos^2(\theta_{\omega,i}^\ell), \end{equation}
where  $\theta _{\omega ,i}^\ell$ are the angles between each corresponding eigenvector and the vorticity vector filtered at scale
 $\ell$. As such, this term quantifies the local rate at which vortex stretching, as sketched in a simplified manner in figure 1, passes energy across scale
 $\ell$.
For these first two terms, a subscript ‘1’ is used to denote that these rates involve quantities at a single filter scale. In fact, these two terms appear both in (3.7) and in the velocity gradient evolution, (2.36). The same processes responsible for increasing the filtered velocity gradient magnitude also redistribute energy to sub-filter scales, thus connecting the restricted Euler singularity with the energy cascade. It is also possible to obtain these two as leading-order terms in an infinite expansion in at least two ways.
First, using spatial filtering with a more general filter shape, the Taylor expansion of the Leonard stress is led by these two terms (Pope Reference Pope2000). Truncation of this expansion is sometimes called the Clark model, or tensor diffusivity model (Clark, Ferziger & Reynolds Reference Clark, Ferziger and Reynolds1979; Borue & Orszag Reference Borue and Orszag1998). This model performs well in a priori tests, but does not remove large-scale energy at a sufficient rate when used with LES (Vreman, Geurts & Kuerten Reference Vreman, Geurts and Kuerten1996, Reference Vreman, Geurts and Kuerten1997). Intriguingly, it may be shown that the Lagrangian memory effects in the evolution of the subfilter stress tensor are correctly mimicked by the tensor diffusivity model (Johnson Reference Johnson2020b). In practice, the tensor diffusivity model is often supplemented with an eddy viscosity model (Clark et al. Reference Clark, Ferziger and Reynolds1979; Vreman et al. Reference Vreman, Geurts and Kuerten1996, Reference Vreman, Geurts and Kuerten1997). Eyink (Reference Eyink2006) extended this result to a multiscale gradient expansion for the full subfilter stress tensor, but still relied on truncating infinite series. Carbone & Bragg (Reference Carbone and Bragg2020) provided an alternative derivation of single-scale vorticity stretching and strain self-amplification as leading-order terms in an infinite series. In that case, the Kármán–Howarth–Monin equation (de Kármán & Howarth Reference de Kármán and Howarth1938; Monin & Yaglom Reference Monin and Yaglom1975; Hill Reference Hill2001) is used with filtered velocity gradients substituted as the leading-order term in the evaluation of velocity increments. Importantly, the result highlights agreement between velocity increment and filtering approaches to the energy cascade, indicating a degree of objectivity to this result (see, e.g. objections in Tsinober Reference Tsinober2009).
The true advantage of the result from Johnson (Reference Johnson2020a), (3.7), lies in the remaining three terms. These cascade rates involve interactions between the strain rate filtered at scale  $\ell$ and velocity gradients at scales smaller than
 $\ell$. They are given a subscript ‘2’ to denote their multiscale nature (specifically, the sum of interactions involving two different scales). First, the cascade rate due to the amplification of small-scale strain by larger-scale strain is
 \begin{equation} \varPi_{s2}^\ell ={-} \bar{S}_{ij}^\ell \int_{0}^{\ell^2} \textrm{d}\alpha \tau_{\beta}( \bar{S}_{jk}^{\sqrt{\alpha}}, \bar{S}_{ki}^{\sqrt{\alpha}} ) ={-} \int_{0}^{\ell^2} \textrm{d}\alpha \bar{S}_{ij}^\ell \tau_{\beta}( \bar{S}_{jk}^{\sqrt{\alpha}}, \bar{S}_{ki}^{\sqrt{\alpha}} ). \end{equation}
For this term,  $\bar {\boldsymbol {S}^\ell }$ represents the strain rate at the filter scale where the cascade rate is evaluated and the generalized second moment of
 $\bar {\boldsymbol {S}}^{\sqrt {\alpha }}$ in the integral represents smaller-scale strain rates being amplified as energy is passed down the cascade. This process may be thought of as a multiscale generalization of figure 2. Thus,
 $\bar{\boldsymbol {S}}^\ell$ amplifies strain rates at all scales
 $\sqrt {\alpha } < \ell$ and the resulting energy cascade rate is constructed by integrating over all smaller scales.
Similarly, the stretching of small-scale vorticity by larger-scale strain is
 \begin{equation} \varPi_{\omega 2}^\ell = \bar{S}_{ij}^\ell \int_{0}^{\ell^2} \textrm{d}\alpha \tau_\beta(\bar{\omega}_i^{\sqrt{\alpha}}, \bar{\omega}_j^{\sqrt{\alpha}}) = \int_{0}^{\ell^2} \textrm{d}\alpha \bar{S}_{ij}^\ell \tau_\beta(\bar{\omega}_i^{\sqrt{\alpha}}, \bar{\omega}_j^{\sqrt{\alpha}}). \end{equation}
In this mechanism, the enstrophy at scales  $\sqrt {\alpha } < \ell$ is amplified as it aligns with extensional strain rates,
 $\boldsymbol {S}^\ell$, organized at larger scales, figure 1. This results in an energy cascade rate across scale
 $\ell$.
Finally, the last term in (3.7) represents the contribution to the energy cascade rate from larger-scale strain rates acting on smaller-scale strain–vorticity covariance,
 \begin{equation} \varPi_{c}^\ell = \varPi_{c2}^\ell = \bar{S}_{ij}^\ell \int_{0}^{\ell^2} \textrm{d}\alpha [ \tau_\beta( \bar{S}_{jk}^{\sqrt{\alpha}}, \bar{\varOmega}_{ki}^{\sqrt{\alpha}} ) - \tau_\beta( \bar{\varOmega}_{jk}^{\sqrt{\alpha}}, \bar{S}_{ki}^{\sqrt{\alpha}} ) ]. \end{equation}
In this final term, the strain rate at scale  $\ell$ amplifies or attenuates the generalized subfilter covariance of strain rate and vorticity at all scales
 $\sqrt {\alpha } < \ell$. This term is given the subscript ‘
 $c$’, denoting it as a cross-term between both strain rate and vorticity. It is the only of the five terms not interpretable as vorticity stretching of strain self-amplification. Its meaning is less obvious, but one potential interpretation is given in § 3.3 while considering the inverse energy cascade in two dimensions.
3.2. Results
Figure 8(a) shows the net contribution of each dynamical mechanism to the cascade rate, as a fraction of the total cascade rate, which is shown figure 5(a). First, the sum of all five contributions is equal to unity, confirming the correctness of (3.7) in a spatially averaged sense. The point-wise accuracy of (3.7) is also confirmed in Appendix A, which also includes a brief study of its accuracy when some terms are neglected.
(a) The mean contribution of each cascade mechanism as a function of filter width. (b) The probability density functions of each component of the energy cascade rate from (3.7) at  $\ell = 46 \eta$. The two vertical grey lines are at
 $2\ell /\eta = 50$ and
 $150$, indicating the approximate inertial range of scales. The integral length scale is at
 $2 L / \eta = 920$.

In the dissipative range,  $\ell \sim \eta$, the three multiscale terms are small and the two single-scale terms comprise the cascade at the specified ratio of
 $3$:
 $1$. In the range of filter widths previously identified as the inertial range,
 $25 < \ell /\eta < 75$ for this simulation, the fractional contribution of each cascade rate is constant, indicating some degree of self-similarity. Each plateau is fitted to two decimal places as reported in the figure. Note that
 $\langle \varPi _c \rangle \approx 0$ so that the other four terms are responsible for establishing the cascade rate.
In the inertial range, the sum of the two single-scale rates account for approximately half of the full cascade rate, with their multiscale analogues accounting for the other half. The amplification of strain rates, both single-scale and multiscale, account for roughly  $5/8$ of the energy cascade rate, with the remaining
 $3/8$ due to vorticity stretching. Interestingly, the strain–vorticity covariance term supplies a negative cascade rate at filter widths corresponding to the spectral bump, offering a potential clue to the dynamical causes of the bottleneck effect. Also, the averages of
 $\varPi _{s2}$ and
 $\varPi _{\omega 2}$ are indistinguishable in figure 8(a). At first glance, it seems there could exist some precise relationship between the two. However, the author was not able to identify any such analytical relationship, and inspection of the numerical values plotted in figure 8(a) suggested that these terms were very close but not exactly equal.
The probability density functions (PDFs) of each contribution to the energy cascade rate from (3.7) are shown in figure 8(b) with filter width in the middle of the inertial range. The total cascade rate PDF is strongly skewed with relatively rare backscatter events. The net backscatter is less than  $2\,\%$ of the total average cascade rate. The single-scale strain self-amplification,
 $\varPi _{s1}$, is also strongly skewed and has the most probable extreme positive events of any of the five components. The single-scale vorticity stretching,
 $\varPi _{\omega 1}$ is much less skewed toward downscale energy cascade. The multiscale strain amplification and vorticity stretching,
 $\varPi _{s2}$ and
 $\varPi _{\omega 2}$, are extremely skewed and almost never negative. Finally, the amplification of subfilter strain–vorticity covariance,
 $\varPi _c$, is relatively symmetric and has the most probable extreme negative events. The PDFs of the energy cascade rates are explored as a function of filter width in Appendix B.
3.3. Implications for the inverse cascade in 2-D turbulence
The main topic of this paper is the energy cascade in 3-D flows. However, it is worthwhile to comment on implications for the inverse cascade of energy in two dimensions. Of the five terms on the right side of (3.7), only the fifth term is non-zero. All vorticity stretching and strain amplification terms vanish exactly in 2-D incompressible flows. Thus
 \begin{equation} \varPi^\ell = \varPi_{c2}^\ell = \bar{S}_{ij}^\ell \int_{0}^{\ell^2} \textrm{d}\alpha [ \tau_\beta( \bar{S}_{jk}^{\sqrt{\alpha}}, \bar{\varOmega}_{ki}^{\sqrt{\alpha}} ) - \tau_\beta( \bar{\varOmega}_{jk}^{\sqrt{\alpha}}, \bar{S}_{ki}^{\sqrt{\alpha}} )]. \end{equation}
Taking the eigenframe of the strain rate at scale  $\ell$,
 \begin{equation} \varPi^\ell(\boldsymbol{x}) = 2 \int_{0}^{\ell^2} \textrm{d}\alpha \iiint \textrm{d}\boldsymbol{r} G_\beta(\boldsymbol{r}) \lambda^\ell(\boldsymbol{x}) \lambda^{\sqrt{\alpha}}(\boldsymbol{x}+\boldsymbol{r}) \bar{\omega}^{\sqrt{\alpha}}(\boldsymbol{x}+\boldsymbol{r}) \sin 2 \phi(\boldsymbol{x},\boldsymbol{r}), \end{equation}
where  $\phi (\boldsymbol {x},\boldsymbol {r})$ is the angle of the eigenvectors of
 $\bar {\boldsymbol {S}}^{\sqrt {\alpha }}(\boldsymbol {x}+\boldsymbol {r})$ with respect to the eigenvectors of
 $\bar {\boldsymbol {S}}^\ell (\boldsymbol {x})$. Here, the eigenvalues of the strain rate are
 $\lambda$ and
 $-\lambda$. If the strain-rate eigenvectors at
 $\ell$ and
 $\sqrt {\alpha }$ align parallel or perpendicular, then there is no transfer of energy. Maximum transfer of energy across scale
 $\ell$ occurs for
 $\pm 45^\text {o}$, with the direction of the transfer also depending on the sign of vorticity. An inverse cascade is supported when smaller-scale strain rate is misaligned with larger-scale strain rate in the opposite rotational direction as the vorticity.
One such (cartoon-ish) scenario is sketched in figure 9. As a clockwise vortex ( ${\omega < 0}$) is subjected to a larger-scale strain rate, it is flattened or thinned into a shear layer with strain-rate eigenvalues at
 $45^\circ$ from the larger-scale strain. The resulting alignment produces a maximum inverse cascade rate. This is the vortex thinning mechanism of the 2-D inverse cascade (Kraichnan Reference Kraichnan1976; Chen et al. Reference Chen, Ecke, Eyink, Rivera, Wan and Xiao2006; Xiao et al. Reference Xiao, Wan, Chen and Eyink2009).
Simplified schematic of the vortex thinning mechanism driving an inverse energy cascade in 2-D turbulence.

Therefore, (3.7) represents a comprehensive view of interscale energy transfer in two- and 3-D turbulence. It is interesting to note (G.L. Eyink, private communication) that this approach may be thought of as a sort of differential renormalization group analysis (Eyink Reference Eyink2018). While vorticity stretching and (to some degree) strain self-amplification are commonly discussed as cascade mechanisms in 3-D turbulence, it should not be a surprise that the vortex thinning mechanism posited for the 2-D inverse cascade is at least a possible mechanism for energy transfer in three dimensions as well. Thus, while (3.7) from Johnson (Reference Johnson2020a) clearly identifies the roles of vorticity stretching and strain self-amplification, it also demonstrates how vortex thinning could be active, even if that activity may be negligible outside a particular range of scales in practice.
In two dimensions  $\varPi _{c2}$ represents the inverse cascade. In the inertial range for 3-D turbulence, this vortex thinning term is evidently small compared with vorticity stretching and strain self-amplification, both of which drive a forward cascade to small scales. However, figure 8(a) also reveals that the vortex thinning term does provide a backscatter contribution for scales in between the viscous and inertial ranges, suggesting that the vortex thinning mechanism is a potential dynamical cause of the bottleneck effect.
4. Efficiency of the energy cascade
The energy cascade rate,  $\varPi ^\ell$, depends on how the eigenvectors of the subfilter stress tensor align with those of the filtered strain-rate tensor (Ballouz & Ouellette Reference Ballouz and Ouellette2020). This may be made explicit by writing the cascade rate in terms of eigenvalues of the filtered strain rate,
 $\lambda _i$, and deviatoric subfilter stress tensor,
 $\mu _j$,
 \begin{equation} \varPi^\ell = \sum_{i=1}^{3} \sum_{j=1}^{3} \lambda_i^\ell \mu_j^\ell \cos^2(\theta_{ij}^\ell). \end{equation}
Here,  $\theta _{ij}$ is the angle between the
 $i$th eigenvector of the filtered strain rate and
 $j$th eigenvector of the subfilter stress tensor. Ballouz & Ouellette (Reference Ballouz and Ouellette2018) defined an energy cascade efficiency as
 \begin{equation} \varGamma_{BO}^\ell = \frac{\varPi^\ell}{\varPi_{max,BO}^\ell},\quad \text{where}\ \varPi_{max,BO}^\ell = \left\{\begin{array}{@{}ll} \lambda_1^\ell \mu_1^\ell + \lambda_2^\ell \mu_2^\ell + \lambda_3^\ell \mu_3^\ell & \varPi^\ell > 0 \\ - (\lambda_1^\ell \mu_3^\ell + \lambda_2^\ell \mu_2^\ell + \lambda_3^\ell \mu_1^\ell ) & \varPi^\ell < 0 \end{array}\right. \end{equation}
is the maximum energy transfer possible for a fixed set of eigenvalues,  $\mu _i$ and
 $\lambda _j$, for
 $\mathring {\boldsymbol {\tau }}^\ell$ and
 $\bar {\boldsymbol {S}}^\ell$, respectively. Perfect alignment between eigenvectors of the
 $\mathring {\boldsymbol {\tau }}^\ell$ and
 $\bar {\boldsymbol {S}}^\ell$ is required for an efficiency of
 $\varGamma ^\ell = 1$. Under this definition, the average cascade efficiency is approximately
 $40\,\%$ for the top-hat filter for filter widths much larger than the Kolmogorov scale (Ballouz, Johnson & Ouellette Reference Ballouz, Johnson and Ouellette2020).
Here, a slightly different definition of efficiency is used,
 \begin{equation} \varGamma^\ell = \frac{\varPi^\ell}{\varPi_{max}^\ell} = \frac{-\mathring{\boldsymbol{\tau}}^\ell : \bar{\boldsymbol{S}}^\ell}{\| \mathring{\boldsymbol{\tau}}^\ell\| \|\bar{\boldsymbol{S}}^\ell \|} = \frac{\displaystyle\sum_{i=1}^{3} \sum_{j=1}^{3} \lambda_i^\ell \mu_j^\ell \cos^2(\theta_{ij}^\ell)}{( {\lambda_1^\ell}^2 + {\lambda_2^\ell}^2 + {\lambda_3^\ell}^2)^{1/2} ( {\mu_1^\ell}^2 + {\mu_2^\ell}^2 + {\mu_3^\ell}^2 )^{1/2}}. \end{equation}
In addition to the re-alignment of eigenvectors, this definition of  $\varPi _{max}^\ell$ in the denominator allows for the ratio of eigenvalues to be rearranged at fixed Frobenius norm to further maximize the flux. Thus, unity efficiency
 $\varGamma ^\ell = 1$ requires not only perfect alignment of (respective) eigenvectors,
 $\cos ^2(\theta _{ij}) = \delta _{ij}$, but also the proportionality of eigenvalues,
 \begin{equation} \frac{\lambda_1}{\mu_1} = \frac{\lambda_2}{\mu_2} = \frac{\lambda_3}{\mu_3}. \end{equation}
If follows that
 \begin{equation} \varPi_{max}^\ell \geq \varPi_{BO\,max}^\ell, \quad \text{therefore}\ \varGamma^\ell \leq \varGamma_{BO}^\ell. \end{equation}
It is important that  $\mathring {\boldsymbol {\tau }}$ is the deviatoric part of the sub-filter stress when constructing the denominator of (4.3). This is significant because the inclusion of the isotropic part of the sub-filter stress would increase its norm without increasing the maximum potential value of its contraction with the deviatoric strain-rate tensor.
Phrasing  $\varPi ^\ell$ in terms of vorticity stretching and strain self-amplification, (3.7)–(3.12), allows for defining the efficiency of each dynamical mechanism in transferring energy downscale. Each component of
 $\varPi ^\ell$ can be written as an inner product of
 $\bar {\boldsymbol {S}}^\ell$ with a component of the subfilter stress tensor. For example, the deviatoric part of the sub-filter stress due to single-scale strain self-amplification is
 \begin{equation} (\mathring{\boldsymbol{\tau}}_{s1}^\ell)_{ij} = \ell^2 ( \bar{S}_{ik}^\ell \bar{S}_{jk}^\ell - \tfrac{1}{3} \|\bar{\boldsymbol{S}}^\ell\|^2 \delta_{ij}). \end{equation}
The efficiency of the strain self-amplification,  $\varPi _{s1}$, in the downscale transfer of energy is
 \begin{equation} \varGamma_{s1}^\ell = \frac{-\mathring{\boldsymbol{\tau}}_{s1}^\ell:\bar{\boldsymbol{S}}^\ell}{\| \mathring{\boldsymbol{\tau}}_{s1}^\ell \|\| \bar{\boldsymbol{S}}^\ell \|} = \frac{\sqrt{6} ~\varPi_{s1}^\ell}{\ell^2 \| \bar{\boldsymbol{S}}^\ell \|^3} = \frac{-\sqrt{6} ~\bar{S}_{ij}^\ell\bar{S}_{jk}^\ell\bar{S}_{ki}^\ell}{\| \bar{\boldsymbol{S}}^\ell \|^3} = \frac{- 3 \sqrt{6} ~\lambda_1^\ell \lambda_2^\ell \lambda_3^\ell}{( {\lambda_1^\ell}^2 + {\lambda_2^\ell}^2 + {\lambda_3^\ell}^2 )^{3/2}}, \end{equation}
which the reader may recognize as the  $s^*$ parameter of Lund & Rogers (Reference Lund and Rogers1994) applied to the filtered strain-rate tensor. Thus, the strong bias of turbulence toward
 $\lambda _{2}^\ell > 0$ manifests as a bias toward positive efficiency of downscale energy flux. In fact, the PDF of
 $s^*$ has been consistently shown to peak at
 $s^* = 1$ (
 $\varGamma _{s1} = 1$), i.e.
 $\lambda _{1}^\ell = \lambda _{2}^\ell = -\frac {1}{2}\lambda _{3}^\ell$. When this is true, there is one eigenvector along which the flow is strongly squeezing, with weaker stretching occurring along perpendicular directions. In the opposite case,
 $\varGamma _{s1}^\ell = -1$, there is strong stretching along one eigenvector and weaker squeezing along perpendicular directions, i.e.
 $\frac {1}{2}\lambda _1^\ell = - \lambda _2^\ell = -\lambda _3^\ell$. This situation corresponds to maximum efficiency in reverse (upscale) energy transfer and is relatively rare in turbulent flows.
Note that use of the Ballouz–Ouellette efficiency, i.e. not allowing for re-arranging of eigenvalue ratios when constructing the maximum potential flux, would result in a unity efficiency for the resolved strain self-amplification. The reason for this is that  $\mathring {\boldsymbol {\tau }}_{s1}^\ell$ is, by definition, always perfectly aligned with
 $\bar {\boldsymbol {S}}^\ell$ so that the cascade rate by this mechanism is only a function of the eigenvalues. This consideration was part of the reasoning motivating the definition of efficiency used here.
Another reason to use (4.3) rather than (4.2) is that the former provides a stricter test of whether the subfilter stress conforms to the eddy viscosity hypothesis,  $\mathring {\tau }_{ij}^\ell = - 2 \nu _t \bar {S}_{ij}^\ell$. The eddy viscosity ansatz asserts that the subfilter stress not only aligns its eigenvectors with those of the filtered strain-rate tensor, but also that their eigenvalues are proportional. Thus, with the present definition of efficiency,
 \begin{equation} \varGamma^\ell = \left\{ \begin{array}{@{}ll} 1, & \text{eddy viscosity (downscale cascade)} \\ 0, & \text{zero cascade rate} \\ -1, & \text{negative eddy viscosity (inverse cascade)} \end{array} \right., \end{equation}
which can be applied individually to each term in (3.7) to test the extent to which each cascade mechanism may be accurately modelled by an eddy viscosity.
Unlike the strain self-amplification, vorticity stretching suffers from eigenvector misalignment in addition to non-optimal eigenvalue ratios. The efficiency of the energy cascade due to single-scale vorticity stretching is
 \begin{equation} \varGamma_{\omega 1}^\ell = \frac{-\mathring{\boldsymbol{\tau}}_{\omega 1}^\ell:\bar{\boldsymbol{S}}^\ell}{\| \mathring{\boldsymbol{\tau}}_{\omega 1}^\ell \|\| \bar{\boldsymbol{S}}^\ell \|} = \frac{\sqrt{6} \varPi_{\omega 1}^\ell}{\ell^2 \|\bar{\boldsymbol{\varOmega}}^\ell \|^2 \| \bar{\boldsymbol{S}}^\ell \|} = \frac{\sqrt{6} \bar{\omega}_i^\ell \bar{\omega}_j^\ell \bar{S}_{ij}^\ell }{2 |\bar{\boldsymbol{\omega}}^\ell |^2 \| \bar{\boldsymbol{S}}^\ell \|} = \frac{\sqrt{6} \displaystyle\sum_{i=1}^{3}\lambda_i^\ell \cos^2(\theta_{\omega,i}^\ell) }{2 ( {\lambda_1^\ell}^2 + {\lambda_2^\ell}^2 + {\lambda_3^\ell}^2)^{1/2}}, \end{equation}
where
 \begin{equation} (\mathring{\boldsymbol{\tau}}_{\omega 1}^\ell)_{ij} = \ell^2 ( \bar{\varOmega}_{ik}^\ell \bar{\varOmega}_{jk}^\ell - \tfrac{1}{3} \|\bar{\boldsymbol{\varOmega}}^\ell\|^2 \delta_{ij}) ={-}\tfrac{1}{4}\ell^2 ( \bar{\omega}_i^\ell \bar{\omega}_j^\ell - \tfrac{1}{3} |\bar{\boldsymbol{\omega}}^\ell|^2 \delta_{ij} ). \end{equation}
This efficiency is maximum,  $\varGamma _{\omega 1}^\ell = 1$, when two conditions are satisfied. First, the vorticity is perfectly aligned with the maximum eigenvalue,
 $\cos (\theta _{\omega ,i}^\ell ) = \delta _{i1}$. Second, the strain-rate tensor must have the configuration
 $\frac {1}{2}\lambda _1^\ell = - \lambda _2 = -\lambda _3$ so that the magnitude of the stretching is maximized. Note that the condition for maximum vorticity stretching efficiency is that of
 $\varGamma _{s1}^\ell = -1$. When
 $\varGamma _{s1} = 1$, the maximum efficiency of vorticity stretching is limited,
 $-1 \leq \varGamma _{\omega 1} \leq 0.5$. Therefore, the chaos of turbulent dynamics aside, the efficiencies of strain-rate self-amplification and vorticity stretching cannot be simultaneously maximum. In fact, the asymptotic behaviour of solutions to the restricted Euler equation as they approach the finite-time singularity is
 $\varGamma _{s1}^\ell = 1$ and
 $\varGamma _{\omega 1}^\ell = 0.5$.
The efficiencies for the multiscale terms are similarly defined and interpreted,
 \begin{equation} \varGamma_{s2}^\ell = \frac{-\mathring{\boldsymbol{\tau}}_{s2}^\ell:\bar{\boldsymbol{S}}^\ell}{\| \mathring{\boldsymbol{\tau}}_{s2}^\ell \|\| \bar{\boldsymbol{S}}^\ell \|}, \quad \varGamma_{\omega 2} = \frac{-\mathring{\boldsymbol{\tau}}_{\omega 2}^\ell:\bar{\boldsymbol{S}}^\ell}{\| \mathring{\boldsymbol{\tau}}_{\omega 2}^\ell \|\| \bar{\boldsymbol{S}}^\ell \|}, \quad \varGamma_{c}^\ell = \frac{-\mathring{\boldsymbol{\tau}}_{c}^\ell:\bar{\boldsymbol{S}}^\ell}{\| \mathring{\boldsymbol{\tau}}_{c}^\ell \|\| \bar{\boldsymbol{S}}^\ell \|}. \end{equation}
In terms of filtered strain-rate eigenvalues,  $\lambda _i^\ell$, subfilter stress eigenvalues,
 $\mu _{x,j}$, and eigenvector alignment angles,
 $\theta _{x,ij}$, the efficiencies of the multiscale cascade rates are
 \begin{equation} \varGamma_{x}^\ell = \frac{\displaystyle\sum_{i=1}^{3} \sum_{j=1}^{3} \lambda_i^\ell \mu_{x,j}^\ell \cos^2(\theta_{x,ij}^\ell)}{( {\lambda_1^\ell}^2 + {\lambda_2^\ell}^2 + {\lambda_3^\ell}^2)^{1/2} ( {\mu_{x,1}^\ell}^2 + {\mu_{x,2}^\ell}^2 + {\mu_{x,3}^\ell}^2)^{1/2}}, \quad \text{where} \ x = s2, \omega 2, c. \end{equation}
The average cascade efficiencies from DNS of HIT are shown in figure 10(a) as a function of filter width. At a filter width chosen in the middle of the inertial range,  $\ell = 46\eta$, the PDF of each term is also shown in figure 10(b). The overall cascade efficiency is less than
 $25\,\%$ in the viscous range and grows above
 $40\,\%$ in the inertial range. The overall efficiency based the Ballouz–Ouellette definition is only slightly larger than the present one. The PDF of the total cascade rate peaks near 50 %, and negative efficiencies below
 $-$50 % extremely rare. Indeed, the eddy viscosity approximation for subfilter stresses lacks a high degree physical fidelity in general.
Cascade efficiencies for each term in (3.7): (a) average efficiency as a function of filter width and (b) PDF of efficiency at  $\ell = 46\eta$. The dashed line shows the Ballouz–Ouellette efficiency.

The single-scale terms,  $\varPi _{s1}$ and
 $\varPi _{\omega 1}$, are less efficient than the total subfilter activity in supporting a downscale cascade in the inertial range. In fact, their efficiency is relatively constant as a function of scale from the viscous range through the inertial range. The strain self-amplification efficiency PDF peaks at
 $\varGamma _{s1}^\ell = 1$, but also allows for substantial negative efficiencies. Meanwhile, the most commonly observed efficiency for single-scale vorticity stretching is slightly less than
 $50\,\%$, but negative efficiencies for this mechanism are also not particularly rare. Thus, the signature of restricted Euler dynamics is observed in the location of the efficiency PDF peaks, namely, at
 $\varGamma _{s1}^\ell = 1$ and
 $\varGamma _{\omega 1}^\ell = 0.5$. Nevertheless, the mean efficiency is quite low due to the fluctuations.
In contrast, the three multiscale processes have more sharply peaked efficiency PDFs. Multiscale vorticity stretching and strain self-amplification show a strong tendency toward eddy viscosity-like behaviours, with mean efficiencies near  $70\,\%$ and
 $75\,\%$, respectively, in the inertial range. Indeed these terms rarely generate backscatter, and when they do, it is inefficient in alignment. While the restricted Euler dynamics may be invoked for the single-scale terms, the smaller-scale strain rates and vorticities comprising
 $\mathring {\boldsymbol {\tau }}_{s2}^\ell$ and
 $\mathring {\boldsymbol {\tau }}_{\omega 2}^\ell$ evolve on faster time scales compared with
 $\bar {\boldsymbol {S}}^\ell$, coming closer to satisfying conditions of scale separation that leads to eddy viscosity physics. It is known, for example, that finer-scale vorticity aligns more readily with the strongest extensional direction of a larger-scale strain rate (Leung et al. Reference Leung, Swaminathan and Davidson2012; Fiscaletti et al. Reference Fiscaletti, Elsinga, Attili, Bisetti and Buxton2016), which is physically related to the time lag in alignment elucidated by Xu, Pumir & Bodenschatz (Reference Xu, Pumir and Bodenschatz2011). The Lagrangian behaviour of these terms deserves further consideration in future work.
The PDF of the strain–vorticity covariance term,  $\varPi _c$, is also strongly peaked. Unlike the vorticity stretching and strain self-amplification terms, the most common value of
 $\varPi _c$ is zero. The PDF is symmetric and the mean value is very small throughout the inertial range. While it is does not appear correlated with
 $\bar {\boldsymbol {S}}^\ell$, it is not known whether
 $\mathring {\boldsymbol {\tau }}_{c2}$ is strongly correlated with other quantities filtered at scale
 $\ell$ to facilitate LES modelling of this term.
5. Scale locality of the energy cascade
It has been presumed in the discussion so far that the interscale energy transfer in turbulence may be faithfully characterized as a cascade. However, it is useful to leverage the present developments to examine the scale locality of energy transfer. A distinct advantage of (3.7) is that its formulation allows this question to be addressed in the context of vorticity stretching and strain self-amplification mechanisms.
Scale locality of the cascade can be quantified by computing the energy transfer across scale  $\ell$ that remains resolved when the velocity field is filtered at scale
 $0 \leq \ell ^\prime \leq \ell$, here denoted
 $\varPi ^{\ell ,\ell ^\prime }$. That is, the energy cascade rate at
 $\ell$ is computed in the artificial absence of any motions smaller than scale
 $\ell ^\prime$. When
 $\ell ^\prime = 0$, it is trivial that
 $100\,\%$ of the interscale energy transfer will be resolved,
 $\varPi ^{\ell ,0} = \varPi ^\ell$. On the other hand, if
 $\ell ^\prime = \ell$, then the resolved energy transfer is
 $\varPi ^{\ell ,\ell ^\prime } = \varPi _{s1}^\ell + \varPi _{\omega 1}^\ell$. It is evident from figure 8(a) that this accounts for roughly
 $50\,\%$ of the total
 $\langle \varPi ^\ell \rangle$. The question of scale locality, then, is how quickly
 $\varPi ^{\ell ,\ell ^\prime }$ approaches
 $\varPi ^\ell$ when
 $\ell ^\prime$ is decreased below
 $\ell$.
First, a brief mathematical development is presented to generate the expressions needed to quantitatively evaluate the question of scale locality outlined in words in the previous paragraph. Given (3.4), the sub-filter stress tensor may be written as
 \begin{equation} \tau_\ell(u_i, u_j) = \int_{0}^{\ell^2} \textrm{d}\alpha \overline{\bar{A}_{ik}^{\sqrt{\alpha}} \bar{A}_{jk}^{\sqrt{\alpha}}}^\beta, \end{equation}
where  $\beta = \sqrt {\ell ^2 - \alpha }$. Supposing the velocity field was known only to resolution
 $0 \leq \ell ^\prime \leq \ell$, then the resolved amount of sub-filter stress would be
 \begin{equation} \tau_{\ell,\ell^\prime}(u_i, u_j) = \int_{{\ell^\prime}^2}^{\ell^2} \textrm{d}\alpha \overline{\bar{A}_{ik}^{\sqrt{\alpha}} \bar{A}_{jk}^{\sqrt{\alpha}}}^\beta + \int_{0}^{{\ell^\prime}^2} \textrm{d}\alpha \overline{\bar{A}_{ik}^{\ell^\prime} \bar{A}_{jk}^{\ell^\prime}}^{\sqrt{\ell^2 - {\ell^\prime}^2}}, \end{equation}
because, for  $\alpha < {\ell ^\prime }^2$, the integrand is not fully known and the velocity gradients filtered at scale
 $\sqrt {\alpha }$ can at best be approximated by the velocity gradients filtered at scale
 $\ell ^\prime$. Subtracting (5.2) from (5.1) results in an equation for the unresolved sub-filter stress,
 \begin{equation} \tau_{\ell}(u_i, u_j) - \tau_{\ell,\ell^\prime}(u_i, u_j) = \int_{0}^{{\ell^\prime}^2} \textrm{d}\alpha \overline{ \tau_{\beta^\prime}( \bar{A}_{ik}^{\sqrt{\alpha}}, \bar{A}_{jk}^{\sqrt{\alpha}}) }^{\sqrt{\ell^2 - {\ell^\prime}^2}}, \end{equation}
where  $\beta ^\prime = \sqrt {{\ell ^\prime }^2 - \alpha }$. Contracting (5.3) with the filtered strain-rate tensor,
 $\bar {\boldsymbol {S}}^\ell$, defines the unresolved portion of
 $\varPi ^\ell$ for a velocity field filtered at scale
 $\ell ^\prime$. Figure 11(a) shows this quantity computed from DNS results. The top curve shows the result for
 $\ell ^\prime = \ell$. It is evident that the interscale transfer has at least some degree of locality, because these curves drop steeply from their originating points on the black
 $\ell ^\prime = \ell$ curve.
(a) Per cent of unresolved cascade rate when the velocity field is filtered at scale  $\ell ^\prime \leq \ell$, for various
 $\ell$. Top (black) curve indicates results for
 $\ell ^\prime = \ell$. The (coloured) curves emanating downward from the top curve show results for
 $\ell ^\prime < \ell$, each curve representing a different fixed value of
 $\ell$ (the value at which it intersects the black curve). (b) The same results (with same corresponding colours) plotted log–log as a function of
 $\ell ^\prime /\ell$, each curve again representing a different fixed value of
 $\ell$. The dashed line indicates the theoretical power-law exponent of
 $4/3$.

Following Eyink (Reference Eyink2005), a power-law relation may be expected,
 \begin{equation} \chi^{\ell,\ell^\prime} = \frac{\langle \varPi^\ell - \varPi^{\ell,\ell^\prime} \rangle}{\langle \varPi^\ell \rangle} \sim \left( \frac{\ell^\prime}{\ell} \right)^p. \end{equation}
The exponent  $p$ quantifies the extent of scale locality. A steeper power law means a higher degree of scale-local dominance and more adherence to cascade-like behaviour. A log–log plot of the unresolved component of interscale energy transfer is shown in figure 11(b). For large enough
 $\ell$ and
 $\ell ^\prime$, the curves appear to collapse as would be a good indicator of scale-invariant behaviour. Furthermore, the power-law curve fit produces an exponent near
 $1.1$ for the overlapping region of the orange-ish curves. This deviates some from the theoretical prediction of
 $4/3$, though it is certainly steeper than a
 $2/3$ power law which would result from perfect correlation across scales (Eyink Reference Eyink2005; Eyink & Aluie Reference Eyink and Aluie2009). This result suggests that current theories may over-estimate the de-correlation effect. A more precise estimate of this power law requires higher resolution DNS.
The current formulation allows us to follow this line of investigation further. Specifically, the above decomposition into resolved and unresolved components of the interscale energy transfer may be performed separately for strain self-amplification and vorticity stretching. Mathematically, this is done by replacing the full velocity gradient tensor in (5.1)–(5.3) with either its symmetric or anti-symmetric part,
 \begin{equation} \chi_s^{\ell,\ell^\prime} = \frac{\langle \varPi_s^\ell - \varPi_s^{\ell,\ell^\prime} \rangle}{\langle \varPi_s^\ell \rangle}, \quad \chi_\omega^{\ell,\ell^\prime} = \frac{\langle \varPi_\omega^\ell - \varPi_\omega^{\ell,\ell^\prime} \rangle}{\langle \varPi_\omega^\ell \rangle}. \end{equation}
The results for strain self-amplification and vorticity stretching are qualitatively similar to figure 11(a). In figure 12, each of these two are shown on a log–log plot vs  $\ell ^\prime / \ell$. Similar collapse into power-law behaviour is seen. This indicates that strain self-amplification and vorticity stretching have very similar scale-locality properties when it comes to their contributions to the energy cascade, each one very similar to the
 $p \approx 1.1$ behaviour of the total cascade rate.
Per cent of (a)  $\langle \varPi _s^\ell \rangle = \langle \varPi _{s1}^\ell + \varPi _{s2}^\ell \rangle$ and (b)
 $\langle \varPi _\omega ^\ell \rangle = \langle \varPi _{\omega 1}^\ell + \varPi _{\omega 2}^\ell \rangle$ unresolved by velocity field filtered at scale
 $\ell ^\prime \leq \ell$ plotted log–log against
 $\ell ^\prime /\ell$, as in figure 11(b). The dashed lines indicates a power-law exponent of
 $4/3$. The value of
 $\ell$ corresponding to each colour is the same as in figure 11.

To further explore the observed discrepancy with theoretical predictions, the efficiency of the unresolved subfilter stress is computed as a function of  $\ell ^\prime$ for each filter width
 $\ell$. This decomposes the decay of the unresolved portion of
 $\varPi$ to be split into decreasing magnitude and de-correlation with
 $\boldsymbol {\bar {S}}^\ell$. The theory predicts a power-law decay of
 $2/3$ for each. To fully accomplish this, a slightly altered definition of efficiency is needed. In particular, to measure the de-correlation effect, the denominator of efficiency should use the trace of the unresolved subfilter stress tensor rather than the norm of its deviatoric part,
 \begin{equation} \varGamma_{s,tr}^{\ell,\ell^\prime} = \frac{-( \boldsymbol{\tau}_s^\ell - \boldsymbol{\tau}_s^{\ell,\ell^\prime} ) : \bar{\boldsymbol{S}}^\ell}{\text{tr}( \boldsymbol{\tau}_s^\ell - \boldsymbol{\tau}_s^{\ell,\ell^\prime}) \|\bar{\boldsymbol{S}}^\ell \|}, \quad \varGamma_{\omega,tr}^{\ell,\ell^\prime} = \frac{-( \boldsymbol{\tau}_\omega^\ell - \boldsymbol{\tau}_\omega^{\ell,\ell^\prime} ) : \bar{\boldsymbol{S}}^\ell}{\text{tr}( \boldsymbol{\tau}_\omega^\ell - \boldsymbol{\tau}_\omega^{\ell,\ell^\prime}) \|\bar{\boldsymbol{S}}^\ell \|}. \end{equation}
Indeed, a perfectly decorrelated stress tensor in the physical sense could be an isotropic tensor. In other words, it is not desired to measure the extent to which the deviations from an isotropic tensor align with the filtered strain rate, but rather, how much energy transfer is occurring for a given level of subfilter activity.
The results are shown in figure 13. Panels (a,b) show the decay of the unresolved trace for strain-rate amplification and vorticity stretching,
 \begin{equation} \chi_{s,tr}^{\ell,\ell^\prime} = \frac{\text{tr}( \boldsymbol{\tau}_s^\ell - \boldsymbol{\tau}_s^{\ell,\ell^\prime})}{\text{tr}( \boldsymbol{\tau}_s^\ell)}, \quad \chi_{\omega,tr}^{\ell,\ell^\prime} = \frac{\text{tr}( \boldsymbol{\tau}_\omega^\ell - \boldsymbol{\tau}_\omega^{\ell,\ell^\prime})}{\text{tr}( \boldsymbol{\tau}_\omega^\ell)}. \end{equation}
Below these, the respective decay of efficiency is shown, (5.6a,b). Panels (c,d) show the same results for vorticity stretching. For both mechanisms, the  $2/3$ power law is observed for the trace but the efficiency decays more slowly than predicted by theory. However, the results suggest that the decorrelation (efficiency decay) becomes steeper as
 $\ell$ increases. It is plausible, then, that a simulation with a significantly higher Reynolds number may produce results in better agreement with theory at sufficiently large
 $\ell /\eta$. At the very least, the present results do no rule out that possibility. It is worth noting that Domaradzki et al. (Reference Domaradzki, Teaca and Carati2009) observed results consistent with
 $p = 4/3$ using a Fourier decomposition, but also had technical difficulties due to finite Reynolds number DNS.
Trace of the subfilter stress tensor at scale  $\ell$ remaining unresolved at scale
 $\ell ^\prime$, as a function of
 $\ell ^\prime / \ell$ for various values of
 $0.9\eta \leq \ell \leq 170\eta$: (a) unresolved strain-rate component, (b) unresolved vorticity component. Also, trace-based cascade efficiency of the unresolved subfilter stress: (c) unresolved strain-rate component, (d) unresolved vorticity component. The value of
 $\ell$ corresponding to each colour is the same as in figure 11.

6. Conclusion
In this paper, the exact relationship introduced by Johnson (Reference Johnson2020a) is exploited to discern the role of strain-rate amplification and vorticity stretching in transferring kinetic energy from large to small scales in turbulent flows. About half of the net energy cascade rate is proportional to velocity gradient production rates. These rates, which can be described as vorticity stretching and strain self-amplification of the filtered field, have important statistical biases which contain the signature of the restricted Euler dynamics. For instance, the tendency toward a strain-rate eigenvalue state or  $\lambda _1 = \lambda _2 = -\tfrac {1}{2}\lambda _3$ makes strain self-amplification more efficient at driving the cascade while limiting the efficiency of vorticity stretching. Indeed, the efficiency PDFs indicate a tendency of turbulent dynamics to favour restricted Euler-like alignments. However, the pressure is also evidently important in determining average cascade rates. The pressure imposes the divergence-free condition,
 $\boldsymbol {\nabla }\boldsymbol {\cdot }\boldsymbol {u}$, one consequence of which is the three-to-one ratio between average strain self-amplification and vorticity stretching rates. Thus, both the autonomous dynamics of the velocity gradient and the non-local action of the pressure favour energy cascade via strain self-amplification over vortex stretching, in terms of efficiency and average rate, respectively. This work joins Carbone & Bragg (Reference Carbone and Bragg2020) and Vela-Martín & Jiménez (Reference Vela-Martín and Jiménez2021) in highlighting the crucial role of strain-rate self-amplification in the energy cascade, calling into question the classical emphasis on vorticity stretching (Taylor Reference Taylor1938; Onsager Reference Onsager1949).
Note that this conclusion about the relative contributions is for the average cascade rate and does not contradict the observation by others that vorticity stretching is more influential in generating extreme events in turbulent flows (Buaria et al. Reference Buaria, Pumir, Bodenschatz and Yeung2019; Carbone & Bragg Reference Carbone and Bragg2020). Another point of nuance not yet pursued is a possible subtle difference between vortex stretching and vorticity stretching. Indeed, regions of strong vorticity are often positioned close to regions of strong strain (Vlaykov & Wilczek Reference Vlaykov and Wilczek2019), so that the stretching of a vortex, if more broadly conceived of as the evolution of a flow structure that also includes regions of higher strain rate, may include the strain self-amplification as defined mathematically in this paper. In general, further investigation of the Johnson (Reference Johnson2020a) formulation in terms of spatially coherent structures would be insightful (Dong et al. Reference Dong, Huang, Yuan and Lozano-Durán2020).
A significant advantage of the formulation from Johnson (Reference Johnson2020a) is the ability to write the remainder of the energy cascade rate in terms of multiscale vorticity stretching and strain-rate amplification mechanisms. It is shown in this paper that the stretching of smaller-scale vorticity and the amplification of smaller-scale strain rate by larger-scale strain rate is responsible for the other half of the energy cascade rate. These subfilter stress components are more efficiently aligned with the filtered strain-rate tensor, proving to be better approximated using an eddy viscosity. The net contribution of multiscale interactions decreases with scale separation as a power law, in close agreement to theoretical  $4/3$ power-law predictions for the scale locality of interscale energy transfer. This is true for both strain self-amplification and vorticity stretching mechanisms. Note that this is still not a particularly strong degree of locality, especially when compared with, e.g. the bubble breakup cascade in two-phase turbulent flows, where a much steeper power law is predicted and observed (Chan, Johnson & Moin Reference Chan, Johnson and Moin2020a; Chan et al. Reference Chan, Johnson, Moin and Urzay2020b).
Finally, a third cascade mechanism is explored, namely, the distortion of small-scale strain–vorticity covariance by the larger-scale strain rate. While the net contribution of this term is negligible in the inertial range of 3-D turbulence, it has noticeable effects elsewhere. In two dimensions, it is the only possible mechanism, because both strain-rate amplification and vorticity stretching vanish exactly. This mechanism is responsible for the inverse cascade in two dimensions. It is argued, following Chen et al. (Reference Chen, Ecke, Eyink, Rivera, Wan and Xiao2006) and Xiao et al. (Reference Xiao, Wan, Chen and Eyink2009), that this term may be interpreted as a vortex thinning mechanism (Kraichnan Reference Kraichnan1976). Furthermore, in three dimensions, the strain–vorticity correlation drives net backscatter opposing strain self-amplification and vorticity stretching for a range of filter width between viscous and inertial scales. This is the range of scales where the so-called spectral bump occurs, advancing vortex thinning as a candidate mechanism for what causes the bottleneck effect in three dimensions.
Velocity increments and structure functions have featured heavily in turbulence theory. No doubt, the ease of measurement using hot-wire anemometry (provided one may assume Taylor's hypothesis) has fuelled the use of such two-point statistics. Filtered velocity gradients naturally encompass the information contained in velocity increments and similarly enable a scale-by-scale investigation of turbulent flows. The advantage of filtered velocity gradients is the ability to distinguish solid-body rotation from fluid deformation organized at scales much larger than  $\eta$. Writing interscale energy transfer in terms of filtered velocity gradients not only connects with (and expands upon) classical cascade descriptions in terms of vorticity stretching, but also leverages the insights of the restricted Euler equation. A natural connection emerges between turbulence theory and modelling for LES, a tool of increasing practical importance in the age of supercomputing.
Acknowledgements
A. Elnahhas is acknowledged for providing helpful feedback on an initial draft of this manuscript. The author benefited from discussions on this topic with a number of colleagues, in alphabetical order by last name: J. Ballouz, A. Bragg, J. Cardesa, G. Eyink, S. Lele, A. Lozano-Duran, P. Moin, N. Ouellette and I. Paul.
Funding
This work was supported in part by the Advanced Simulation and Computing program of the U.S. Department of Energy's National Nuclear Security Administration via the PSAAP-II Grant no. DE-NA0002373.
Declaration of interests
The author reports no conflict of interest.
Appendix A. Relative importance of the small-scale strain–vorticity covariance
In (3.7), the first two terms,  $\mathring {\boldsymbol {\tau }}_{s1}$ and
 $\mathring {\boldsymbol {\tau }}_{\omega 1}$, are resolved at scale
 $\ell$. Therefore, in theory, these two need no approximate modelling for LES. The third and fourth terms,
 $\mathring {\boldsymbol {\tau }}_{s2}$ and
 $\mathring {\boldsymbol {\tau }}_{\omega 2}$, have been shown to be better approximated by an eddy viscosity, figure 10. The fifth term, which may be thought of as a vortex thinning term,
 $\mathring {\boldsymbol {\tau }}_{c2}$, is not so easily modelled. The simplest model would be to ignore its contribution, which is close to zero in the mean within the inertial range of scales.
A preliminary a priori study of the effects of neglecting some of the terms in (3.7) is shown in figure 14. As previously shown by Borue & Orszag (Reference Borue and Orszag1998), the correlation coefficient of the tensor diffusivity model,  $\varPi \approx \varPi _{s1} + \varPi _{\omega 1}$, is quite good, near
 $0.9$ in the inertial range. The normalized mean square error,
 $R^2$, is around 0.75. When the multiscale vorticity stretching and strain self-amplification terms are added as well,
 $\varPi \approx \varPi _{s1} + \varPi _{\omega 1} + \varPi _{s2} + \varPi _{\omega 2}$, the correlation coefficient exceeds
 $0.95$ and the
 $R^2$ value also significantly improves. This observation provides evidence that (3.7) is a meaningful decomposition of the energy cascade rate, because the accuracy of the sum improves as more terms are included. The correlation coefficients and
 $R^2$ values are perfect,
 $1.0$, when all five terms are included in the sum, reflecting the exact nature of (3.7) on a point-wise basis. This point-wise verification was also performed for the full tensor, (3.4), with relative errors comparable to machine precision. There is also some error associated with the trapezoidal rule integration, though this component of the error is made small through refinement of
 $\Delta \alpha$.
Correlation coefficient (a) and mean square error (b) for complete and incomplete sums of the cascade mechanisms.

Appendix B. Cascade rate and efficiency PDFs as a function of scale
The mean cascade rate,  $\varPi ^\ell$, and cascade efficiency,
 $\varGamma ^\ell$, were shown as a function of
 $\ell / \eta$ in figures 8(a) and 10(a), respectively. In the inertial range,
 $50 \lessapprox 2\ell /\eta \lessapprox 150$, these mean quantities were relatively flat indicating some degree of scale similarity. Alongside these mean values, figures 8(b) and 10(b) show the PDFs for cascade rate and efficiency at a single filter width in the middle of the inertial range,
 $2\ell /\eta \approx 92$. In this Appendix, more plots are included to explore the dependence of the PDFs on the filter width.
Figure 15(a) shows the PDFs for the total cascade efficiency for six different filter widths. The remaining five panels, figure 15(b–f), show the cascade efficiency PDFs for each of the five terms on the right side of (3.7). The largest three filter widths shown are in the approximate inertial range and their PDFs are remarkably similar. Some minor deviation is observed for  $2\ell /\eta = 54$ at the lower end of the inertial range. This observation further supports the identification of inertial range scales in the simulation.
PDFs for the cascade efficiencies at various filter widths: (a) total cascade efficiency, (b) strain–vorticity covariance amplification, (c) single-scale strain-rate self-amplification, (d) single-scale vorticity stretching, (e) multiscale strain-rate amplification and (f) multiscale vorticity stretching.

Further, the efficiency PDFs of the two single-scale cascade mechanisms,  $\varGamma _{s1}$ and
 $\varGamma _{\omega 1}$, show little variation between inertial and viscous range filter widths. The reason for this is the similarity in velocity gradient tensor tendencies regardless of filter scale. The second derivative of the subfilter stress tensor, being the dynamical difference between velocity gradients filtered at different scales, evidently does not play a major role in altering these efficiencies. In contrast, the three multiscale contributions to the cascade have significantly different PDFs in the viscous range than observed at larger filter widths.
While similarity is clearly observed in the inertial range for the efficiency PDFs, the same cannot be said of the cascade rates themselves, figure 16. As the energy cascade progresses to smaller scales, the phenomenon of intermittency manifests in increasingly heavy-tailed distributions of the cascade rate. This is true for the total cascade rate as well as each of the five different contributions on the right side of (3.7). Within the viscous range, the PDFs do start to collapse to some extent, but less so for the multiscale rates. However, the decrease in available active subfilter scales easily explains this fact.
PDFs for the cascades rates at various filter widths: (a) total cascade efficiency, (b) strain–vorticity covariance amplification, (c) single-scale strain-rate self-amplification, (d) single-scale vorticity stretching, (e) multiscale strain-rate amplification and (f) multiscale vorticity stretching. The legend from figure 15 also applies here.

Appendix C. Detailed derivation of energy cascade rate for Gaussian filters
For any field variable,  $a(\boldsymbol {x})$, with Fourier transform,
 $\mathcal {F}\{a\}(\boldsymbol {k})$, the Gaussian filtered field is
 \begin{equation} \mathcal{F}\{\bar{a}^{\ell}\}(\boldsymbol{k}) = \exp( -\tfrac{1}{2} k^2 \ell^2) \mathcal{F}\{a\}(\boldsymbol{k}), \end{equation}
which by substitution is seen to satisfy
 \begin{equation} \frac{\partial \mathcal{F}\{\bar{a}^{\ell}\}}{\partial (\ell^2)} ={-} \frac{1}{2} k^2 \mathcal{F}\{\bar{a}^{\ell}\}. \end{equation}
This equation is the Fourier transform of
 \begin{equation} \frac{\partial \bar{a}^\ell}{\partial (\ell^2)} = \frac{1}{2}\nabla^2 \bar{a}^\ell \end{equation}
and the initial condition,  $\bar {a}^{\ell =0}(\boldsymbol {x}) = a(\boldsymbol {x})$, is satisfied.
Now the generalized second moment of two fields,  $a(\boldsymbol {x})$ and
 $b(\boldsymbol {x})$ may be written as
 \begin{equation} \tau_\ell(a, b) = \overline{a b}^\ell - \bar{a}^\ell \bar{b}^\ell \end{equation}
and its derivative with  $\ell ^2$ is
 \begin{equation} \frac{\partial \tau_\ell(a,b)}{\partial (\ell^2)} = \frac{\partial \overline{a b}^\ell}{\partial (\ell^2)} - \left( \bar{a}^\ell \frac{\partial \bar{b}^\ell}{\partial (\ell^2)} + \bar{b}^\ell \frac{\partial \bar{a}^\ell}{\partial (\ell^2)} \right). \end{equation}
Now substituting (C3) for all three derivatives in  $\ell ^2$ on the right side,
 \begin{equation} \frac{\partial \tau_\ell(a,b)}{\partial (\ell^2)} = \frac{1}{2}\nabla^2 \overline{a b}^\ell - \frac{1}{2}( \bar{a}^\ell \nabla^2 \bar{b}^\ell + \bar{b}^\ell \nabla^2 \bar{a}^\ell ) \end{equation}
and using the product rule, the following relationship may be established
 \begin{equation} \nabla^2 ( \bar{a}^\ell \bar{b}^\ell ) = \bar{a}^\ell \nabla^2 \bar{b}^\ell + \bar{b}^\ell \nabla^2 \bar{a}^\ell + 2 \frac{\partial \bar{a}^\ell}{\partial x_j} \frac{\partial \bar{b}^\ell}{\partial x_j}, \end{equation}
which upon substitution yields,
 \begin{equation} \frac{\partial \tau_\ell(a,b)}{\partial (\ell^2)} = \frac{1}{2}\nabla^2 ( \overline{a b}^\ell - \bar{a}^\ell \bar{b}^\ell) + \frac{\partial \bar{a}^\ell}{\partial x_j} \frac{\partial \bar{b}^\ell}{\partial x_j}, \end{equation}
hence
 \begin{equation} \frac{\partial \tau_\ell(a,b)}{\partial (\ell^2)} = \frac{1}{2}\nabla^2 \tau_\ell(a,b) + \frac{\partial \bar{a}^\ell}{\partial x_j} \frac{\partial \bar{b}^\ell}{\partial x_j}. \end{equation}
Note that, by definition,  $\tau _{\ell =0}(a,b) = 0$. The Fourier transform of this equation is
 \begin{equation} \frac{\partial \mathcal{F}\{ \tau_\ell(a,b) \}}{\partial (\ell^2)} ={-} \frac{1}{2} k^2 \mathcal{F}\{ \tau_\ell(a,b) \} + \mathcal{F} \left\{ \frac{\partial \bar{a}^\ell}{\partial x_j} \frac{\partial \bar{b}^\ell}{\partial x_j} \right\}. \end{equation}
Multiplying by  $\exp ( \tfrac {1}{2} k^2 \ell ^2 )$,
 \begin{equation} \frac{\partial}{\partial (\ell^2)}\left[ \exp\left( \frac{1}{2} k^2 \ell^2 \right) \mathcal{F}\{ \tau_\ell(a,b) \} \right] = \exp\left( \frac{1}{2} k^2 \ell^2 \right) \mathcal{F} \left\{ \frac{\partial \bar{a}^\ell}{\partial x_j} \frac{\partial \bar{b}^\ell}{\partial x_j} \right\} \end{equation}
and integrating with dummy variable  $\alpha$ from
 $0$ to
 $\ell ^2$,
 \begin{equation} \exp\left( \frac{1}{2} k^2 \ell^2 \right) \mathcal{F}\{ \tau_\ell(a,b) \} = \int_{0}^{\ell^2} \exp\left( \frac{1}{2} k^2 \alpha \right) \mathcal{F} \left\{ \overline{\frac{\partial a}{\partial x_j}}^{\sqrt{\alpha}} \overline{\frac{\partial b}{\partial x_j}}^{\sqrt{\alpha}} \right\} \textrm{d}\alpha, \end{equation}
where  $\tau _{\ell =0}(a,b) = 0$ has been used on the left side of the equation. Then dividing by
 $\exp ( \tfrac {1}{2} k^2 \ell ^2 )$ solving for the generalized second moment,
 \begin{equation} \mathcal{F}\{ \tau_\ell(a,b) \} = \int_{0}^{\ell^2} \exp\left[ -\frac{1}{2} k^2 ( \ell^2 - \alpha ) \right] \mathcal{F} \left\{ \overline{\frac{\partial a}{\partial x_j}}^{\sqrt{\alpha}} \overline{\frac{\partial b}{\partial x_j}}^{\sqrt{\alpha}} \right\} \textrm{d}\alpha, \end{equation}
which can be written as a Gaussian filter with width  $\sqrt {\ell ^2 - \alpha }$,
 \begin{equation} \mathcal{F}\{ \tau_\ell(a,b) \} = \int_{0}^{\ell^2} \mathcal{F} \left\{ \overline{ \overline{\frac{\partial a}{\partial x_j}}^{\sqrt{\alpha}} \overline{\frac{\partial b}{\partial x_j}}^{\sqrt{\alpha}} }^{\sqrt{\ell^2-\alpha}} \right\} \textrm{d}\alpha. \end{equation}
Then, with an inverse Fourier transform, the formal solution is obtained,
 \begin{equation} \tau_\ell(a,b) = \int_{0}^{\ell^2} \left[ \overline{\overline{\frac{\partial a}{\partial x_j}}^{\sqrt{\alpha}} \overline{\frac{\partial b}{\partial x_j}}^{\sqrt{\alpha}} }^{\sqrt{\ell^2-\alpha}} \right] \textrm{d}\alpha. \end{equation}
Now the integrand
 \begin{equation} \mathcal{I} = \overline{ \overline{\frac{\partial a}{\partial x_j}}^{\sqrt{\alpha}} \overline{\frac{\partial b}{\partial x_j}}^{\sqrt{\alpha}} }^{\sqrt{\ell^2-\alpha}} \end{equation}
may be expanded as a product of filtered quantities plus a generalized second moment,
 \begin{align} \mathcal{I} = \overline{ \overline{\frac{\partial a}{\partial x_j}}^{\sqrt{\alpha}} }^{\sqrt{\ell^2-\alpha}} \overline{\overline{\frac{\partial b}{\partial x_j}}^{\sqrt{\alpha}} }^{\sqrt{\ell^2-\alpha}} + \left( \overline{ \overline{\frac{\partial a}{\partial x_j}}^{\sqrt{\alpha}} \overline{\frac{\partial b}{\partial x_j}}^{\sqrt{\alpha}} }^{\sqrt{\ell^2-\alpha}} - \overline{ \overline{\frac{\partial a}{\partial x_j}}^{\sqrt{\alpha}} }^{\sqrt{\ell^2-\alpha}} \overline{ \overline{\frac{\partial b}{\partial x_j}}^{\sqrt{\alpha}} }^{\sqrt{\ell^2-\alpha}} \right), \end{align}
with the two successive filters collapsing to a single filter as
 \begin{align} \mathcal{F}\left\{ \overline{ \overline{\frac{\partial a}{\partial x_j}}^{\sqrt{\alpha}} }^{\sqrt{\ell^2-\alpha}} \right\} &= \exp\left[ -\frac{1}{2} k^2 ( \ell^2 - \alpha ) \right] \exp\left( -\frac{1}{2} k^2 \alpha \right) \mathcal{F}\left\{ \frac{\partial a}{\partial x_j} \right\}\nonumber\\ & = \exp\left( -\frac{1}{2} k^2 \ell^2 \right) \mathcal{F}\left\{ \frac{\partial a}{\partial x_j} \right\} = \mathcal{F}\left\{\overline{\frac{\partial a}{\partial x_j}}^{\ell} \right\}. \end{align}
The resulting simplification for the integrand is
 \begin{equation} \mathcal{I} = \overline{\frac{\partial a}{\partial x_j}}^{\ell} \overline{\frac{\partial b}{\partial x_j}}^{\ell} + \tau_{\beta}\left( \overline{\frac{\partial a}{\partial x_j}}^{\sqrt{\alpha}}, \overline{\frac{\partial b}{\partial x_j}}^{\sqrt{\alpha}} \right), \end{equation}
where  $\beta = \sqrt {\ell ^2 - \alpha }$. The first term on the right is independent of
 $\alpha$ so may be directly integrated, giving the formal solution,
 \begin{equation} \tau_\ell( a, b ) = \ell^2 \overline{\frac{\partial a}{\partial x_j}}^{\ell} \overline{\frac{\partial b}{\partial x_j}}^{\ell} + \int_{0}^{\ell^2} \tau_{\beta}\left( \overline{\frac{\partial a}{\partial x_j}}^{\sqrt{\alpha}}, \overline{\frac{\partial b}{\partial x_j}}^{\sqrt{\alpha}} \right) \textrm{d}\alpha. \end{equation}
For the present context, we take  $a = u_i$ and
 $b = u_j$ from the velocity vector and define the velocity gradient tensor,
 $A_{ij} = \partial u_i / \partial x_j$,
 \begin{equation} \tau_\ell( u_i, u_j)= \ell^2 \bar{A}_{ik}^\ell \bar{A}_{jk}^\ell + \int_{0}^{\ell^2} \tau_{\beta}( \bar{A}_{ik}^{\sqrt{\alpha}}, \bar{A}_{jk}^{\sqrt{\alpha}})\,\textrm{d}\alpha. \end{equation}
Finally, constructing the local cascade rate,  $\varPi ^\ell = - \tau _{\ell }(u_i, u_j) \bar {S}_{ij}^\ell$, by contracting with the filtered strain-rate tensor,
 \begin{equation} \varPi^\ell ={-} \ell^2 \bar{S}_{ij}^\ell \bar{A}_{ik}^\ell \bar{A}_{jk}^\ell - \bar{S}_{ij}^\ell \int_{0}^{\ell^2} \tau_{\beta}( \bar{A}_{ik}^{\sqrt{\alpha}}, \bar{A}_{jk}^{\sqrt{\alpha}} ) \,\textrm{d}\alpha. \end{equation}
Applying the decomposition of the filtered velocity gradient into filtered strain rate and filtered rotation rate,  $\bar {\boldsymbol {A}} = \bar {\boldsymbol {S}} + \bar {\boldsymbol {\varOmega }}$,
 \begin{align} \bar{S}_{ij}^\ell \bar{A}_{ik}^\ell \bar{A}_{jk}^\ell = \bar{S}_{ij}^\ell ( \bar{S}_{ik}^\ell + \bar{\varOmega}_{ik}^\ell ) ( \bar{S}_{jk}^\ell + \bar{\varOmega}_{jk}^\ell ) = \bar{S}_{ij}^\ell \bar{S}_{ik}^\ell \bar{S}_{jk}^\ell + \bar{S}_{ij}^\ell \bar{\varOmega}_{ik}^\ell \bar{S}_{jk}^\ell + \bar{S}_{ij}^\ell \bar{S}_{ik}^\ell \bar{\varOmega}_{jk}^\ell + \bar{S}_{ij}^\ell \bar{\varOmega}_{ik}^\ell \bar{\varOmega}_{jk}^\ell , \end{align}
the middle two terms being zero by symmetry arguments,
 \begin{equation} \bar{S}_{ij}^\ell \bar{A}_{ik}^\ell \bar{A}_{jk}^\ell = \bar{S}_{ij}^\ell \bar{S}_{ik}^\ell \bar{S}_{jk}^\ell + \bar{S}_{ij}^\ell \bar{\varOmega}_{ik}^\ell \bar{\varOmega}_{jk}^\ell = \bar{S}_{ij}^\ell \bar{S}_{ik}^\ell \bar{S}_{jk}^\ell - \tfrac{1}{4} \bar{\omega}_i^\ell \bar{S}_{ij}^\ell \bar{\omega}_{j}^\ell, \end{equation}
with  $\bar {\varOmega }_{ij}^\ell = -\tfrac {1}{2} \epsilon _{ijk} \bar {\omega }_k^\ell$. A similar decomposition of the integrand in (C22) is
 \begin{align} \tau_{\beta}( \bar{A}_{ik}^{\sqrt{\alpha}}, \bar{A}_{jk}^{\sqrt{\alpha}} ) &= \tau_{\beta}( \bar{S}_{ik}^{\sqrt{\alpha}}, \bar{S}_{jk}^{\sqrt{\alpha}} ) + \tau_{\beta}( \bar{S}_{ik}^{\sqrt{\alpha}}, \bar{\varOmega}_{jk}^{\sqrt{\alpha}} ) + \tau_{\beta}( \bar{\varOmega}_{ik}^{\sqrt{\alpha}}, \bar{S}_{jk}^{\sqrt{\alpha}} )\nonumber\\ &\quad + \tau_{\beta}( \bar{\varOmega}_{ik}^{\sqrt{\alpha}}, \bar{\varOmega}_{jk}^{\sqrt{\alpha}}). \end{align}