Introduction
The increasing preoccupation with protection of the environment has created a need for both diagnosis and monitoring the status of environment compartments, in particular negative effects of certain practices, and the value of determining the effectiveness of innovative solutions (Gudmundsson, Reference Gudmundsson2003). Various tools such as indicators or more or less mechanistic models have been prepared to overcome the difficulties posed by the direct measurement of negative or positive effects. In many cases, these tools have gone beyond the status of evaluation instruments to become a means of conceptualising problems or solutions, and have thus become separate fields of research. In addition, the question of indicators is the focal point for the implementation of environment policies aiming to reduce impacts related to agricultural practices. This article first considers the question of evaluation tools to provide a panorama of possibilities and types of indicators available, followed by regulatory or economic means set up to limit situations at risk and orient livestock farming systems towards more environment-friendly practices.
An increasing number of indicators for 20 years
The question of indicators was first posed in the 1990s, related to the issue of sustainable development, with the finding of collateral or secondary effects of growth policies. The increasing importance of this concept led to an ‘explosion of indicators’ (Riley, Reference Riley2001), with many initiatives put forth by work groups of participants involved in the area, and an increasing number of initiatives arising from research. The term ‘indicators’, however, conceals a substantial variability of types, differing by their construction, the type of information used and its mode of acquisition, the quality of data furnished and their domain of validity (Bockstaller et al., Reference Bockstaller, Guichard, Makowski, Aveline, Girardin and Plantureux2008; Girardin et al., Reference Girardin, Bockstaller and Van der Werf1999).
Types of indicators
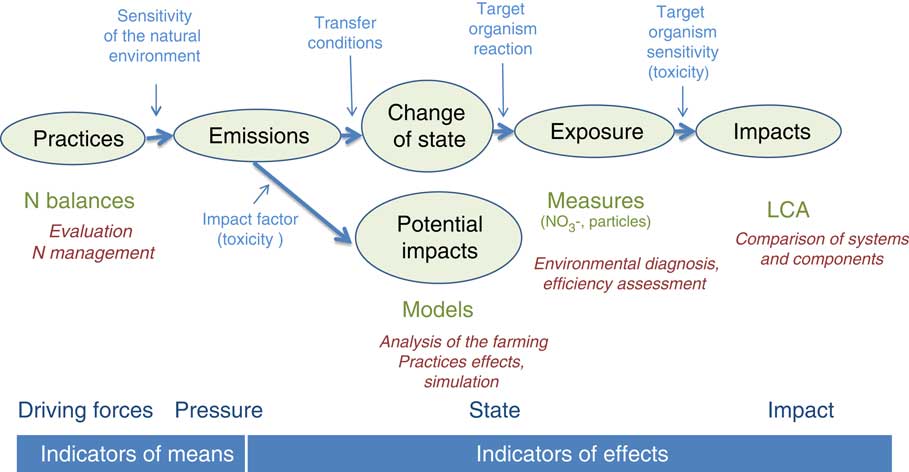
Several types of indicators, including those of the OECD (pressure/state/response) or the European Environment Agency (DPSIR: drivers/pressure/state/impact response) have been based on the causal chain of practices → emissions → change of state of the environment compartment → impacts (Figure 1), even if there is no unanimous agreement by authors on this definition and the steps in the sequence (Niemeijer et al., Reference Niemeijer and de Groot2008). Thus, the term ‘pressure’ related to causes involves agricultural practices or the resulting emissions depending on the authors, whereas the term ‘impact’ characterises both emissions and proven impacts concerning modification of the receiver compartment, for example, proliferation or disappearance of species. Other authors consider emissions to be the first link in the chain of ‘effects’, to distinguish them from ‘means’ or ‘practices’. Similarly, ‘state’ may have a very broad definition, categorising states of the compartment as impacts, that is, final effects on target organisms.
Position of different typologies of indicators on the causal chain. LCA=life cycle analysis (adapted from EEA2005, Smeets and Weterings Reference Smeets and Weterings1999, van der Werf and Petit Reference van der Werf and Petit2002, causal chain by Bockstaller et al. Reference Bockstaller, Guichard, Makowski, Aveline, Girardin and Plantureux2008).

To avoid the above-mentioned imprecisions, Bockstaller et al. (Reference Bockstaller, Lassere-Joulin, Slezack-Deschaumes, Piutti, Villerd, Amiaud and Plantureux2011) proposed to distinguish indicators of agricultural practices, of emissions, of change of state and of impacts, depending on their position on the causal chain (Bockstaller et al., Reference Bockstaller, Lassere-Joulin, Slezack-Deschaumes, Piutti, Villerd, Amiaud and Plantureux2011). Indicators can also be ranked according to the parameters from which they were constructed. We thus distinguish:
∙ simple indicators based on causal variables or simple combinations that are easy to use on a large scale but imprecise for individual situations;
∙ predictive indicators using the outputs of simulation models or more operational simplified models that link causal variables to a more or less explicit effect. They are better reflections of real processes and enable ex ante evaluations;
∙ indicators based on field measurements if they are similar to the existing reality, they do not provide indications on underlying processes and do not enable an ex ante evaluation.
The choice of a type of indicator depends on the reasons and objectives of the evaluation, on users and those benefiting, on the system studied and on available data and resources allocated.
It is also to be noted that livestock farms are open systems with a ‘point source pollution’ component (more highly developed than in strictly agricultural farms with no animals) related to emissions in livestock housing and from storage of organic waste, and a ‘nonpoint source pollution’ component involving the land surfaces used.
Indicators of practices
Many indicators provide a first assessment of agricultural practices. It can be indicators based on quantities of inputs (feed consumed, nitrogen spread, surface fertilised); indicators based on farming practices (methods of spreading, difference from recommended rate, percentage of soil cover); indicators based on the management of animals (herd size, density per hectare, number of days of presence grazing); or indicators related to the characteristics of the farm (waste storage capacity with respect to manuring potential, etc.). These simple indicators of practices are the easiest to use on a large scale and are indispensable for the evaluation of changes of practices. When taken individually, however, they have the major disadvantage of being very weak predictors of emissions and nitrogen losses. To overcome this drawback, it is often recommended to use several indicators but this raises the issue of the summary and compilation of the resulting information obtained (Schröder et al., Reference Schröder, Aarts, ten Berge, van Keulen and Neeteson2003; De Vries e t al., Reference De Vries, Leip, Reinds, Kros, Lesschen, Bouwman, Grizzetti, Bouraoui, Butterbach-Bahl, Bergamaschi and Winiwarter2011; Leip et al., Reference Leip, Britz and De Vries2011).
These indicators are easy to implement and are used in the context of public policies that relate the aspects evaluated to the direct financial stakes. Their operational capacity and thus their relevance is affected by the relative lack of knowledge on livestock production practices in France and by the absence of ‘observatories of practices’ or national databases, for example, as in The Netherlands.
Special case of nitrogen balances
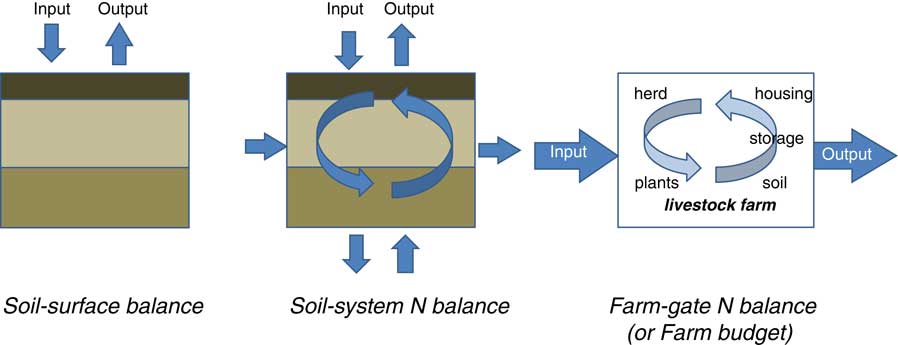
Nitrogen budget is the family of indicators that is most often used to determine the management of nitrogen (Langeveld et al., Reference Langeveld, Verhagen, Neeteson, Keulen, Conijn, Schils and Oenema2007). Nitrogen balance indicators are based on the calculation of a balance: [input N]−[output N]=difference of N stock. First used to manage crop fertilisation, they are currently used to quantify nitrogen excesses and risk of pollution. Three types of budgets are routinely identified: the soil surface balance, the soil system balance and the farmgate balance (Watson and Atkinson, Reference Watson and Atkinson1999; Simon et al., Reference Simon, Grignani, Jacquet, Lecorre and Pages2000; Oenema et al., Reference Oenema, Kros and De Vries2003; Topp et al., Reference Topp, Stockdale, Watson and Rees2007; Leip et al., Reference Leip, Britz and De Vries2011; Figure 2).
Nitrogen balances; conceptual differences in the boundaries and flows of nutrients among the soil surface balance, soil system balance and farm gate balance (from Oenema et al., Reference Oenema, Kros and De Vries2003) and denominations currently used in France.

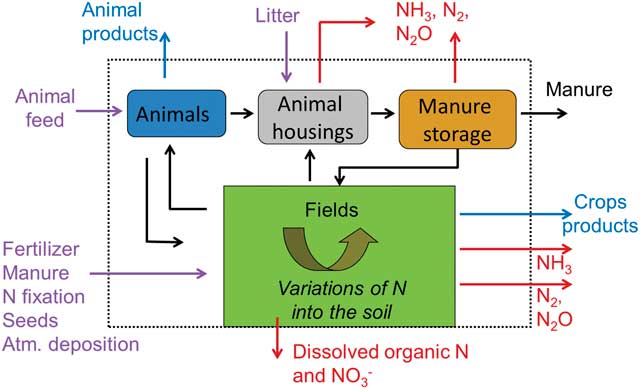
The soil surface balance (or soil crop or soil vegetation) calculates the difference between nitrogen inputs on land including organic or synthetic fertilisers, and exports by crops harvested or grazed. This difference comprises nitrogen losses to water, gaseous losses from manuring (losses in the housing and from storage are deducted from waste produced to calculate the quantities of nitrogen applied as manure), as well as differences in the soil nitrogen stock (Figure 3). This type of balance provides estimations of the net nitrogen density per hectare of land, whether or not devoted to crops. The surfaces considered may be hectares of the manured surface (the case in Denmark and The Netherlands). In France, the soil surface balance applied at the scale of the farm is termed the ‘overall nitrogen balance’ called BGA in France (Balance Globale Azotée), an updated version of the ‘CORPEN balance’ dating back to the first joint work between scientists and public authorities in the mid 1980s (Corpen, 2006). Since the PMPOA (aid scheme to control pollution of agricultural origin) the BGA is the balance used.
Representation of nitrogen flows on animal farm (adapted from Jarvis).

This balance concerns a part of the livestock farming system, but does not include all sources of inputs and losses. The calculation is based primarily on information in the manuring plan or logbook: data on animals are not obligatorily entered, except where required by regulations, for example, green tide basins. The balance is calculated with measured values and default values. Thus, (1) the quantities of organic nitrogen supplied to land surfaces are default values of excretion by animals and of volatilisation and are thus relatively insensitive to variations of livestock production practices; (2) in the case of ruminants, the quantities of grass used by grazing are estimated on the default basis of (quantity of grass grazed=needs of the herd (5.1 t of DM/LLU))–(consumption of stored fodder)). This provides a minimum of consistency between the needs of herds and the forage balance but remains relatively crude (overall) and does not include the consumption of feed concentrates or losses during feed storage. Finally, fodder yields cannot be determined with precision and cannot be easily verified, which makes it difficult to verify adherence to good inorganic fertilisation practices. According to the literature, reliability of data could be improved by progress in remote detection technology and/or by pooling local references (tests of plant varieties, pilot farms, networks of land plots and farms in sensitive catchment areas, etc.).
The ‘soil system’ balance considers all nitrogen flows not covered by the previous balance, to which are added nitrogen flows from transformations of organic matter and of nitrogen in the soil, as well as internal flows (in particular livestock farm waste). A typical example is the balance of the plot of land that places nitrogen fertilisation at the core of reasoning on the stakes related to the culture.
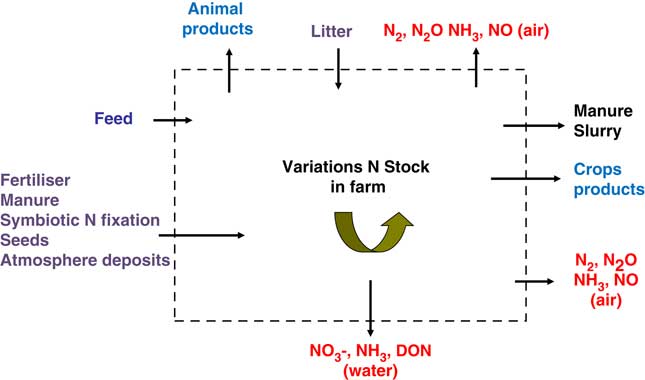
The farmgate balance considers the farm as a ‘black box’ that counts all inputs (purchases of fertiliser, animal feed, waste imported) and outputs (products sold, waste) balance (Watson and Atkinson, Reference Watson and Atkinson1999; Simon et al., Reference Simon, Grignani, Jacquet, Lecorre and Pages2000; Oenema et al., Reference Oenema, Kros and De Vries2003; Topp et al., Reference Topp, Stockdale, Watson and Rees2007; Leip et al., Reference Leip, Britz and De Vries2011). The calculations can include nitrogen but also phosphorus and potassium (CORPEN, 2006). This balance details and ranks all types of contributions to estimate an overall nitrogen pressure on the environment of the farm. The calculation of the balance thus includes all nitrogen losses by volatilisation (building, storage, manuring), by denitrification from supplies of fertiliser or waste, by leaching/runoff to bodies of water and the difference in the nitrogen stock in soils, although it is not possible to distinguish these different types of losses. This balance advances no standard hypothesis on internal flows of the system. At the scale of the farm, it is used for the reliable assessment of any innovation that changes nitrogen inputs or outputs, for example, reduced purchases of fertiliser or feed, increased production for constant inputs. Calculation of the farmgate balance is based on data from accounting ledgers of farms, extended by data on the composition of products purchased enabling the calculation of all ‘controllable’ budget lines of farmgate balances. It enables verification of consistency between environmental effects and economic results, thereby giving educational value helping the farmer guide his choices to optimise the efficiency of using inputs. As it includes all losses, the excess of the farmgate nitrogen balance is logically higher than that of the BGA, which considers N flows only after gaseous losses in livestock housing and during storage, and does not include nitrogen inputs from purchased feed (see Figure 4). Among the limitations, we may mention that this apparent balance does not take into account the way in which the operator manages his system: use of pastures, catch crops or uncovered ground in the winter, buried or exported straw, management of waste, etc. Nor does it enable the evaluation of how plots of land are managed and the distribution of nitrogen among them; some may be deficient in N while others may be largely enriched. One of the limitations in the use of the farmgate balance involves the availability of data that is generally low in France, whereas it is larger in other countries where livestock farmers request these calculations to improve their practices, even their economic efficiency, and so record data at regular intervals (Durand, Reference Durand2004).
Farmgate balance or farm ‘apparent balance’.

Inputs from atmospheric deposits and symbiotic nitrogen fixation by legumes are or are not considered, depending on the publication. This creates differences in the absolute values of balances and may lead to an underestimation of losses, as once this nitrogen enters the system, it can contribute to impacts in the same way as other nitrogen sources. It is to be noted that the estimation of symbiotic nitrogen fixation involves hypotheses requiring quantifying biomasses of legumes produced (in particular, for pasture legumes). The BGA is free of this disadvantage as it employs the simplifying hypothesis that nitrogen entered by fixation is equivalent to nitrogen exported by legumes; fixation is not counted as either an input or an output.
Validation and predictive quality of balances in terms of pollution
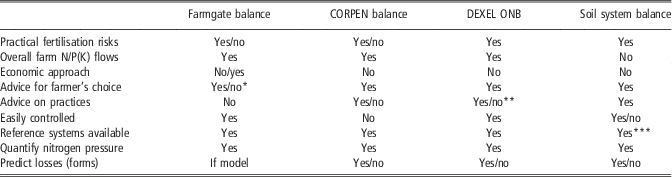
Although all balances quantify nitrogen pressure on the environment, the question may nevertheless be posed on the relevance of this ‘nitrogen surplus’ indicator (balance excess) for assessing risks of pollution by nitrogen. There is a general positive link between the balance surplus and polluting emissions but this relationship is neither simple nor closely related. The relationship is strong for balances with high excesses (+200 kg N/ha), but is less for values found in relatively well fertilised systems (<50 kg N/ha, e.g. in Agri-Mieux operations that have replaced Ferti-Mieux operations in the Rhine-Meuse basin). In all cases, an equilibrated or even negative balance does not signify the absence of risk of nitrogen losses. This has caused many authors to exercise caution on the predictive qualities of apparent or ‘soil surface’ balances. For example, the presence of cover crops appears to be a more determinant indicator in situations where the excess is moderate, where the inorganic surplus is well correlated with pollution only when it is high (Table 1).
Indications and limitations of four types of inorganic plot/farm balances (farmgate balance, CORPEN balance, overall nitrogen balance and soil system balance; from Vertès et al., Reference Vertès, Bockstaller, Espagnol, Guichard, Petit and Raison2010)

* Calculations of coefficients of efficiency (outputs/inputs) and loss (balance excess/‘useful’ outputs), Simon et al. (Reference Simon, Grignani, Jacquet, Lecorre and Pages2000) enable the user to judge his performances against references, for example, same type of production and same climatic context.
** Regulatory use of the tool (control) has led to reduced use of the possibilities as a means of providing advice.
*** Available culture references.
Indicators of emission: state or impact
Indicators of emission provide an estimation of nitrogen losses in a system, which may be a plot of farmland, livestock housings or an ecosystem. These indicators are based on measurements in the field and more or less complex modelling procedures.
Direct measurements
The use of indicators based on measurements in the field is clearly obligatory in order to have a relatively reliable image of the effects of various environmental measures taken. Measurements of soil mineral nitrogen before winter are conducted on large scales in some parts of European such as Bade-Wurtemberg (Germany) and Wallonia (Belgium). In the latter case, they are subjected to taxation in case of substantial excesses of reference values established every year on the basis of average values measured in the region. An interesting alternative involves more technical data such as soil nitrate contents measured with ceramic cup samplers or concentrations of atmospheric pollutants, but these require considerable long-term financial investment. Nitrate contents at the limit of the rooting zone of crops have been measured for many years by research teams (INRA Mirecourt, Laon, etc.) or more recently by extension agencies (Saone et Loire Department, Alsace region, etc.) to establish references for different cropping systems. These measurements require considerable methodological precautions but in any case, these indicators do not enable cause and effect relations to be established. In addition, information on agricultural practices is required.
Emission factors
Emission factors are used primarily for gaseous emissions, in particular NH3 and N2O. They are generally determined from experimental results and their validity thus depends on the more or less broad spectrum of conditions in which they were established and many reviews have been published (guidebook UNECE/TFEIP). These emission factors are widely used to determine emissions of atmospheric pollutants (CLRTAP) or greenhouse gases (GIEC) in order to identify trends and verify compliance with emission ceilings. They are also used to determine the potential of various techniques for reducing these emissions, from the scale of the farm to that of the country.
Modelling
The value of models is to relate outputs to explanatory variables, including agricultural practices. There exist a number of complex tools that simulate processes and emissions, in general, dynamically (Canavo et al., Reference Cannavo, Recous, Parnaudeau and Reau2008). The STICS model developed by the INRA has been used for several applications, some at the scale of large basins (Seine basin). Similarly, the DNDC model has been used by the ISPRA European Research Centre to determine all losses to water and the atmosphere at the scale of Europe. The use of these models is a complicated procedure, often requiring the input of a large quantity of spatial data and prior calibration, making their use restricted to specific projects. More operational approaches have also been developed, including the nitrogen indicator of the INDIGO® method that is representative of a ‘classical indicators’ approach ( Bockstaller and Girardin, Reference Bockstaller and Girardin2006; Bockstaller et al, Reference Bockstaller, Guichard, Keichinger, Girardin, Galan and Gaillard2008).
A possibility for improvement is offered by combining balances and flow models, for both agro-environmental change and the prediction of losses. This has already been used in projects on cropping sequences and rotations, for example, Territ’eau and Syst’N in France. These tools can be used for diagnosis and decision assistance. Several models are aimed at these end results at the level of the farm, some of which are also used in France. Another level of coupling is required, that is, with economic evaluations.
Life cycle analysis (LCA) provides indicators of impacts (eutrophication, climate change, acidification, etc.) using a systematic inventory of all emissions and consumptions of resources throughout the entire production cycle, from the manufacture of inputs up to the elimination of waste. This method has been adapted from industry and is being increasingly applied to agriculture. It is covered by a standard and has been substantiated by the work of an entire scientific community. The LCA procedure is relevant for livestock farm systems because feed production is outsourced, for the comparison of very different production systems or for the analysis of components of a particular sector (Bockstaller et al., Reference Bockstaller, Guichard, Keichinger, Girardin, Galan and Gaillard2009; Van der Werf et al, Reference Van der Werf, Kanyarushoki and Corson2011). It is nevertheless difficult to implement and some points are controversial. In particular, methods for quantifying emissions are not covered by a standard(s) and may thus be based on simple coefficients of emissions or on complex models. In the case of the Swiss SALCA method, nitrogen emissions from crops in the field are estimated using a model similar to the ‘nitrogen’ indicator of the INDIGO® method (Bockstaller et al., Reference Bockstaller, Gaillard, Baumgartner, Freiermuth Knuchel, Reinsch, Brauner and Unterseher2006).
In the end, which indicators?
In light of the large number of existing indicators, it is important for the user to clarify his needs before selecting the most suitable indicator(s) to fulfil these needs, depending on available resources (Bockstaller et al., Reference Bockstaller, Guichard, Keichinger, Girardin, Galan and Gaillard2009). The compartments examined, the types of pollutants, (NO3, N2O, NH3), the intended use, recipients of the information and the scales of work (of data collection and calculation) are among the preliminary factors that guide the choice of indicators.
Indicators may be required to monitor agricultural practices in the framework of assessment of an environment policy or for monitoring regulatory compliance. They are much easier to use, in particular, for large scales. Calculations of input/output balances of the farm provide a more detailed image of the potential for losses. This may thus be of interest to farmers for managing nitrogen in their operation, as is shown by the Dutch experience being developed. In order to obtain a more accurate view of nitrogen losses, the use of indicators based on measurements in the field is a requirement, as is being done in several neighbouring countries. Finally, many models currently existing and some indicators based on modelling results have the advantage of being able to provide simulations and thus can use prior results on improvement of practices in order to reduce losses.
Examining different families of indicators also points out differences resulting from prior hypotheses and from what type of impacts are taken into consideration. Consequently, priorities between scenarios and recommendations can be different. This is especially true for LCA methods that are highly dependent on choices adopted to define and delimit systems of impacts. In all cases, the indicator is often a compromise between what must be done and what can be done. It is thus essential to explain methodological choices and an estimation of uncertainty of the results, in particular, if these results are used for a certification of environmental qualification (carbon footprint).