Implications
The present study quantified the phenotypic and genetic characteristics of cow milk calcium, phosphorus and acidity predicted by mid-IR spectroscopy. These milk features are very important for both human health and the technological properties of milk. The existence of heritable genetic variation coupled with the potential to predict these components for routine cow milk testing, imply that genetic gain in these traits is indeed possible.
Introduction
Global demand for dairy products is increasing, especially milk powder and butter, and further expansion of trade in dairy products is expected. Moreover, in recent years, there is a growing interest in milk components with potential benefits for human health. Milk mineral profile, in particular calcium (Ca) and phosphorus (P) content, play a key role in human health (Caroli et al., Reference Caroli, Poli, Ricotta, Banfi and Cocchi2011), especially for osteoporosis, which is a progressive bone disease related to deficiencies in Ca and vitamin D. Both Ca and P are also important in cheese-making as they influence the coagulation process and the final consistency of the curd (Fossa et al., Reference Fossa, Pecorari, Sandri, Tosi and Mariani1994).
Another characteristic that affects the technological properties of milk is titratable acidity (TA), which has a key role in the aggregation rate of para-casein micelles, in the reactivity of rennet (De Marchi et al., Reference De Marchi, Fagan, O'Donnell, Cecchinato, Dal Zotto, Cassandro, Penasa and Bittante2009) and also on milk coagulation properties (De Marchi et al., Reference De Marchi, Dal Zotto, Cassandro and Bittante2007).
There is a paucity of studies that have estimated genetic variation for milk mineral content and acidity. Van Hulzen et al. (Reference Van Hulzen, Sprong, van der Meer and Van Arendonk2009) reported heritability estimates of 0.57 and 0.62 for milk Ca and P content, respectively, in 1860 Dutch Friesian cows. Reported heritability estimates for milk TA range from 0.17 to 0.23 in Italian Holstein cows (Cassandro et al., Reference Cassandro, Comin, Ojala, Dal Zotto, De Marchi, Gallo, Carnier and Bittante2008; Cecchinato et al., Reference Cecchinato, Penasa, De Marchi, Gallo, Bittante and Carnier2011). To our knowledge, only Soyeurt et al. (Reference Soyeurt, Bruwier, Gengler, Romnee and Dardenne2008a) used 5502 multi-breed cows to estimate genetic parameters for mineral content of milk predicted by mid-IR spectroscopy (MIRS) and they reported heritabilities of 0.42 and 0.47 for Ca and P, respectively.
The limited number of studies on the genetics of milk mineral composition and acidity is likely related to the high analytical costs associated with measuring these traits, thereby hindering the generation of large data sets (De Marchi et al., Reference De Marchi, Toffanin, Cassandro and Penasa2014). MIRS has already been proposed to predict milk Ca and P (Soyeurt et al., Reference Soyeurt, Bruwier, Gengler, Romnee and Dardenne2008a; Toffanin et al., Reference Toffanin, De Marchi, Lopez-Villalobos and Cassandro2015), thereby providing a low-cost approach to generate large datasets useful for genetic evaluations. The objective therefore of the present study was to estimate genetic parameters for milk Ca, P and TA predicted by MIRS as well as the genetic correlations between these traits with milk production and quality in Italian Holstein−Friesian cows.
Material and methods
Data and MIRS prediction models
A total of 2458 Holstein−Friesian cows representing the offspring of 210 AI sires were sampled once in 220 Italian dairy herds between May 2010 and March 2011. Cows were from parity 1 to 10, and between 5 and 600 days in milk (DIM). Information on parity, DIM and milk yield (MY, kg/day) at the time of milk sampling was provided by the Breeders Association of the Veneto region (Padova, Italy). Samples were preserved with Bronopol (Knoll Pharmaceuticals, Nottingham, UK), transported to the laboratory of the Breeders Association of the Veneto region (Padova, Italy), and analysed within 12 h of collection. The routine prediction of milk fat and protein percentage as well as pH were conducted with a Milko-Scan FT6000 (Foss Electric A/S, Hillerød, Denmark) and somatic cell count (SCC) was determined using a Cell Fossomatic 250 (Foss Electric A/S). SCC was transformed to somatic cell score (SCS) by taking the natural logarithm of SCC. Spectral information was stored for all milk samples.
Predicted Ca and P content, and TA were obtained using MIRS models developed by Toffanin et al. (Reference Toffanin, De Marchi, Lopez-Villalobos and Cassandro2015). Briefly, calibration models were built using 208 cow milk samples collected from 13 herds chosen from those analysed in the present study. The gold standard method for the quantification of Ca and P was based on inductively coupled plasma optical emission spectrometry with previous milk mineralization; for TA the gold standard was milk titration. Prediction models were developed through partial least squares regression analysis using the PLS procedure of SAS (SAS Institute Inc., Cary, NC, USA). Coefficients of correlation of the models were 0.73, 0.84 and 0.86 for Ca, P and TA, respectively, and the ratio performance deviation was 1.47 for Ca, 1.84 for P and 2.01 for TA (Toffanin et al., Reference Toffanin, De Marchi, Lopez-Villalobos and Cassandro2015).
Statistical analyses
Factors associated with the traits of interest were determined using the following linear model in PROC GLM (SAS Institute Inc., Cary, NC, USA):
 $$\eqalignno{Y_{{ijkl}} =\,\,&\mu {\plus}{\rm herd}_{i} {\plus}{\rm parity}_{j} {\plus}{\rm stage}_{k} \cr &{\plus}\left( {{\rm parity }{\times}{\rm stage}} \right)_{{jk}} {\plus}e_{{ijkl}} ,$$
where Y ijkl is the dependent variable (Ca, P, TA, pH, fat percentage, protein percentage, SCS or MY); µ the overall mean; herd i the fixed effect of the i th herd of sampling (i=1 to 220); parity j the fixed effect of the j th parity of the cow (j=1, 2, 3, ⩾4); stage k the fixed effect of the k th class of DIM (k=5 to 35, 36 to 65, 66 to 95, …, 306 to 350, 351 to 450, >450 days); (parity×stage) jk the fixed interaction effect between parity and stage of lactation; and e ijkl the random residual ~N(0, σ 2 e ). In the model, the herd and test-day effects were confounded because cows in each herd were sampled only once, all on the same test-day.
Variance and covariance components for the studied traits were estimated using univariate and bivariate animal models in ASREML (Gilmour et al., Reference Gilmour, Gogel, Cullis and Thompson2009). Fixed effects considered in the analyses were the same as described previously, and the random effects were the additive genetic effect and the residual term. The number of animals in the additive relationship matrix was 33 197 and included individuals with phenotypic records and their ancestors up to 23 generations back. Pedigree information was provided by the Italian Holstein Friesian Cattle Breeders Association (Cremona, Italy).
Results
Descriptive statistics
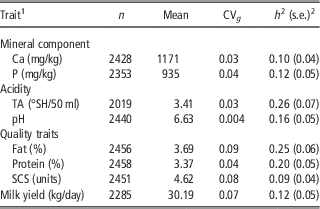
Predicted Ca, P, TA and pH averaged 1171 mg/kg, 935 mg/kg, 3.41 °SH/50 ml and 6.63, respectively (Table 1). The coefficient of variation was 0.13 for both Ca and P, 0.08 for TA and 0.01 for pH.
Mean, coefficient of genetic variation (CV g), estimated heritability (h 2 ; standard errors in parentheses) of milk mineral components, acidity, chemical composition and yield

Ca=calcium; P=phosphorus; TA=titratable acidity; SCS=somatic cell score; SCC=somatic cell count.
1 [SCS=ln(SCC)].
2 All estimates of heritability are significantly different from zero (P<0.05).
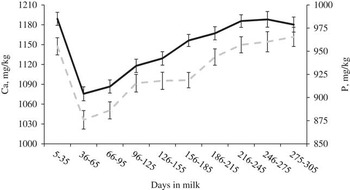
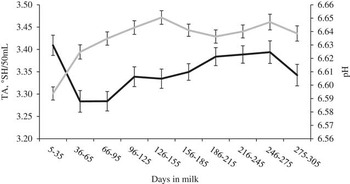
The effect of lactation stage on Ca and P content was similar (Figure 1); both components decreased rapidly within the first 2 months of lactation and increased thereafter. The trend for TA and pH in early to mid-lactation was opposite to each other (Figure 2); milk TA decreased markedly in the 1st month after calving, reached a plateau during the 2nd month, and increased thereafter, whereas milk pH increased until the 5th month after calving and decreased slightly thereafter (Figure 2).
Least squares means (with standard errors) of predicted calcium (Ca − continuous line) and phosphorus (P − dashed line) across days in milk.

Least squares means (with standard errors) of predicted titratable acidity (TA − black line) and pH (grey line) across days in milk.

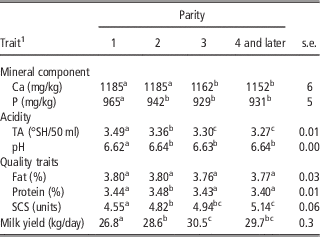
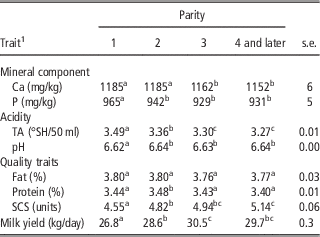
Least squares means for the milk characteristics in each parity are in Table 2. Predicted mineral content and TA were inversely related to parity (P<0.05); pH did not change among parities with the exception of parity 1, which exhibited the lowest pH value (P<0.05). Significant parity effects were detected for MY, protein percentage and SCS, whereas no effects were detected for fat percentage.
Least squares means and pooled standard errors (s.e.) for milk mineral components, acidity, chemical composition and yield across parities
Ca=calcium; P=phosphorus; TA=titratable acidity; SCS=somatic cell score; SCC=somatic cell count.
a,b,cMeans with different superscripts within a row are significantly different (P<0.05).
1 [SCS=ln(SCC)].
Heritability
Estimates of heritability for predicted Ca, P and TA were 0.10, 0.12 and 0.26, respectively (Table 1), and they ranged from 0.09 (SCS) to 0.25 (fat percentage) for milk quality and yield. The coefficients of genetic variation for the minerals and TA were lower than those of fat percentage, SCS and MY, but comparable to that of protein percentage. Practically no genetic variation in milk pH existed with a detected coefficient of genetic variation of only 0.004.
Phenotypic and genetic correlations
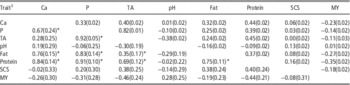
Predicted Ca was moderately phenotypically correlated with both P (0.33) and TA (0.40), whereas P was strongly correlated (0.82) with TA (Table 3). A moderate negative phenotypic correlation (−0.38) existed between TA and pH. Phenotypic correlations of the milk minerals and TA with milk chemical composition varied from 0.00 (TA and SCS) to 0.45 (TA and protein percentage). MY was negatively phenotypically correlated with Ca, P and TA, albeit all correlations were weak (−0.23 to −0.11; Table 3).
Phenotypic (above diagonal, with standard errors in parentheses) and genetic (below diagonal, with standard errors in parentheses) correlations between milk mineral components, acidity, chemical composition and yield

Ca=calcium; P=phosphorus; TA=titratable acidity; SCS=somatic cell score; MY=milk yield; SCC=somatic cell count.
1 [SCS=ln(SCC)].
*Genetic correlations are significantly different from zero at P<0.05.
Strong and significant (P<0.05) genetic correlations existed between TA and P (0.92) and between Ca and P (0.67). Genetic correlations of Ca, P and TA with fat and protein percentages ranged from 0.35 (TA and fat percentage; P<0.05) to 0.91 (P and protein percentage; P<0.05), and with SCS and MY the correlations were weak to moderate and not significantly different from zero (P>0.05; Table 3).
Discussion
Descriptive statistics
Mean milk Ca and P in the present study are within the ranges of values documented by van Hulzen et al. (Reference Van Hulzen, Sprong, van der Meer and Van Arendonk2009), Cashman (Reference Cashman2011) and Toffanin et al. (Reference Toffanin, De Marchi, Lopez-Villalobos and Cassandro2015), who reported average values from 1120 to 1235 mg/kg and from 890 to 1027 mg/kg for measured Ca and P in bovine milk, respectively. Moreover, van Hulzen et al. (Reference Van Hulzen, Sprong, van der Meer and Van Arendonk2009) and Toffanin et al. (Reference Toffanin, De Marchi, Lopez-Villalobos and Cassandro2015) documented a phenotypic coefficient of variation between 9% and 12% for measured Ca and P in milk of Holstein−Friesian cows. Soyeurt et al. (Reference Soyeurt, Bruwier, Romnee, Gengler, Bertozzi, Veselko and Dardenne2009) investigated the feasibility of MIRS to predict the content of milk minerals using the ICP-AES without previous mineralization as the reference method. Despite differences in pre-treatment for ICP-AES as well as the data originating from two separate populations of cows, similar means and coefficients of variation were observed between the present study and the aforementioned study of Soyeurt et al. (Reference Soyeurt, Bruwier, Romnee, Gengler, Bertozzi, Veselko and Dardenne2009).
Parity least squares means for Ca and P (Table 2) followed a similar trend to that described by Kume et al. (Reference Kume, Yamamoto, Kudo, Toharmat and Nonaka1998) in Japanese Holstein cows, who reported a slight decrease in milk mineral concentration after first parity, even if not statistically significant. The decrease in milk Ca and P content within increasing parity is probably due to the reduced utilization of these minerals in the mammary gland (Kume and Tanabe, Reference Kume and Tanabe1993). Indeed, serum Ca and P concentration is also inversely related to parity number (Shappell et al., Reference Shappell, Herbein, Deftos and Aiello1987; Romo et al., Reference Romo, Kellems, Powell and Wallentine1991) justifying the hypothesis of a lower utilization in older cows. Van de Braak and Van’t Klooster (Reference Van de Braak and Van’t Klooster1987) argued that osteoplastic activities are less intense in older than in younger cows, which could explain a decreased responsiveness for parathyroid hormone-mediated Ca resorption and intestinal absorption in older parity cows (Romo et al., Reference Romo, Kellems, Powell and Wallentine1991). Moreover, the greater amount of milk produced by older cows during lactation could explain the lower mineral content because of the dilution.
The association between lactation stage and Ca in the present study (Figure 1) corroborates the observed increase in milk Ca content across lactation documented by van Hulzen et al. (Reference Van Hulzen, Sprong, van der Meer and Van Arendonk2009) in 1860 Dutch Holstein−Friesian cows. Similar effects have been documented in other dairy species such as goat and sheep (Sahan et al., Reference Şahan, Say and Kaçar2005; Kondyli et al., Reference Kondyli, Katsiari and Voutsinas2007). Trends of minerals across DIM might be due to changes in feeding composition across lactation (Cashman and Flynn, Reference Cashman and Flynn2003) or to a dilution effect during lactation; negative phenotypic correlations between MY with both Ca (−0.23) and P (−0.14) were observed in the present study after adjustment for terms in the statistical model (Table 3).
Mean milk TA across all samples in the present study is similar to documented values of TA in the milk of Holstein−Friesian (Cassandro et al., Reference Cassandro, Comin, Ojala, Dal Zotto, De Marchi, Gallo, Carnier and Bittante2008) and Brown Swiss cows (De Marchi et al., Reference De Marchi, Dal Zotto, Cassandro and Bittante2007 and Reference De Marchi, Bittante, Dal Zotto, Dalvit and Cassandro2008; Cecchinato et al., Reference Cecchinato, Penasa, De Marchi, Gallo, Bittante and Carnier2011; Penasa et al., Reference Penasa, Tiezzi, Sturaro, Cassandro and De Marchi2014) and in herd bulk milk samples destined for Grana Padano cheese production (Pretto et al., Reference Pretto, De Marchi, Penasa and Cassandro2013). Moreover, mean TA in the present study is similar to reported values of MIRS-predicted TA by De Marchi et al. (Reference De Marchi, Fagan, O'Donnell, Cecchinato, Dal Zotto, Cassandro, Penasa and Bittante2009), Colinet et al. (Reference Colinet, Soyeurt, Anceau, Vanlierde, Keyen, Dardenne, Gengler and Sindic2010) and Toffanin et al. (Reference Toffanin, De Marchi, Lopez-Villalobos and Cassandro2015). The lower pH in first compared with later parity cows corroborates results of Ikonen et al. (Reference Ikonen, Morri, Tyrisevä, Ruottinen and Ojala2004) and could be the consequence, at least partly, of the higher values of P and TA in first lactation cows (Table 2), and the inverse relationships between these minerals and pH (Table 3). The interrelationships between milk acidity and mineral content have been previously investigated (Mariani et al., Reference Mariani, Bonatti and Pecorari1989). The similar patterns of TA and minerals across stages of lactation (Figures 1 and 2) could be explained by the nature of these traits; TA is moderately phenotypically correlated with both protein percentage and Ca, as well as being strongly correlated with P (Table 3). As a consequence, it is expected that TA follows the trend of minerals across lactation, which decreases markedly in early lactation, increasing thereafter.
Descriptive statistics of milk chemical composition and MY are in agreement with those documented in several studies on Italian Holstein−Friesian cows (Cassandro et al., Reference Cassandro, Comin, Ojala, Dal Zotto, De Marchi, Gallo, Carnier and Bittante2008; Pretto et al., Reference Pretto, Kaart, Vallas, Jõudu, Henno, Ancilotto, Cassandro and Pärna2011; Tiezzi et al., Reference Tiezzi, Pretto, De Marchi, Penasa and Cassandro2013), with the exception of SCS, which exhibited a smaller phenotypic coefficient of variation in the present study. Parity mean milk composition and yield (Table 2) were generally in agreement with other studied international populations of dairy cows (Ikonen et al., Reference Ikonen, Morri, Tyrisevä, Ruottinen and Ojala2004; Hansen et al., Reference Hansen, Friggens and Højsgaard2006; Bastin et al., Reference Bastin, Soyeurt and Gengler2013).
Heritabilities
Heritability estimates of Ca and P were markedly lower than those reported by Soyeurt et al. (Reference Soyeurt, Arnould, Bruwier, Dardenne, Romnee and Gengler2008b) who predicted Ca and P using MIRS with similar accuracy to the equations used in the present study. Differences in number and variability of data could explain different estimates between the present study and that of Soyeurt et al. (Reference Soyeurt, Arnould, Bruwier, Dardenne, Romnee and Gengler2008b). Using data on measured Ca and P, Van Hulzen et al. (Reference Van Hulzen, Sprong, van der Meer and Van Arendonk2009) reported similar heritability estimates for Ca and P to those documented by Soyeurt et al. (Reference Soyeurt, Arnould, Bruwier, Dardenne, Romnee and Gengler2008b). The lower heritability estimates obtained in the present study could be also related to the MIRS prediction models performance: the less than perfect predictions will likely increase the residual variance and thus reduce the heritability. Nevertheless, the presence of genetic variation in these traits, albeit with coefficients of genetic variation generally less than observed for other performance traits like milk production, suggests that genetic improvement is still nonetheless possible. This is especially true because milk MIRS information is routinely available on all milk samples taken during milk testing. Moreover, it has been reported that also in the case of quite low accuracy of prediction, the genetic correlations between predicted and true values are strong. This was demonstrated by Cecchinato et al. (Reference Cecchinato, De Marchi, Gallo, Bittante and Carnier2009) who compared genetic parameters from predicted (with accuracies similar to those obtained in the present study) and measured values of milk coagulation properties: those authors concluded that the genetic response in milk coagulation properties from selection using MIRS predictions as indicator traits is expected to be equal to or slightly lower than the response achievable through direct measurement of the traits (Cecchinato et al., Reference Cecchinato, De Marchi, Gallo, Bittante and Carnier2009).
The accuracy of selection for both milk Ca and P based on information on 100 half-sib daughters (ignoring parental contribution) in a univariate genetic evaluation is 0.86. Assuming a genetic gain of 0.22 standard deviations annually, this equates to a potential genetic gain of 7.3 and 6.9 mg/kg for Ca and P, respectively. The actual gain achievable, however, will be dependent on the traits in the breeding goal, their covariances with Ca and P and their relative weighting within the breeding goal, as well as other factors like intensity of selection, accuracy of selection and generation interval (Rendel and Robertson, Reference Rendel and Robertson1950).
To our knowledge, this is the first study to estimate genetic parameters for TA predicted by MIRS. Heritability estimates for actual TA, determined using Soxhlet−Henkel degrees, has been reported to range between 0.17 and 0.23 in Holstein−Friesian (Cassandro et al., Reference Cassandro, Comin, Ojala, Dal Zotto, De Marchi, Gallo, Carnier and Bittante2008) and Brown Swiss cows (Cecchinato et al., Reference Cecchinato, Penasa, De Marchi, Gallo, Bittante and Carnier2011). The heritability of pH in the present study (0.16) is within the range of 0.06 (Cecchinato et al., Reference Cecchinato, Penasa, De Marchi, Gallo, Bittante and Carnier2011) to 0.38 (Ikonen et al., Reference Ikonen, Morri, Tyrisevä, Ruottinen and Ojala2004) reported in other populations. The lack of genetic variation in pH observed in the present study suggests limited potential for change through breeding; the small phenotypic coefficient of variation for pH, also suggests limited potential for alteration of milk pH in the dairy cow through non-breeding means.
Phenotypic and genetic correlations
Both the phenotypic and genetic correlations between Ca and P observed in the present study were consistent with correlations reported by Soyeurt et al. (Reference Soyeurt, Arnould, Bruwier, Dardenne, Romnee and Gengler2008b) from a large multi-breed population of dairy cows. The phenotypic correlation between measures of P and TA has been reported to range from 0.54 to 0.81 (Mariani et al., Reference Mariani, Bonatti and Pecorari1989; Toffanin et al., Reference Toffanin, De Marchi, Lopez-Villalobos and Cassandro2015), depending on whether individual or bulk milk samples or whether single or multi-breed populations were considered. As expected, the phenotypic correlation between P and pH in the present study was negative, although weak, reflecting the link between P and TA (positive and strong) and between TA and pH (negative and moderate). The phenotypic correlation between TA and P was also confirmed by the effect of lactation stage on each trait being a mirror of the other (Figure 2). Similar correlations were reported by Mariani et al. (Reference Mariani, Bonatti and Pecorari1989) who assessed a phenotypic correlation of −0.61 between pH and soluble P.
No study has previously estimated the genetic correlations between milk mineral content and other milk components. Predicted Ca and P were positively and moderately (phenotypic) to strongly (genetic) correlated with milk protein and fat percentage. After all, as reported by Malacarne et al. (Reference Malacarne, Franceschi, Formaggioni, Sandri, Mariani and Summer2013), micellar P can be present as part of colloidal calcium phosphate or covalently bound to caseins as phosphate groups, given that Ca and P are basic components of the milk micelles. MY was moderately and not significantly (P>0.05) related to Ca, P and TA, suggesting independence of production from mineral content and acidity of milk. However, it is likely that the lack of significance in the present study was the consequence of the relatively small sample size, which led to quite high standard errors for some estimates of genetic correlations. The use of MIRS models to predict milk mineral content and TA at population level will reduce the sampling variance.
Conclusions
Improvement in milk mineral and acidity profiles could be of benefit for the human nutritional and technological characteristics of milk. The existence of heritable genetic variation coupled with the ability to predict these milk characteristics through routinely available MIRS suggests that genetic selection for these components in milk is indeed possible. Moreover, because Ca, P and TA are genetically correlated with milk protein and fat percentage, breeding goals that select for improved milk fat and protein concentration are likely to be indirectly selecting also for improved milk Ca, P and TA.
Acknowledgements
The authors thank the laboratory of the Breeders Association of the Veneto region (Padova, Italy) for providing data, the Italian Holstein Friesian Cattle Breeders Association (ANAFI, Cremona, Italy) for pedigree information, Dr Denis Pretto (Estonian University of Life Sciences, Estonia) and Lucia Ancilotto (University of Padova, Italy) for technical support, and ‘CPDA134308/13’ project for financial support. V. Toffanin performed the statistical analyses and wrote the first draft of the manuscript. M. De Marchi and D.P. Berry designed the research. All authors were involved in drafting the paper and contributed to the interpretation and discussion of the results.