1 Introduction
Winds force the oceans by applying a stress at the sea surface. A question of interest is where and how this vertical flux of horizontal momentum into the ocean is balanced. Consider, for example, a steady zonal wind blowing over the sea surface and exerting a force on the ocean. In a statistically steady state, we can identify all possible mechanisms for balancing this surface force by first vertically integrating over the depth of the ocean and then horizontally integrating over a region in which the wind stress is approximately uniform. Following the strategy of Bretherton & Karweit (Reference Bretherton and Karweit1975), we have in mind a mid-ocean region that is much smaller than ocean basins but much larger than the length scale of ocean macroturbulence. The zonal wind stress on this volume can be balanced by several processes which we classify as either local or non-local. The most obvious local process is Ekman drag in turbulent bottom boundary layers. However, in the deep ocean, Ekman drag is negligible (Munk & Palmén Reference Munk and Palmén1951); instead, the most important local process is topographic form stress (the correlation of pressure and topographic slope). Topographic form stress is an inviscid mechanism for coupling the ocean to the solid Earth. Non-local processes include the advection of zonal momentum out of the domain and, most importantly, the possibility that a large-scale pressure gradient is supported by piling water up against either distant continental boundaries or ridge systems.
In this paper, we concentrate on the local processes that balance wind stress and result in homogeneous ocean macroturbulence. Thus, we investigate the simplest model of topographic form stress: a single-layer quasi-geostrophic (QG) model, forced by a steady zonal wind stress in a doubly periodic domain (Hart Reference Hart1979; Davey Reference Davey1980; Carnevale & Frederiksen Reference Carnevale and Frederiksen1987; Holloway Reference Holloway1987). A distinctive feature of the model is a uniform large-scale zonal flow
 $U(t)$
that is accelerated by the applied uniform surface wind stress
 $\unicode[STIX]{x1D70F}$
while resisted by both Ekman bottom drag
 $\unicode[STIX]{x1D707}U$
and domain-averaged topographic form stress:
 $$\begin{eqnarray}U_{t}=F-\unicode[STIX]{x1D707}U-\langle \unicode[STIX]{x1D713}\unicode[STIX]{x1D702}_{x}\rangle .\end{eqnarray}$$
Here,
 $F=\unicode[STIX]{x1D70F}/(\unicode[STIX]{x1D70C}_{0}H)$
, where
 $\unicode[STIX]{x1D70C}_{0}$
is the reference density of the fluid and
 $H$
is the mean depth. The eddy streamfunction
 $\unicode[STIX]{x1D713}(x,y,t)$
in (1.1) evolves according to the quasi-geostrophic potential vorticity (QGPV) equation (2.3),
 $\unicode[STIX]{x1D702}$
is the topographic contribution to the potential vorticity (PV) and
 $\left\langle \unicode[STIX]{x1D713}\unicode[STIX]{x1D702}_{x}\right\rangle$
is the domain-averaged topographic form stress. (All quantities are fully defined in § 2.)
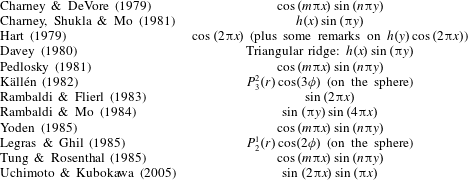
Various idealized topographies previously used in the literature.

This model may be pertinent to the Southern Ocean. There, the absence of continental boundaries along a range of latitudes implies that a large-scale pressure gradient cannot be invoked in balancing the zonal wind stress. We emphasize, however, that the model in (1.1) and (2.3) may also be relevant in a small region of the ocean away from any continental boundaries, where we expect a statistically homogeneous eddy field. Although the model has been derived previously by several authors, it has never been investigated in detail except under severe low-order spectral truncations, and only for the simplest model topographies summarized in table 1. Here, we delineate the various flow regimes of geostrophic turbulence above a homogeneous, isotropic and monoscale topography, e.g. the topography shown in figure 2.
Similar models have been developed in meteorology in order to understand stationary waves and blocking patterns. Charney & DeVore (Reference Charney and Devore1979) introduced a reduced model of the interaction of zonal flow and topography and demonstrated the possibility of multiple equilibrium states, one of which corresponds to a topographically blocked flow. Charney & DeVore (Reference Charney and Devore1979) paved the way for the studies summarized in table 1, which are directed at understanding the existence of multiple stable solutions to systems such as (1.1). This meteorological literature is mainly concerned with planetary-scale topography, e.g. note the use of low-order spherical harmonics and small wavenumbers in table 1. Here, reflecting our interest in oceanographic issues, we consider smaller-scale topography such as features with 10–100 km scale, i.e. topography with roughly the same scale as ocean macroturbulence. Despite this difference, we also find a regime with multiple stable states and hysteresis (§ 4).


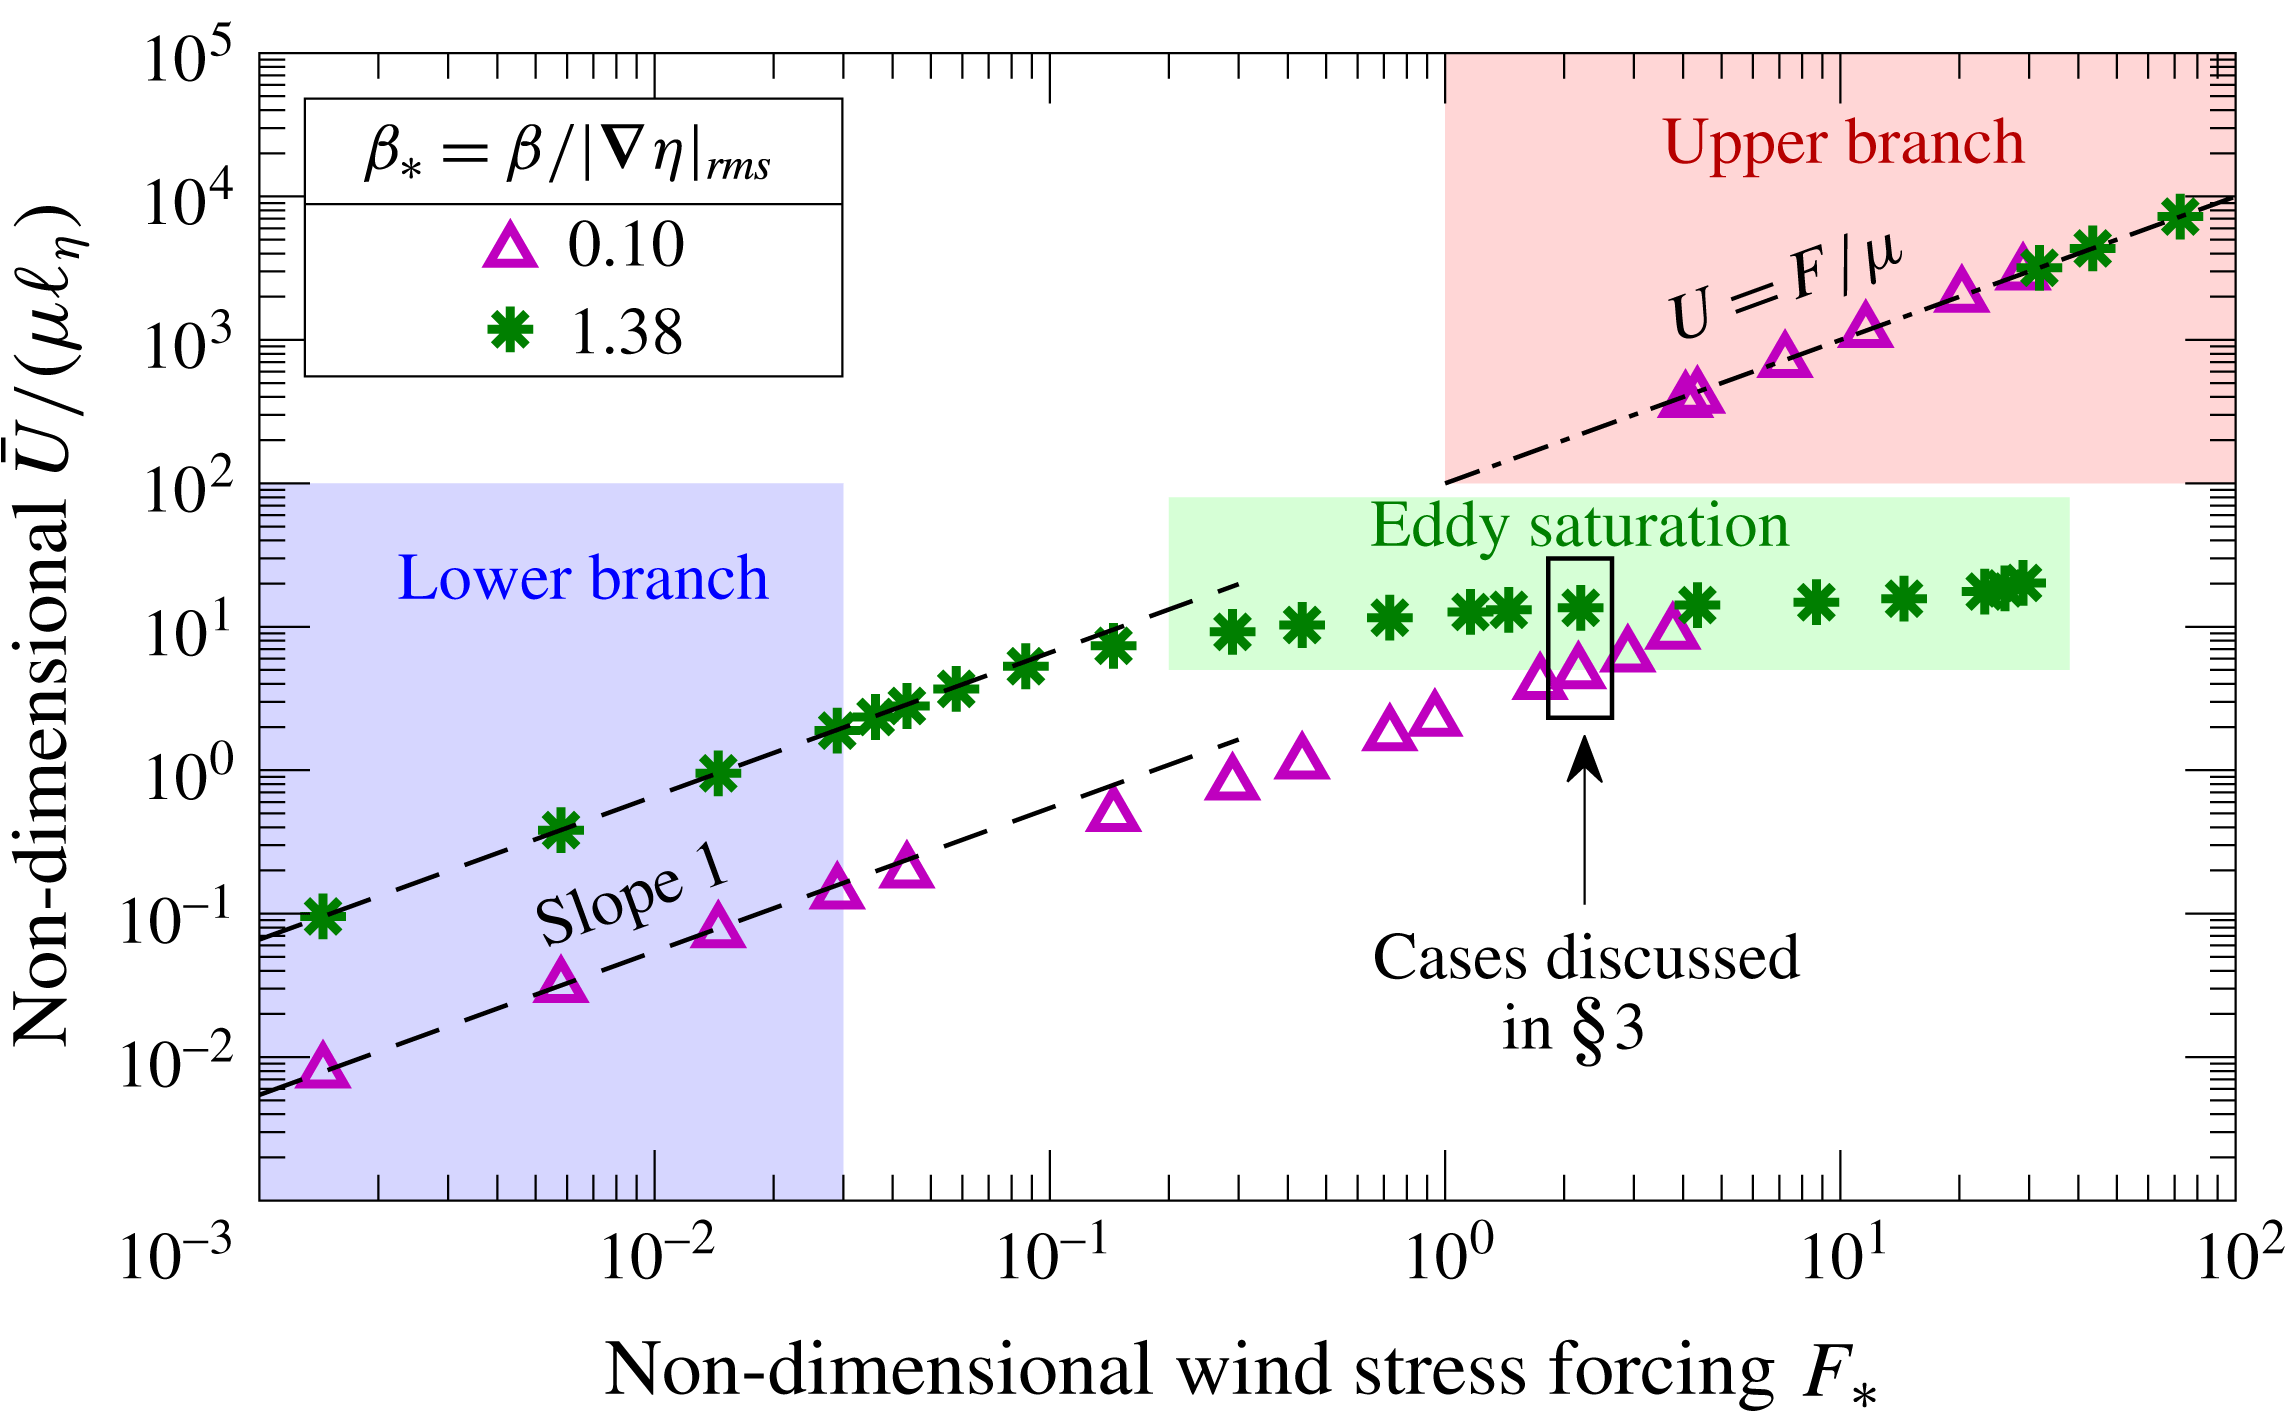
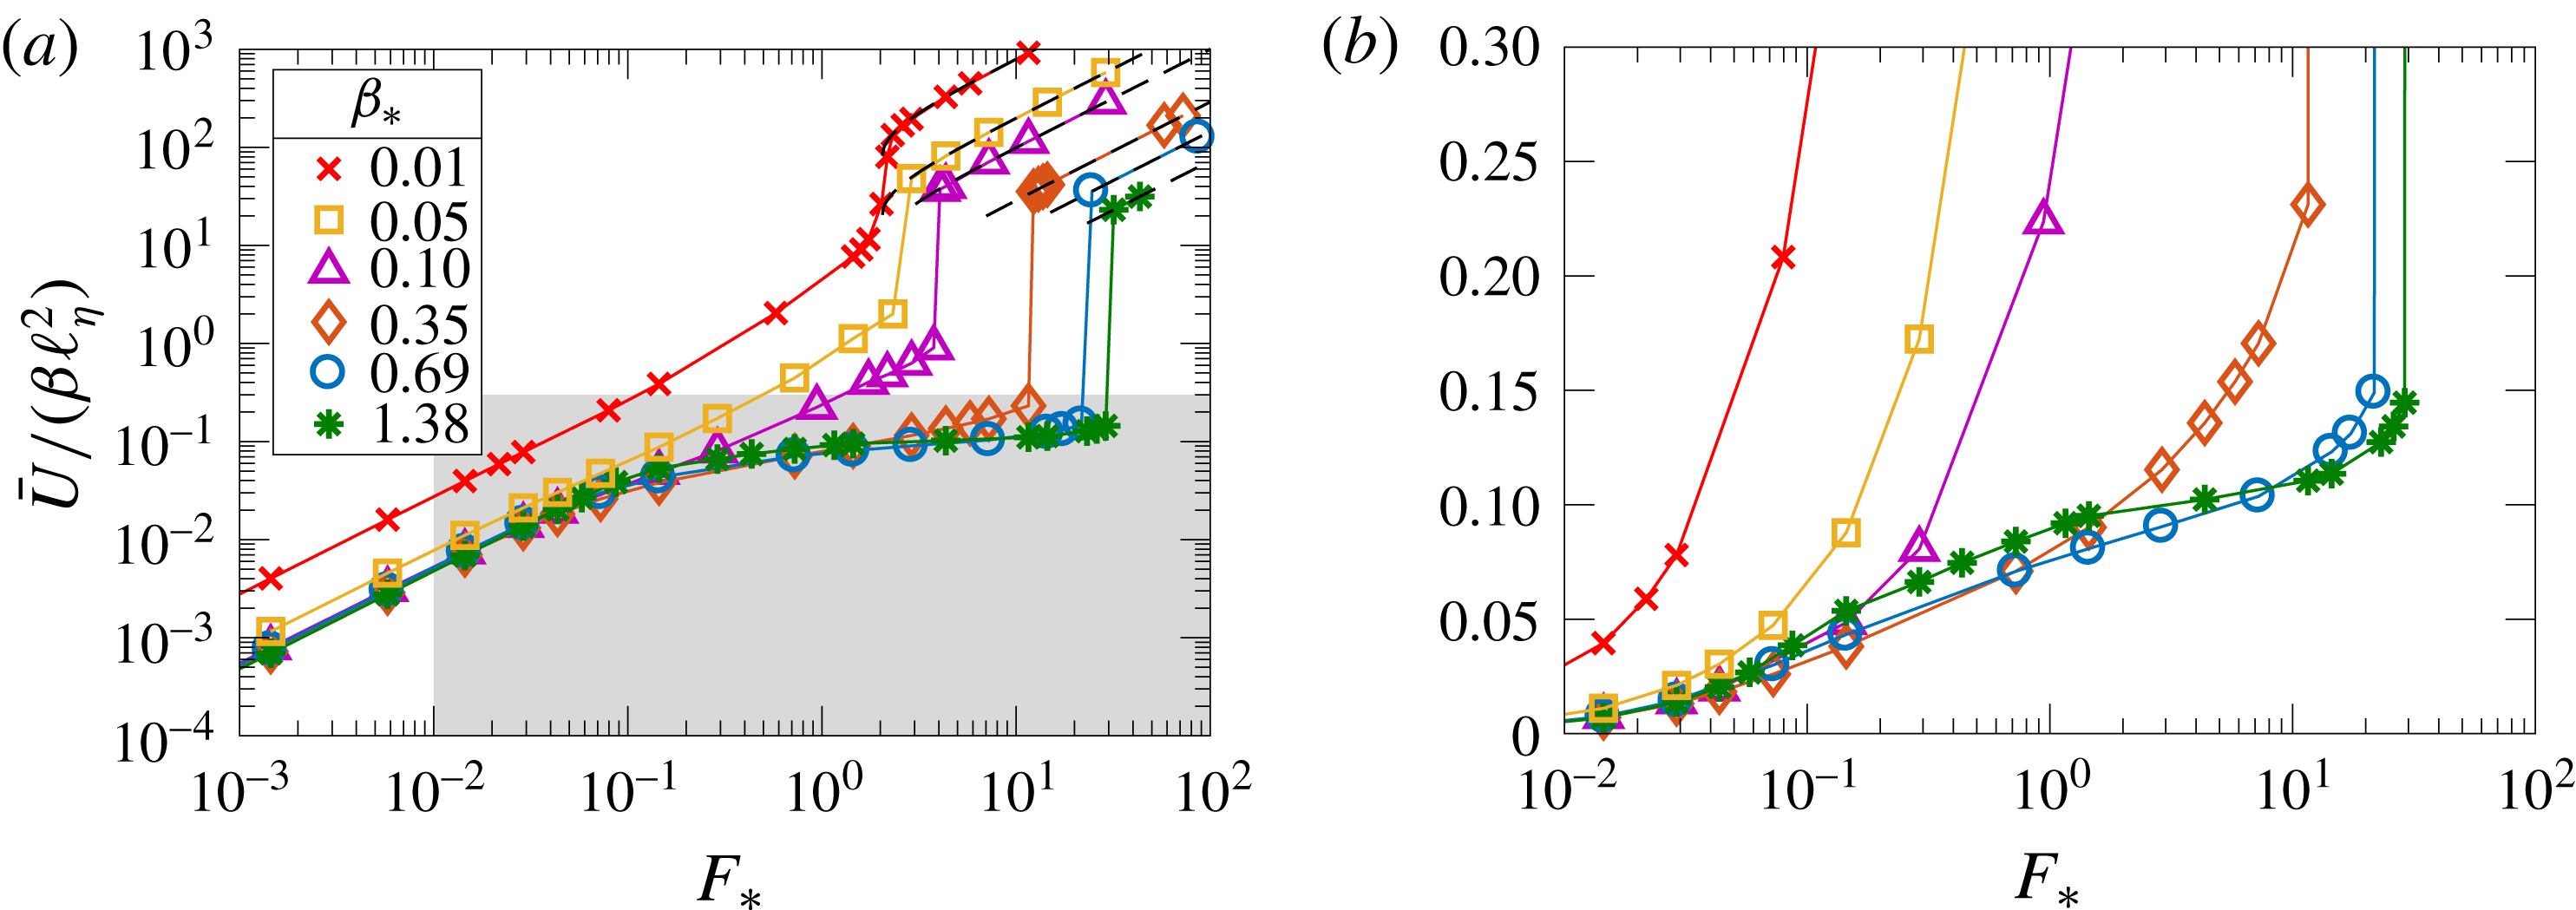
Figure 1 summarizes our main result by showing how the time-mean large-scale flow
 $\bar{U}$
varies with increasing wind-stress forcing
 $F$
. The two solution suites shown in figure 1 represent two end points corresponding to either closed geostrophic contours (small value of
 $\unicode[STIX]{x1D6FD}_{\ast }$
, which is the ratio of the planetary PV gradient to the root mean square (r.m.s.) topographic PV gradient) or open geostrophic contours (large
 $\unicode[STIX]{x1D6FD}_{\ast }$
). In both cases, there are two flow regimes in which the flow is steady without transient eddies: the ‘lower branch’ and the ‘upper branch’ (indicated in figure 1). The mean flow
 $\bar{U}$
varies linearly with
 $F$
on both the lower and the upper branches. On the upper branch, form stress
 $\left\langle \unicode[STIX]{x1D713}\unicode[STIX]{x1D702}_{x}\right\rangle$
is negligible and
 $U\approx F/\unicode[STIX]{x1D707}$
. On the lower branch, the forcing
 $F$
is weak and the dynamics is linear. Furthermore, for both small and large
 $\unicode[STIX]{x1D6FD}_{\ast }$
, the transition regime between the upper and lower branches is terminated by a ‘drag crisis’ at which the form stress abruptly vanishes and the system jumps discontinuously to the upper branch. The lower and upper branches, and the drag crisis, are largely anticipated by results from low-order truncated models.
The phenomenology of the transition region is, however, unanticipated by low-order models: the lower branch becomes unstable at a critical value of
 $F$
, and further increase of
 $F$
above the critical value results in transient eddies and active geostrophic turbulence. The turbulent transition regime is qualitatively different for the two values of
 $\unicode[STIX]{x1D6FD}_{\ast }$
in figure 1. For open geostrophic contours (large
 $\unicode[STIX]{x1D6FD}_{\ast }$
), the flow is homogeneously distributed over the domain and
 $\bar{U}$
is almost constant as the forcing
 $F$
increases. For closed geostrophic contours (small
 $\unicode[STIX]{x1D6FD}_{\ast }$
), the flow is spatially inhomogeneous and is channelled into narrow boundary layers separating almost stagnant ‘dead zones’; in this case,
 $\bar{U}$
continues to vary roughly linearly with
 $F$
. The representative transition-regime solutions indicated in figure 1 are discussed further in §§ 3.4 and 3.5.
The insensitivity of time-mean large-scale flow
 $\bar{U}$
to the strength of the wind stress
 $F$
for the large-
 $\unicode[STIX]{x1D6FD}$
case in figure 1 is reminiscent of the ‘eddy saturation’ phenomenon identified in eddy-resolving models of the Southern Ocean (Hallberg & Gnanadesikan Reference Hallberg and Gnanadesikan2001; Tansley & Marshall Reference Tansley and Marshall2001; Hallberg & Gnanadesikan Reference Hallberg and Gnanadesikan2006; Hogg et al.
Reference Hogg, Meredith, Blundell and Wilson2008; Nadeau & Straub Reference Nadeau and Straub2009; Farneti et al.
Reference Farneti, Delworth, Rosati, Griffies and Zeng2010; Meredith et al.
Reference Meredith, Naveira Garabato, Hogg and Farneti2012; Nadeau & Straub Reference Nadeau and Straub2012; Morisson & Hogg Reference Morisson and Hogg2013; Munday, Johnson & Marshall Reference Munday, Johnson and Marshall2013; Farneti & Coauthors Reference Farneti, Downes, Griffies, Marsland, Behrens, Bentsen, Bi, Bias-toch, Böning and Bozec2015; Nadeau & Ferrari Reference Nadeau and Ferrari2015). Some indications of eddy saturation appear also in observations of the Southern Ocean (Böning et al.
Reference Böning, Dispert, Visbeck, Rintoul and Schwarzkopf2008; Firing, Chereskin & Mazloff Reference Firing, Chereskin and Mazloff2011; Hogg et al.
Reference Hogg, Meredith, Chambers, Abrahamsen, Hughes and Morrison2015). Eddy saturation is of great interest because there is an observed trend of increasing strength of the westerly winds over the Southern Ocean (Thompson & Solomon Reference Thompson and Solomon2002; Marshall Reference Marshall2003; Swart & Fyfe Reference Swart and Fyfe2012), raising the question of how the transport of the Antarctic Circumpolar Current will change. Straub (Reference Straub1993) first predicted that the transport should become insensitive to the wind-stress forcing at sufficiently high wind stress. However, Straub’s argument invoked baroclinicity and channel walls as crucial ingredients for eddy saturation. Following Straub, most previous explanations of eddy saturation argue that the transport is linearly proportional to the isopycnal slopes, and these slopes have a hard maximum set by the marginal condition for baroclinic instability. Thus, we are surprised here to discover that a single-layer fluid in a doubly periodic geometry exhibits impressive eddy saturation: in figure 1 the time-mean large-scale flow
 $\bar{U}$
only doubles as
 $F_{\ast }$
varies from 0.2 to 30. We discuss this ‘barotropic eddy saturation’ further in § 8 and we speculate on its relation to the baroclinic eddy saturation exhibited by Southern Ocean models in the conclusion (§ 9).
2 Formulation
We consider barotropic flow in a beta-plane fluid layer with depth
 $H-h(x,y)$
, where
 $h(x,y)/H$
is of order Rossby number. The fluid velocity consists of a large-scale zonal flow,
 $U(t)$
, along the
 $x$
-axis plus smaller-scale eddies with velocity
 $(u,v)$
; thus, the total flow is
 $$\begin{eqnarray}\boldsymbol{U}\stackrel{\text{def}}{=}\left(U(t)+u(x,y,t),v(x,y,t)\right)\!.\end{eqnarray}$$
The eddying component of the flow is derived from an eddy streamfunction
 $\unicode[STIX]{x1D713}(x,y,t)$
via
 $(u,v)=(-\unicode[STIX]{x1D713}_{y},\unicode[STIX]{x1D713}_{x})$
; the total streamfunction is
 $-U(t)y+\unicode[STIX]{x1D713}(x,y,t)$
, with the large-scale flow
 $U(t)$
evolving as in (1.1). The relative vorticity is
 $\unicode[STIX]{x1D701}=\unicode[STIX]{x1D6FB}^{2}\unicode[STIX]{x1D713}$
, and the QGPV is
 $$\begin{eqnarray}f_{0}+\unicode[STIX]{x1D6FD}y+\underbrace{\unicode[STIX]{x1D701}+\unicode[STIX]{x1D702}}_{\stackrel{\text{def}}{=}q}.\end{eqnarray}$$
Here,
 $f_{0}$
is the Coriolis parameter in the centre of the domain,
 $\unicode[STIX]{x1D6FD}$
is the meridional planetary PV gradient and
 $\unicode[STIX]{x1D702}(x,y)=f_{0}h(x,y)/H$
is the topographic contribution to the PV or simply the topographic PV. The QGPV equation is
 $$\begin{eqnarray}q_{t}+\text{J}(\unicode[STIX]{x1D713}-Uy,q+\unicode[STIX]{x1D6FD}y)+\text{D}\unicode[STIX]{x1D701}=0,\end{eqnarray}$$
where
 $\text{J}$
is the Jacobian,
 $\text{J}(a,b)\stackrel{\text{def}}{=}a_{x}b_{y}-a_{y}b_{x}$
. With Navier–Stokes viscosity
 $\unicode[STIX]{x1D708}$
and linear Ekman drag
 $\unicode[STIX]{x1D707}$
, the ‘dissipation operator’
 $\text{D}$
in (2.3) is
 $$\begin{eqnarray}\text{D}\stackrel{\text{def}}{=}\unicode[STIX]{x1D707}-\unicode[STIX]{x1D708}\unicode[STIX]{x1D6FB}^{2}.\end{eqnarray}$$
The domain is periodic in both the zonal and meridional directions, with size
 $2\unicode[STIX]{x03C0}L\times 2\unicode[STIX]{x03C0}L$
. In numerical solutions, instead of the Navier–Stokes viscosity
 $\unicode[STIX]{x1D708}\unicode[STIX]{x1D6FB}^{2}$
in (2.4), we use either hyperviscosity
 $\unicode[STIX]{x1D708}_{4}\unicode[STIX]{x1D6FB}^{8}$
or a high-wavenumber filter. Thus, we achieve a regime in which the role of lateral dissipation is limited to the removal of small-scale vorticity: the lateral dissipation has a very small effect on larger scales and energy dissipation is mainly due to Ekman drag,
 $\unicode[STIX]{x1D707}$
. Therefore, we generally neglect
 $\unicode[STIX]{x1D708}$
except when discussing the enstrophy balance, in which
 $\unicode[STIX]{x1D708}$
is an important sink.
The energy and enstrophy of the fluid are defined through
 $$\begin{eqnarray}E\stackrel{\text{def}}{=}\underbrace{{\textstyle \frac{1}{2}}U^{2}}_{\stackrel{\text{def}}{=}E_{U}}+\underbrace{{\textstyle \frac{1}{2}}\langle |\unicode[STIX]{x1D735}\unicode[STIX]{x1D713}|^{2}\rangle }_{\stackrel{\text{def}}{=}E_{\unicode[STIX]{x1D713}}}\quad \text{and}\quad Q\stackrel{\text{def}}{=}\underbrace{\unicode[STIX]{x1D6FD}U}_{\stackrel{\text{def}}{=}Q_{U}}+\underbrace{{\textstyle \frac{1}{2}}\langle q^{2}\rangle }_{\stackrel{\text{def}}{=}Q_{\unicode[STIX]{x1D713}}}.\end{eqnarray}$$
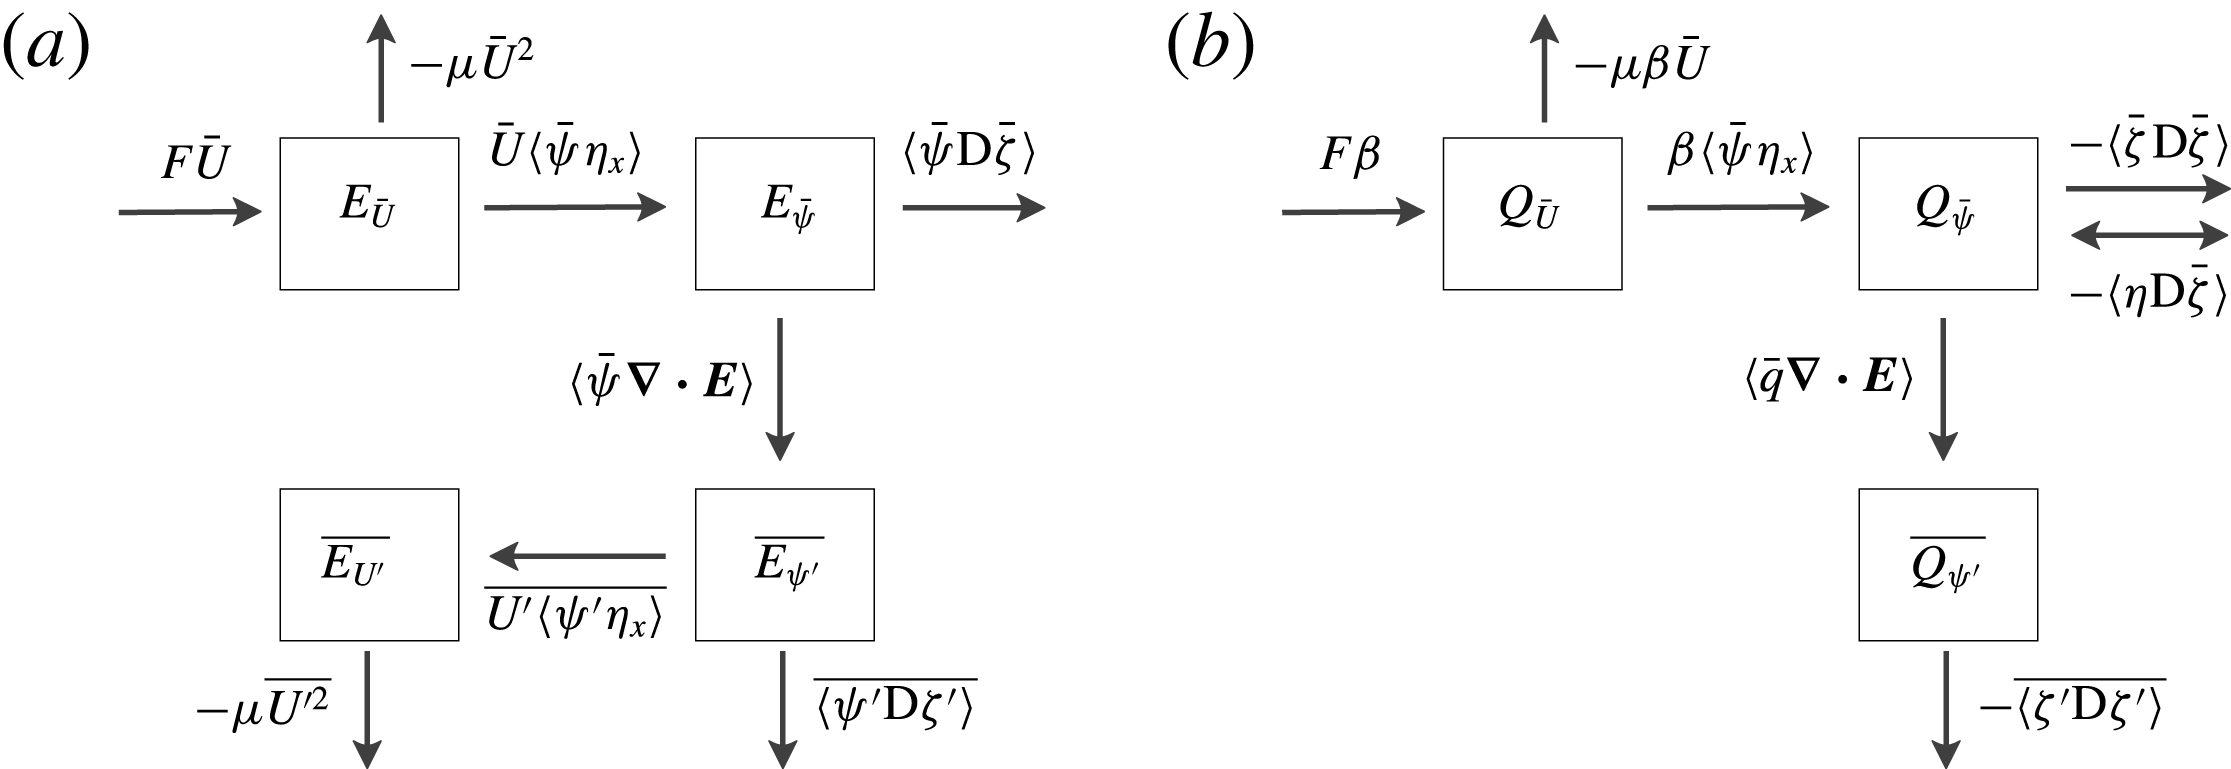
Appendix A summarizes the energy and enstrophy balances among the various flow components.
The model formulated in (1.1) and (2.3) is the simplest process model that can used to investigate homogeneous beta-plane turbulence driven by a large-scale wind stress applied at the surface of the fluid.
Although the forcing
 $F$
in (1.1) is steady, the solution often is not: with strong forcing, the flow spontaneously develops time-varying eddies. In these cases, it is useful to decompose the eddy streamfunction
 $\unicode[STIX]{x1D713}$
into time-mean ‘standing eddies’, with streamfunction
 $\bar{\unicode[STIX]{x1D713}}$
, and residual ‘transient eddies’
 $\unicode[STIX]{x1D713}^{\prime }$
,
 $$\begin{eqnarray}\unicode[STIX]{x1D713}(x,y,t)=\bar{\unicode[STIX]{x1D713}}(x,y)+\unicode[STIX]{x1D713}^{\prime }(x,y,t).\end{eqnarray}$$
All fields can be similarly decomposed into time-mean and transient components, e.g.
 $U(t)=\bar{U}+U^{\prime }(t)$
. A main question is how
 $\bar{U}$
depends on
 $F$
,
 $\unicode[STIX]{x1D707}$
and
 $\unicode[STIX]{x1D6FD}$
, as well as the statistical and geometrical properties of the topographic PV
 $\unicode[STIX]{x1D702}$
.
The form stress
 $\left\langle \unicode[STIX]{x1D713}\unicode[STIX]{x1D702}_{x}\right\rangle$
in (1.1) necessarily acts as increased frictional drag on the large-scale mean flow
 $U$
. This becomes apparent from the energy balance of the eddy field, which is obtained through
 $\overline{\langle -\unicode[STIX]{x1D713}\times (2.3)\rangle }$
,
 $$\begin{eqnarray}\overline{U\langle \unicode[STIX]{x1D713}\unicode[STIX]{x1D702}_{x}\rangle }=\overline{\left\langle \unicode[STIX]{x1D707}|\unicode[STIX]{x1D735}\unicode[STIX]{x1D713}|^{2}+\unicode[STIX]{x1D708}\unicode[STIX]{x1D701}^{2}\right\rangle }.\end{eqnarray}$$
The right-hand side of (2.7) is positive definite, and thus
 $U(t)$
is positively correlated with the form stress
 $\langle \unicode[STIX]{x1D713}\unicode[STIX]{x1D702}_{x}\rangle$
; i.e., on average, the topographic form stress acts as an increased drag on the large-scale flow
 $U$
.
3 Topography, parameter values and illustrative solutions
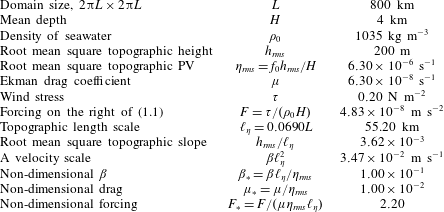
Although the barotropic QG model summarized in § 2 is idealized, it is instructive to estimate
 $U$
using numbers loosely inspired by the dynamics of the Southern Ocean; see table 2. Without form stress, the equilibrated large-scale velocity obtained from the large-scale momentum equation (1.1) using
 $F$
from table 2 is
 $$\begin{eqnarray}F/\unicode[STIX]{x1D707}=0.77~\text{m}~\text{s}^{-1}.\end{eqnarray}$$
The main point made by Munk & Palmén (Reference Munk and Palmén1951) is that this drag-balanced large-scale velocity is far too large. For example, the implied transport through a meridional section 1000 km long is over
 $3\times 10^{9}~\text{m}^{3}~\text{s}^{-1}$
; this is larger by a factor of approximately 20 than the observed transport of the Antarctic Circumpolar Current (Donohue et al.
Reference Donohue, Tracey, Watts, Chidichimo and Chereskin2016; Koenig et al.
Reference Koenig, Provost, Park, Ferrari and Sennéchael2016).
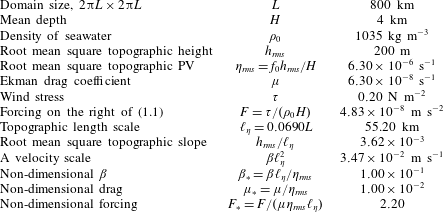
Numerical values characteristic of the Southern Ocean;
 $f_{0}=-1.26\times 10^{-4}~\text{s}^{-1}$
and
 $\unicode[STIX]{x1D6FD}=1.14\times 10^{-11}~\text{m}^{-1}~\text{s}^{-1}$
. The drag coefficient
 $\unicode[STIX]{x1D707}$
is taken from Arbic & Flierl (Reference Arbic and Flierl2004).
3.1 The topography
If the topographic height has an r.m.s. value of order 200 m, typical of abyssal hills (Goff Reference Goff2010), then
 $\unicode[STIX]{x1D702}_{\mathit{rms}}^{-1}$
is less than two days. Thus, even rather small topographic features produce a topographic PV with a time scale that is much less than that of the typical drag coefficient in table 2. This order-of-magnitude estimate indicates that the form stress is likely to be large. To say more about form stress we must introduce the model topography with more detail.
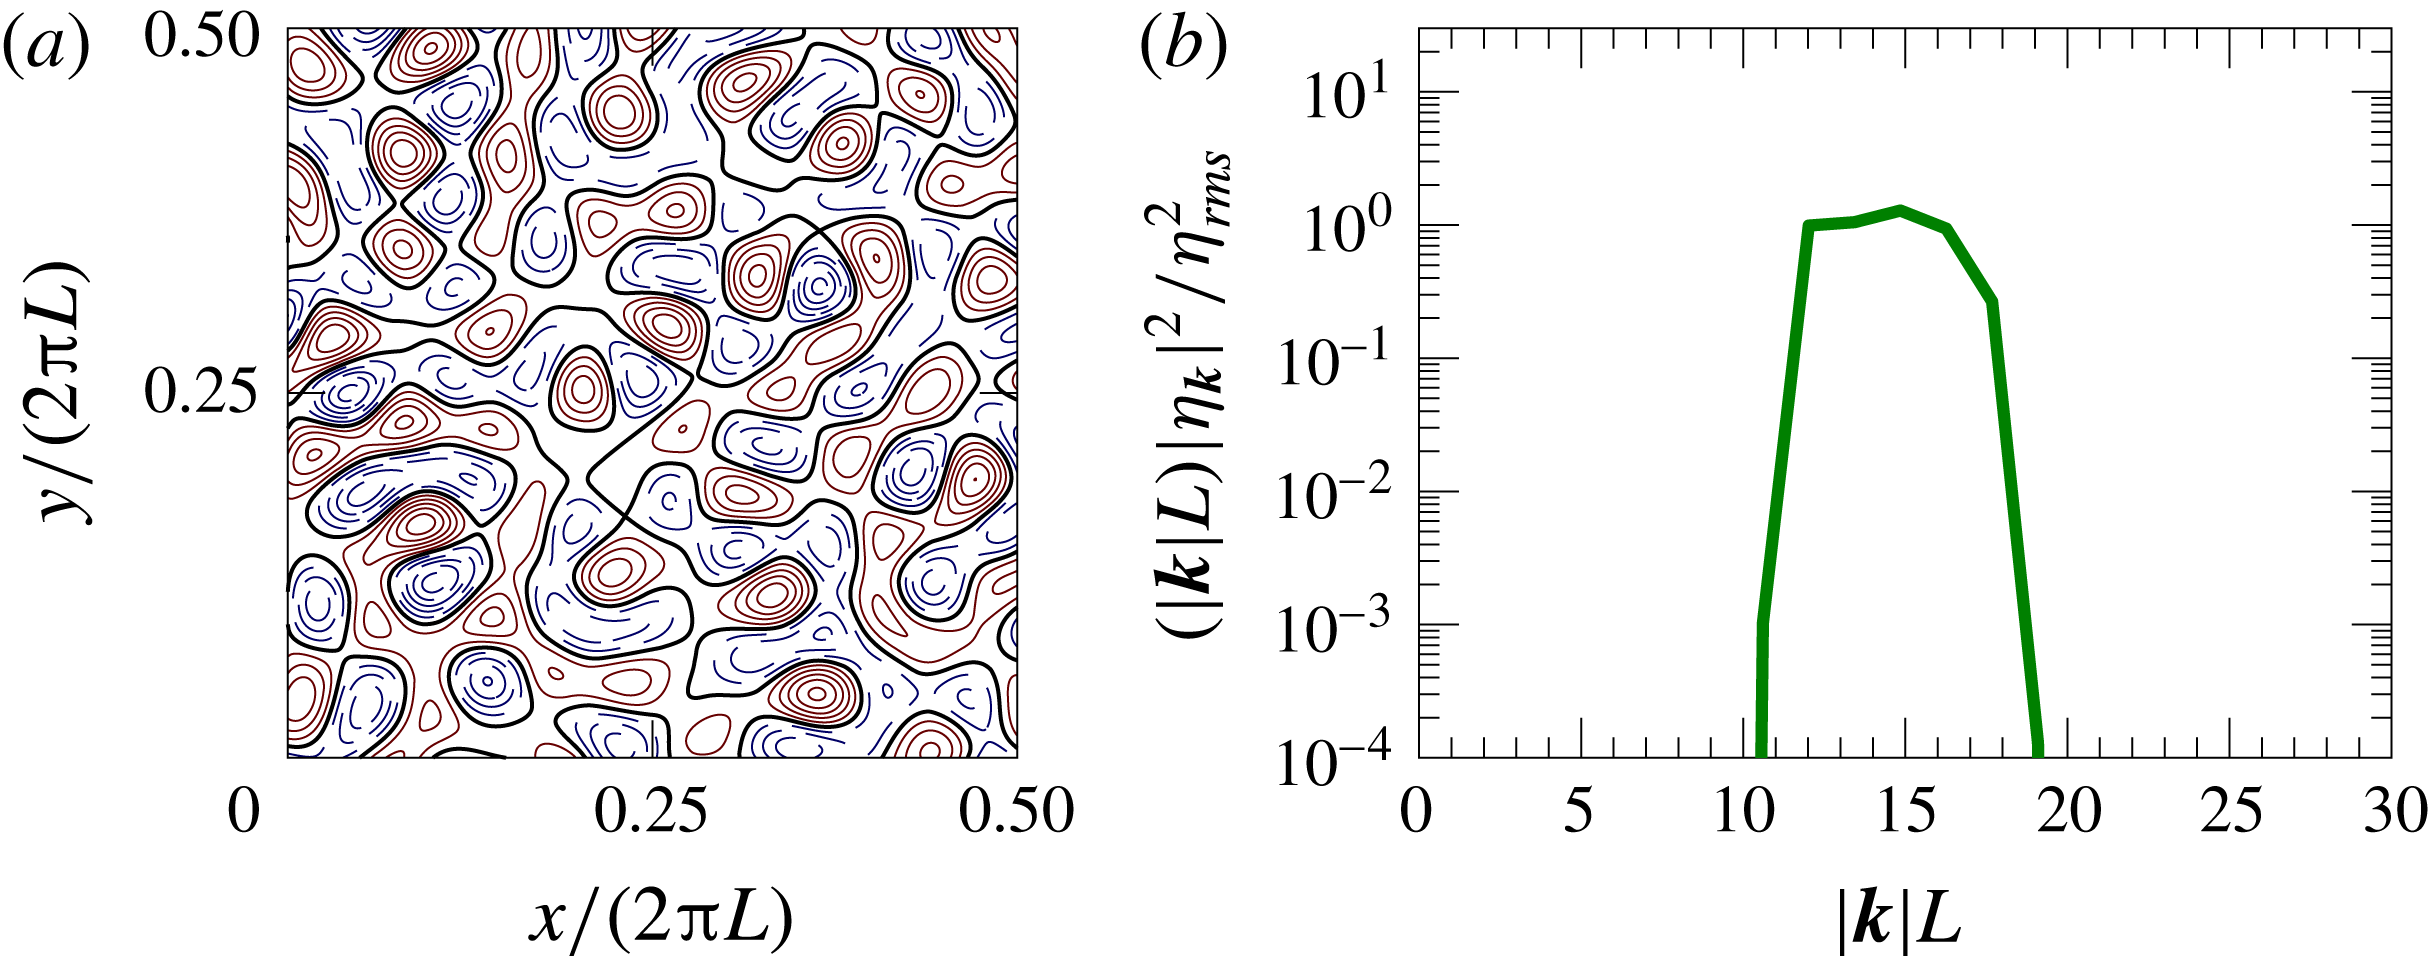
The structure and spectrum of the topography used in this study. (a) The structure of the topography for a quarter of the full domain. The solid curves are positive contours, the dashed curves are negative contours and the thick curves mark the zero contour. (b) The 1D power spectrum. The topography has power only within the annulus
 $12\leqslant |\boldsymbol{k}|L\leqslant 18$
.

The structure of the geostrophic contours,
 $\unicode[STIX]{x1D6FD}y+\unicode[STIX]{x1D702}$
, for the monoscale topography of figure 2 and for various values of
 $\unicode[STIX]{x1D6FD}_{\ast }$
: (a)
 $\unicode[STIX]{x1D6FD}_{\ast }=0.10$
, (b)
 $\unicode[STIX]{x1D6FD}_{\ast }=0.35$
and (c)
 $\unicode[STIX]{x1D6FD}_{\ast }=1.38$
. It is difficult to visually distinguish the geostrophic contours with
 $\unicode[STIX]{x1D6FD}_{\ast }=0$
from those with
 $\unicode[STIX]{x1D6FD}_{\ast }=0.1$
in (a).

The topography is synthesized as
 $\unicode[STIX]{x1D702}(x,y)=\sum _{\boldsymbol{k}}\text{e}^{\text{i}\boldsymbol{k}\boldsymbol{\cdot }\boldsymbol{x}}\unicode[STIX]{x1D702}_{\boldsymbol{k}}$
, with random phases for
 $\unicode[STIX]{x1D702}_{\boldsymbol{k}}$
. We consider a homogeneous and isotropic topographic model illustrated in figure 2. The topography is constructed by confining the wavenumbers
 $\unicode[STIX]{x1D702}_{\boldsymbol{k}}$
to a relatively narrow annulus with
 $12\leqslant |\boldsymbol{k}|L\leqslant 18$
. The spectral cutoff is tapered smoothly to zero at the edges of the annulus. In addition to being homogeneous and isotropic, the topographic model in figure 2 is approximately monoscale, i.e. the topography is characterized by a single length scale, determined, for instance, by the central wavenumber
 $|\boldsymbol{k}|\approx 15/L$
in figure 2(b). To assess the validity of the monoscale approximation, we characterize the topography using the length scales
 $$\begin{eqnarray}\ell _{\unicode[STIX]{x1D702}}\stackrel{\text{def}}{=}\sqrt{\left\langle \unicode[STIX]{x1D702}^{2}\right\rangle /\left\langle |\unicode[STIX]{x1D735}\unicode[STIX]{x1D702}|^{2}\right\rangle }\quad \text{and}\quad L_{\unicode[STIX]{x1D702}}\stackrel{\text{def}}{=}\sqrt{\left\langle |\unicode[STIX]{x1D735}\unicode[STIX]{x1D6FB}^{-2}\unicode[STIX]{x1D702}|^{2}\right\rangle /\left\langle \unicode[STIX]{x1D702}^{2}\right\rangle }.\end{eqnarray}$$
For the model in figure 2,
 $$\begin{eqnarray}\ell _{\unicode[STIX]{x1D702}}=0.0690L\quad \text{and}\quad L_{\unicode[STIX]{x1D702}}=0.0707L.\end{eqnarray}$$
(It should be recalled that the domain size is
 $2\unicode[STIX]{x03C0}L\times 2\unicode[STIX]{x03C0}L$
.) Because
 $\ell _{\unicode[STIX]{x1D702}}\approx L_{\unicode[STIX]{x1D702}}$
, we conclude that the topography in figure 2 is monoscale to a good approximation, and we use the slope-based length
 $\ell _{\unicode[STIX]{x1D702}}$
as the typical length scale of the topography.
The isotropic homogeneous monoscale topographic model adopted here has no claims to realism. However, the monoscale assumption greatly simplifies many aspects of the problem because all relevant second-order statistical characteristics of the model topography can be expressed in terms of the two-dimensional quantities
 $\unicode[STIX]{x1D702}_{\mathit{rms}}$
and
 $\ell _{\unicode[STIX]{x1D702}}$
, e.g.
 $\langle (\unicode[STIX]{x1D6FB}^{-2}\unicode[STIX]{x1D702}_{x})^{2}\rangle =\ell _{\unicode[STIX]{x1D702}}^{2}\unicode[STIX]{x1D702}_{\mathit{rms}}^{2}/2$
. The main advantage of monoscale topography is that, despite the simplicity of its spectral characterization, it exhibits the crucial distinction between open and closed geostrophic contours; see figure 3.
3.2 Non-dimensionalization
There are four time scales in the problem: the topographic PV
 $\unicode[STIX]{x1D702}_{\mathit{rms}}^{-1}$
, the dissipation
 $\unicode[STIX]{x1D707}^{-1}$
, the period of topographically excited Rossby waves
 $(\unicode[STIX]{x1D6FD}\ell _{\unicode[STIX]{x1D702}})^{-1}$
and the advective time scale associated with the forcing
 $\ell _{\unicode[STIX]{x1D702}}\unicode[STIX]{x1D707}/F$
. From these four time scales, we construct the three main non-dimensional control parameters:
 $$\begin{eqnarray}\unicode[STIX]{x1D707}_{\ast }\stackrel{\text{def}}{=}\unicode[STIX]{x1D707}/\unicode[STIX]{x1D702}_{\mathit{rms}},\quad \unicode[STIX]{x1D6FD}_{\ast }\stackrel{\text{def}}{=}\unicode[STIX]{x1D6FD}\ell _{\unicode[STIX]{x1D702}}/\unicode[STIX]{x1D702}_{\mathit{rms}}\quad \text{and}\quad F_{\ast }\stackrel{\text{def}}{=}F/(\unicode[STIX]{x1D707}\unicode[STIX]{x1D702}_{\mathit{rms}}\ell _{\unicode[STIX]{x1D702}}).\end{eqnarray}$$
The parameter
 $\unicode[STIX]{x1D6FD}_{\ast }$
is the ratio of the planetary PV gradient over the r.m.s. topographic PV gradient. There is a fourth parameter
 $L/\ell _{\unicode[STIX]{x1D702}}$
which measures the scale separation between the domain and the topography. We assume that as
 $L/\ell _{\unicode[STIX]{x1D702}}\rightarrow \infty$
, there is a regime of statistically homogeneous two-dimensional turbulence. In other words, as
 $L/\ell _{\unicode[STIX]{x1D702}}\rightarrow \infty$
, the flow becomes asymptotically independent of
 $L/\ell _{\unicode[STIX]{x1D702}}$
, so that the large-scale flow
 $\bar{U}$
and other statistics, such as
 $\overline{E_{\unicode[STIX]{x1D713}}}$
, are independent of the domain size
 $L$
.
Besides the control parameters in (3.4), additional parameters are required to characterize the topography. For example, in the case of a multiscale topography, the ratio
 $L_{\unicode[STIX]{x1D702}}/\ell _{\unicode[STIX]{x1D702}}$
characterizes the spectral width of the power-law range. Another simplification of the monoscale topography is that we do not have to contend with these additional topographic parameters.
3.3 Geostrophic contours
We refer to the contours of constant
 $\unicode[STIX]{x1D6FD}y+\unicode[STIX]{x1D702}$
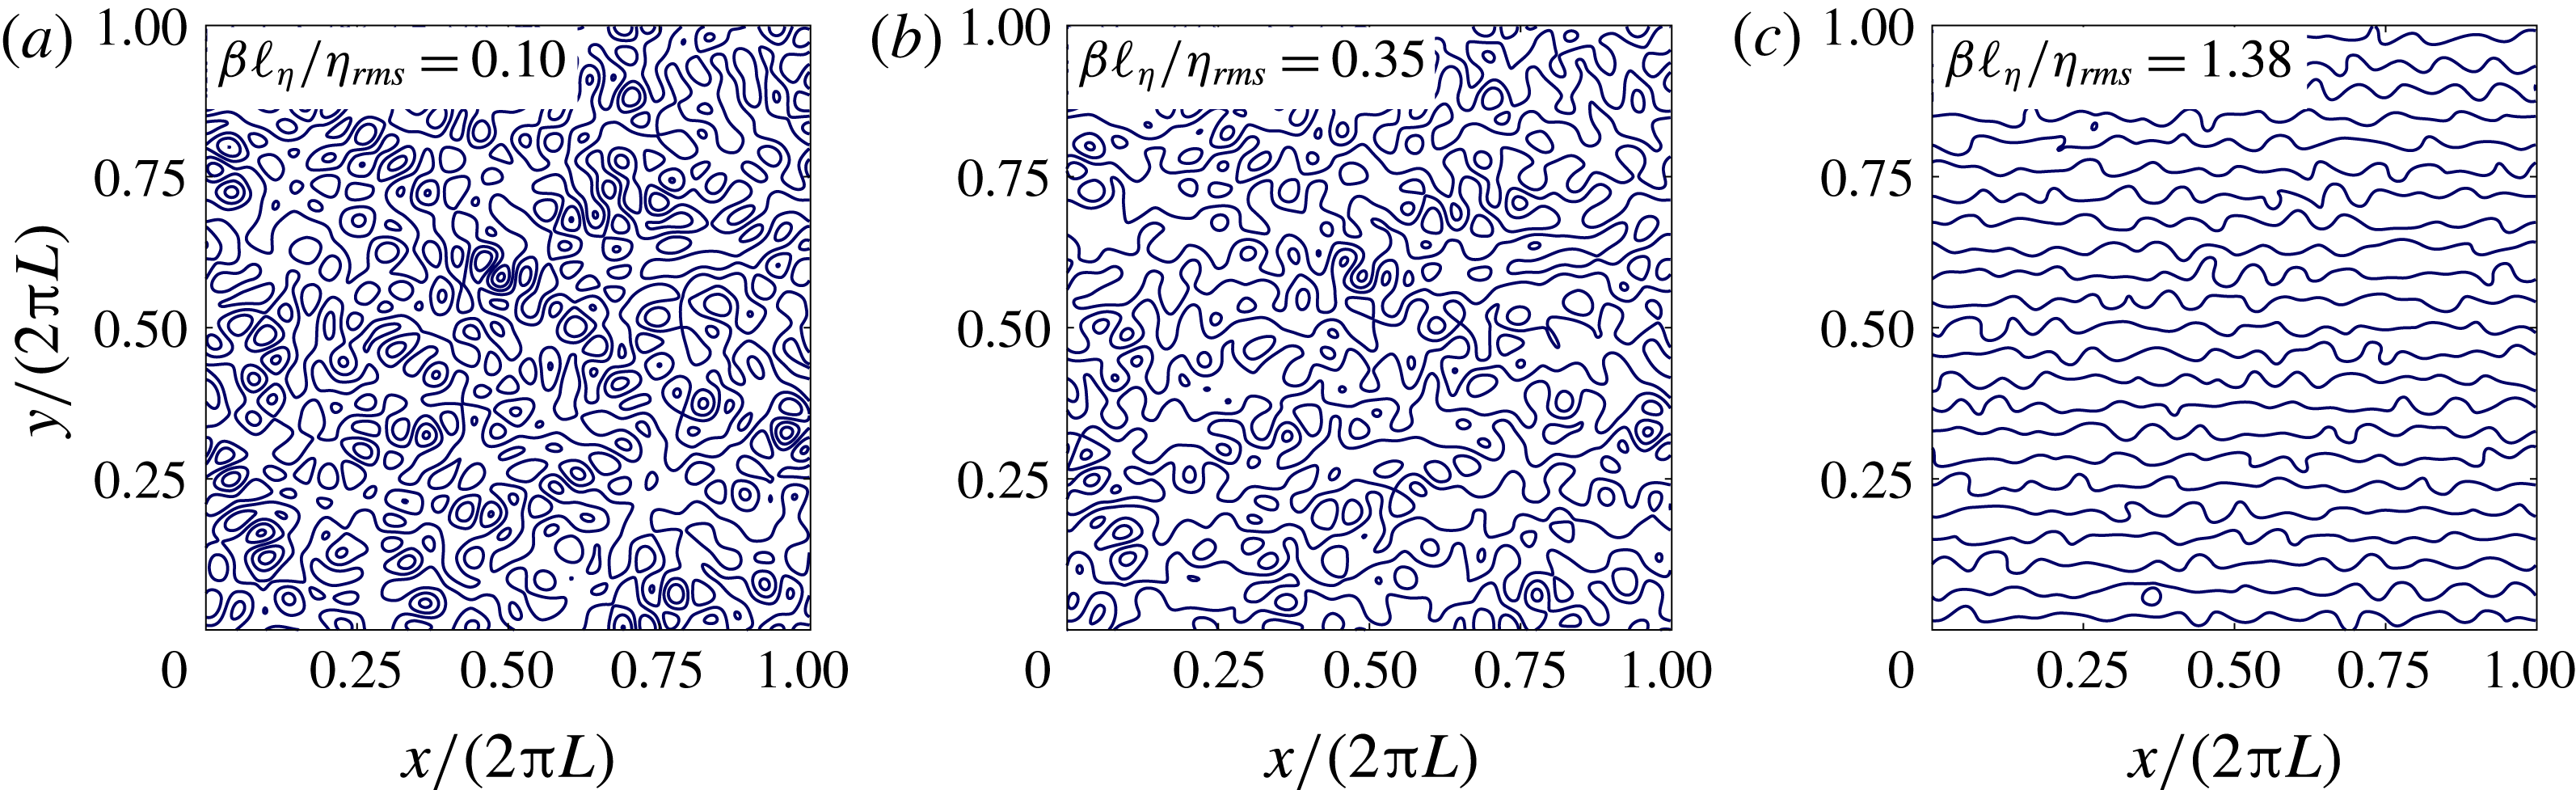
as the geostrophic contours. Closed geostrophic contours enclose isolated pools within the domain – see figure 3(a) – while open geostrophic contours thread through the domain in the zonal direction, connecting one side to the other – see figure 3(c). The transition between the two limiting cases is controlled by
 $\unicode[STIX]{x1D6FD}_{\ast }$
. Figure 3(b) shows an intermediate case with a mixture of both closed and open geostrophic contours.
It is instructive to consider the extreme case
 $\unicode[STIX]{x1D6FD}=0$
. Then, only the geostrophic contour
 $\unicode[STIX]{x1D702}=0$
is open and all other geostrophic contours are closed. This intuitive conclusion relies on a special property of the random topography in figure 2: the topography
 $-\unicode[STIX]{x1D702}$
is statistically equivalent
 $+\unicode[STIX]{x1D702}$
. In other words, if
 $\unicode[STIX]{x1D702}(x,y)$
is in the ensemble, then so is
 $-\unicode[STIX]{x1D702}(x,y)$
. A more detailed discussion of this conclusion is given in the review paper by Isichenko (Reference Isichenko1992).
If
 $\unicode[STIX]{x1D6FD}$
is non-zero but small, in the sense that
 $\unicode[STIX]{x1D6FD}_{\ast }\ll 1$
, then most of the domain is within closed contours; see figure 3(a). The planetary PV gradient
 $\unicode[STIX]{x1D6FD}$
is too small relative to
 $\unicode[STIX]{x1D735}\unicode[STIX]{x1D702}$
to destroy local pools of closed geostrophic contours. However,
 $\unicode[STIX]{x1D6FD}$
dominates the long-range structure of the geostrophic contours and opens up narrow channels of open geostrophic contours.
The other extreme is
 $\unicode[STIX]{x1D6FD}_{\ast }\gg 1$
. In this case, illustrated in figure 3(c), all geostrophic contours are open. Because of its geometric simplicity, the situation with
 $\unicode[STIX]{x1D6FD}_{\ast }\gg 1$
is the easiest to analyse and understand. Unfortunately, the difficult case in figure 3(a) is the most relevant to oceanic conditions. In §§ 3.4 and 3.5, we illustrate the two cases using numerical solutions of (1.1) and (2.3).
A solution with closed geostrophic contours:
 $\unicode[STIX]{x1D6FD}_{\ast }=0.1$
,
 $F_{\ast }=2.20$
and
 $\unicode[STIX]{x1D707}_{\ast }=10^{-2}$
. (a) The evolution of the large-scale zonal flow
 $U(t)$
(dashed) and the form stress
 $\langle \unicode[STIX]{x1D713}\unicode[STIX]{x1D702}_{x}\rangle$
(solid). (b) The evolution of
 $E_{\unicode[STIX]{x1D713}}$
(solid) and
 $E_{U}$
(dashed). The dash-dotted line in (b) is the energy level of the standing eddies,
 $E_{\bar{\unicode[STIX]{x1D713}}}=\langle |\unicode[STIX]{x1D735}\bar{\unicode[STIX]{x1D713}}|^{2}\rangle /2$
. (c) A snapshot of the relative vorticity,
 $\unicode[STIX]{x1D701}$
(shaded), at
 $\unicode[STIX]{x1D707}t=10$
in one quarter of the domain overlying the topographic PV (the solid contours are positive
 $\unicode[STIX]{x1D702}$
and the dashed contours are negative). (d) The time mean
 $\bar{\unicode[STIX]{x1D701}}$
. A movie showing the evolution of
 $q=\unicode[STIX]{x1D701}+\unicode[STIX]{x1D702}$
and
 $\unicode[STIX]{x1D713}-Uy$
from rest is found in the supplementary material (movie 1) available at https://doi.org/10.1017/jfm.2017.482.

A solution with
 $\unicode[STIX]{x1D6FD}_{\ast }=0.1$
,
 $F_{\ast }=2.20$
and
 $\unicode[STIX]{x1D707}_{\ast }=10^{-2}$
. (a) The speed of the time-mean flow,
 $|\bar{\boldsymbol{U}}|$
, is indicated by colours; the geostrophic contours
 $\unicode[STIX]{x1D6FD}y+\unicode[STIX]{x1D702}$
are shown as white curves. (b) Surface plot of the total time-mean streamfunction,
 $\bar{\unicode[STIX]{x1D713}}-\bar{U}y$
.

3.4 An example with mostly closed geostrophic contours:
 $\unicode[STIX]{x1D6FD}_{\ast }=0.1$

Figures 4 and 5 show a numerical solution for a case with mostly closed geostrophic contours; this is the
 $\unicode[STIX]{x1D6FD}_{\ast }=0.1$
‘boxed’ point indicated in figure 1. In this illustration, we use the Southern Ocean parameter values given in table 2 with
 $1024^{2}$
grid points. The system is evolved using the ETDRK4 time-stepping scheme of Cox & Matthews (Reference Cox and Matthews2002) with the refinement of Kassam & Trefethen (Reference Kassam and Trefethen2005).
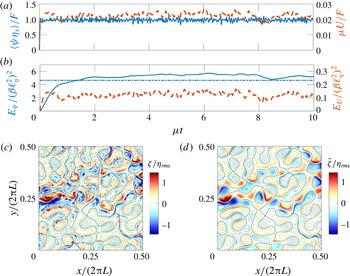
Figure 4(a) shows the evolution of the large-scale flow
 $U(t)$
and the form stress
 $\langle \unicode[STIX]{x1D713}\unicode[STIX]{x1D702}_{x}\rangle$
. After a spin-up of duration
 ${\sim}\unicode[STIX]{x1D707}^{-1}$
, the flow achieves a statistically steady state in which
 $U(t)$
fluctuates around the time mean
 $\bar{U}$
. In figure 4(a), the form stress
 $\langle \bar{\unicode[STIX]{x1D713}}\unicode[STIX]{x1D702}_{x}\rangle$
balances almost 98 % of
 $F$
, so that
 $U(t)$
is very much smaller than
 $F/\unicode[STIX]{x1D707}$
in (3.1). The time mean of the large-scale flow is
 $\bar{U}=1.70~\text{cm}~\text{s}^{-1}$
, which is 2.2 % of
 $F/\unicode[STIX]{x1D707}$
. Figure 4(b) shows the evolution of the energy. The eddy energy
 $E_{\unicode[STIX]{x1D713}}$
is approximately 50 times greater than the large-scale energy
 $E_{U}$
. With the decomposition of
 $\unicode[STIX]{x1D713}$
in (2.6), the time-mean eddy energy
 $\overline{E_{\unicode[STIX]{x1D713}}}$
is decomposed into
 $E_{\bar{\unicode[STIX]{x1D713}}}+\overline{E_{\unicode[STIX]{x1D713}^{\prime }}}$
; the dash-dotted line in figure 4(b) is the energy of the standing component
 $E_{\bar{\unicode[STIX]{x1D713}}}$
. The transient eddies are less energetic than the standing eddies. This is also evident by comparing the snapshot of the relative vorticity
 $\unicode[STIX]{x1D701}$
in figure 4(c) with the time mean
 $\bar{\unicode[STIX]{x1D701}}$
in figure 4(d). Many features in the snapshot are also seen in the time mean.
Figures 4(c) and 4(d) also show that there is anticorrelation between the time-mean relative vorticity and the topographic PV:
 $\text{corr}(\bar{\unicode[STIX]{x1D701}},\unicode[STIX]{x1D702})=-0.53$
, where the correlation between two fields
 $a$
and
 $b$
is
 $$\begin{eqnarray}\text{corr}(a,b)\stackrel{\text{def}}{=}\langle ab\rangle /\sqrt{\langle a^{2}\rangle \langle b^{2}\rangle }.\end{eqnarray}$$
Another statistical characterization of the solution is that
 $\text{corr}(\bar{\unicode[STIX]{x1D713}},\unicode[STIX]{x1D702}_{x})=0.06$
, showing that a weak correlation between the standing streamfunction
 $\bar{\unicode[STIX]{x1D713}}$
and the topographic PV gradient
 $\unicode[STIX]{x1D702}_{x}$
can produce a form stress balancing approximately 98 % of the applied wind stress.
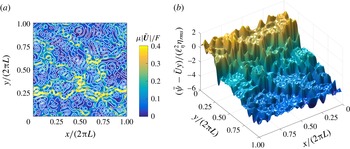
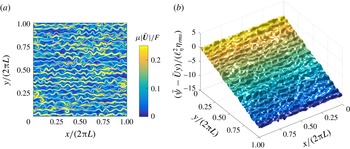
The most striking characterization of the time-mean flow is that it is very weak in most of the domain. Figure 5(a) shows that most of the flow through the domain is channelled into a relatively narrow band centred very roughly at
 $y/(2\unicode[STIX]{x03C0}L)=0.25$
. This ‘main channel’ coincides with the extreme values of
 $\unicode[STIX]{x1D701}$
and
 $\bar{\unicode[STIX]{x1D701}}$
evident in figure 4(c,d) (it should be noticed that figure 4(c,d) shows only a quarter of the flow domain). Outside the main channel, the time-mean flow is weak. We emphasize that
 $\bar{U}=1.70~\text{cm}~\text{s}^{-1}$
is an unoccupied mean that is not representative of the larger velocities in the main channel; the channel velocities are 40–50 times larger than
 $\bar{U}$
.
Figure 5(b) shows the streamfunction
 $\bar{\unicode[STIX]{x1D713}}(x,\!y)-\bar{U}y$
as a surface above the
 $(x,y)$
-plane. The time-mean streamfunction appears as a terraced hillside; the mean slope of the hillside is
 $-\bar{U}$
, and stagnant pools, with constant
 $\bar{\unicode[STIX]{x1D713}}-\bar{U}y$
, are the flat terraces carved into the hillside. The existence of these stagnant dead zones is explained by the closed-streamline theorems of Batchelor (Reference Batchelor1956) and Ingersoll (Reference Ingersoll1969) (see the discussion in § 6.2). The dead zones are separated by boundary layers; the strongest of these boundary layers is the main channel which appears as the large cliff roughly at
 $y/(2\unicode[STIX]{x03C0}L)=0.25$
in figure 5(b). The main channel is determined by a narrow band of geostrophic contours that are opened by the small-
 $\unicode[STIX]{x1D6FD}$
effect; this provides an open path for flow through the disordered topography.
3.5 An example with open geostrophic contours:
$\unicode[STIX]{x1D6FD}_{\ast }=1.38$

Figures 6 and 7 show a solution for the same parameters as in figures 4 and 5, except that
 $\unicode[STIX]{x1D6FD}_{\ast }=1.38$
; this is the
 $\unicode[STIX]{x1D6FD}_{\ast }=1.38$
‘boxed’ point indicated in figure 1. The geostrophic contours are open throughout the domain. The most striking difference when compared with the example in § 3.4 is that there are no dead zones; the flow is more evenly spread throughout the domain. This can be seen by comparing figure 7 with figure 5. The time-mean streamfunction in figure 7(b) is not ‘terraced’. Instead,
 $\bar{\unicode[STIX]{x1D713}}-\bar{U}y$
in figure 7(b) is better characterized as a bumpy slope.
A solution with
 $\unicode[STIX]{x1D6FD}_{\ast }=1.38$
and open geostrophic contours. All other parameters are as in figure 4. The panels are also as in figure 4. It should be noted that the colour scale is different between (c) and (d). A movie showing the evolution of
 $q=\unicode[STIX]{x1D701}+\unicode[STIX]{x1D702}$
and
 $\unicode[STIX]{x1D713}-Uy$
from rest can be found in the supplementary material (movie 2).

A solution with
 $\unicode[STIX]{x1D6FD}_{\ast }=1.38$
. All other parameters are as in figure 5. (a) The speed of the time-mean flow,
 $|\bar{\boldsymbol{U}}|$
(colours); the geostrophic contours
 $\unicode[STIX]{x1D6FD}y+\unicode[STIX]{x1D702}$
are shown as white curves. (b) Surface plot of the total time-mean streamfunction,
 $\bar{\unicode[STIX]{x1D713}}-\bar{U}y$
.

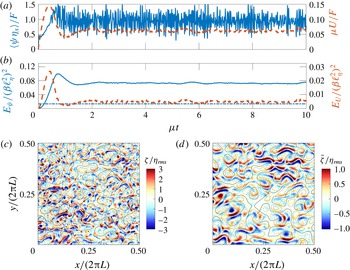
The large-scale flow is
 $\bar{U}=4.68~\text{cm}~\text{s}^{-1}$
, which is again much smaller than the flow that would exist in the absence of topography;
 $\bar{U}$
is only 6 % of
 $F/\unicode[STIX]{x1D707}$
. The eddy energy
 $E_{\unicode[STIX]{x1D713}}$
is roughly 15 times larger than the large-scale flow energy
 $E_{U}$
. Moreover, the energy of the transient eddies, shown in figure 6(b), is in this case much larger than that of the standing eddies. This is also apparent by comparing the instantaneous and time-mean relative vorticity fields in figure 6(c,d). In anticipation of the discussion in § 8, we remark that these strong transient eddies act as PV diffusion on the time-mean QGPV (Rhines & Young Reference Rhines and Young1982).
In contrast to the example of § 3.4, the relative vorticity is positively correlated with the topographic PV:
 $\text{corr}(\bar{\unicode[STIX]{x1D701}},\unicode[STIX]{x1D702})=0.23$
. Because of the strong transient eddies, the sign of
 $\text{corr}(\bar{\unicode[STIX]{x1D701}},\unicode[STIX]{x1D702})$
is not apparent by visual inspection of figure 6(c,d). The form-stress correlation is
 $\text{corr}(\bar{\unicode[STIX]{x1D713}},\unicode[STIX]{x1D702}_{x})=0.15$
. Again, this weak correlation is sufficient to produce a form stress balancing 94 % of the wind stress.
4 Flow regimes and a parameter survey
In this section, we present a comprehensive suite of numerical simulations of (1.1) and (2.3) using the topography of figure 2(a). A complete survey of the parameter space is complicated by the existence of at least three control parameters in (3.4). In the following survey, we use
 $$\begin{eqnarray}\unicode[STIX]{x1D707}_{\ast }=10^{-2}\end{eqnarray}$$
and vary the strength of the non-dimensional large-scale wind forcing
 $F_{\ast }$
and the non-dimensional planetary PV gradient
 $\unicode[STIX]{x1D6FD}_{\ast }$
. Most the solutions presented use
 $512^{2}$
grid points. Additionally, a few
 $1024^{2}$
solutions were obtained to test the sensitivity to resolution (we found none). Unless stated otherwise, the numerical simulations are initiated from rest, and time-averaged quantities are calculated by averaging the fields over the interval
 $10\leqslant \unicode[STIX]{x1D707}t\leqslant 30$
.
4.1 Flow regimes: the lower branch, the upper branch, eddy saturation and the drag crisis
Keeping
 $\unicode[STIX]{x1D6FD}_{\ast }$
fixed and increasing the wind forcing
 $F_{\ast }$
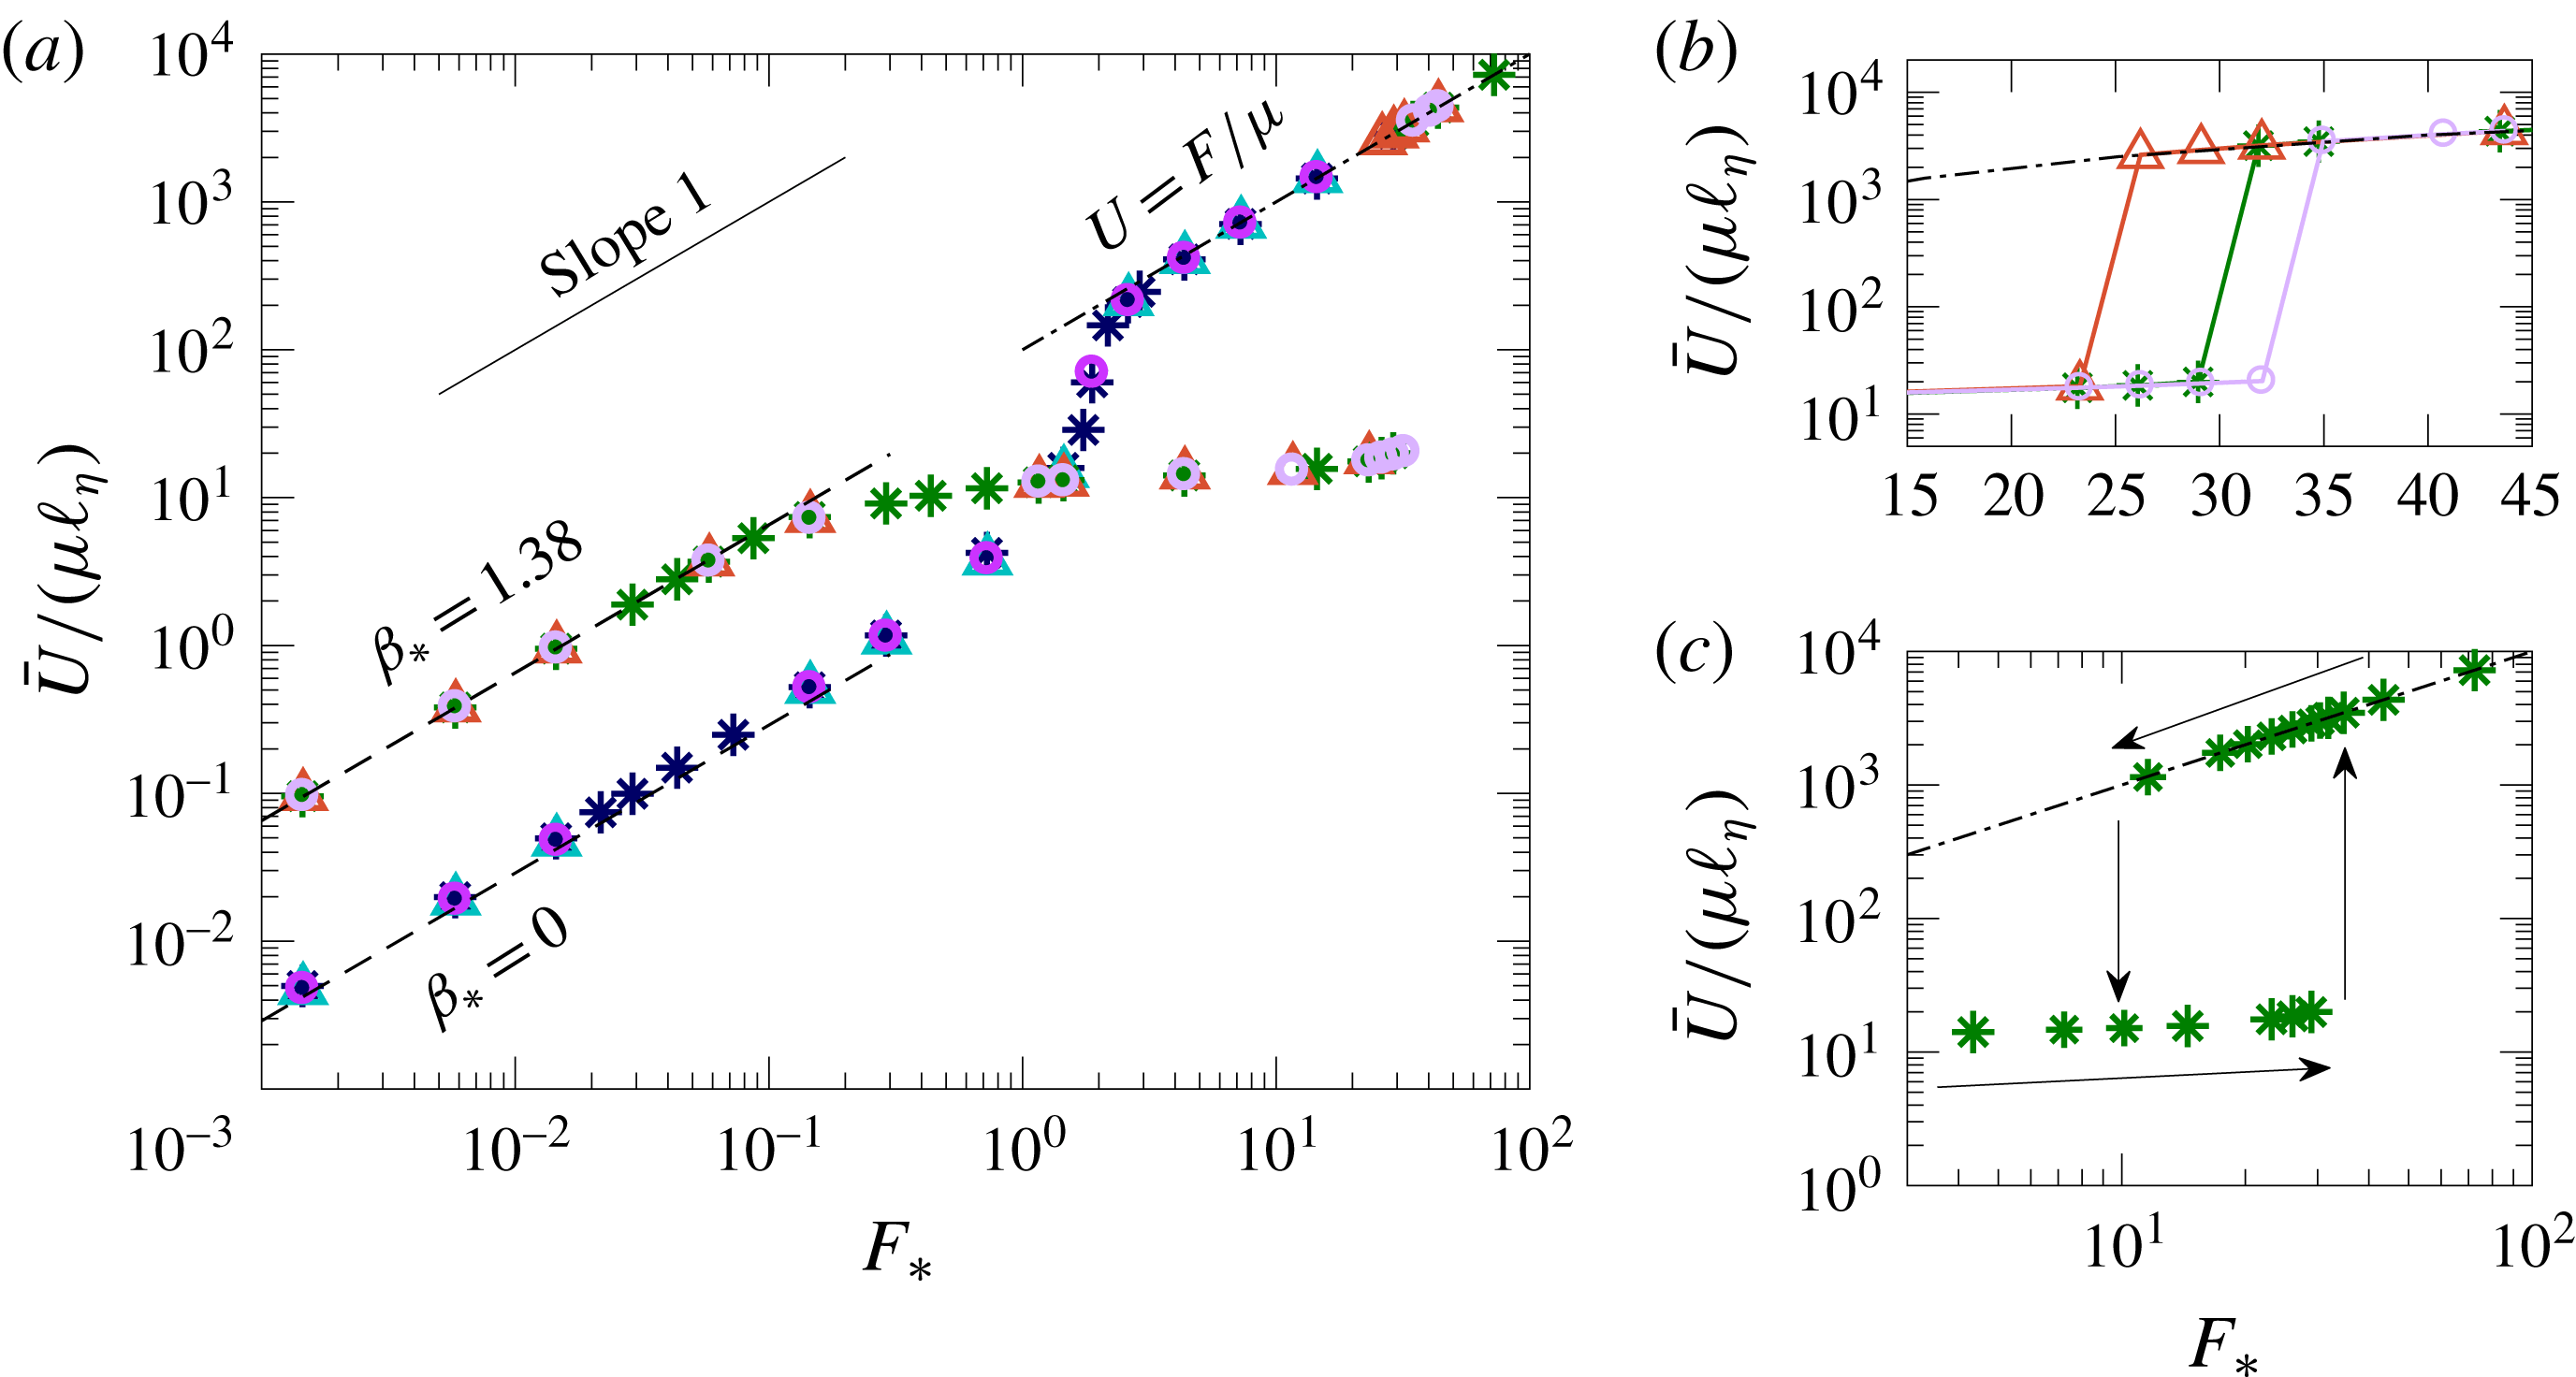
from very small values, we find that the statistically equilibrated solutions show either one of the two characteristic behaviours depicted in figure 8.
For
 $\unicode[STIX]{x1D6FD}=0$
, or for values of
 $\unicode[STIX]{x1D6FD}_{\ast }$
much less than 1, we find that the equilibrated time-mean large-scale flow
 $\bar{U}$
scales linearly with
 $F_{\ast }$
when
 $F_{\ast }$
is very small. On this lower branch, the large-scale velocity is
 $$\begin{eqnarray}\bar{U}\approx F/\unicode[STIX]{x1D707}_{\mathit{eff}},\quad \text{with }\unicode[STIX]{x1D707}_{\mathit{eff}}\gg \unicode[STIX]{x1D707}.\end{eqnarray}$$
In § 6, we provide an analytic expression for the effective drag
 $\unicode[STIX]{x1D707}_{\mathit{eff}}$
in (4.2); the
 $\bar{U}$
based on this analytic expression for
 $\unicode[STIX]{x1D707}_{\mathit{eff}}$
is shown by the dashed lines in figure 8. As
 $F_{\ast }$
increases,
 $\bar{U}$
transitions to a different linear relation with
 $$\begin{eqnarray}\bar{U}\approx F/\unicode[STIX]{x1D707}.\end{eqnarray}$$
On this upper branch, the form stress is essentially zero and
 $F$
is balanced by the bare drag
 $\unicode[STIX]{x1D707}$
.
(a) The equilibrated large-scale mean flow
 $\bar{U}$
as a function of
 $F_{\ast }$
for cases with
 $\unicode[STIX]{x1D6FD}_{\ast }=0$
and
 $\unicode[STIX]{x1D6FD}_{\ast }=1.38$
. Results are shown for three different monoscale topography realizations (each denoted with a different marker symbol: *, ▵, ○), all with the spectrum in figure 2(c). Other parameters are given in table 2, e.g.
 $\unicode[STIX]{x1D707}_{\ast }=10^{-2}$
. (b) A detailed view of the transition from the lower- to the upper-branch solution for the case with
 $\unicode[STIX]{x1D6FD}_{\ast }=1.38$
. (c) The hysteretic solutions for one of the topography realizations with
 $\unicode[STIX]{x1D6FD}_{\ast }=1.38$
. The dashed lines in (a) correspond to asymptotic expressions derived in § 6 and the dash-dotted lines in all panels mark the solution
 $U=F/\unicode[STIX]{x1D707}$
.

For the
 $\unicode[STIX]{x1D6FD}=0$
case shown in figure 8, the transition between the lower and upper branches occurs in the range
 $0.6<F_{\ast }<3$
; the equilibrated
 $\bar{U}$
increases by a factor of more than 200 within this interval. On the other hand, for
 $\unicode[STIX]{x1D6FD}_{\ast }$
larger than 0.05, we find a quite different behaviour, illustrated in figure 8 by the runs with
 $\unicode[STIX]{x1D6FD}_{\ast }=1.38$
. On the lower branch,
 $\bar{U}$
grows linearly with
 $F$
with a constant
 $\unicode[STIX]{x1D707}_{\mathit{eff}}$
, as in (4.2). However, the linear increase in
 $\bar{U}$
eventually ceases and instead
 $\bar{U}$
then grows at a much more slower rate as
 $F$
increases. For the case
 $\unicode[STIX]{x1D6FD}_{\ast }=1.38$
shown in figure 8,
 $\bar{U}$
only doubles as
 $F$
is increased over 150-fold from
 $F_{\ast }=0.2$
to 30. We identify this regime, in which
 $\bar{U}$
is insensitive to changes in
 $F$
, with the ‘eddy saturation’ regime of Straub (Reference Straub1993). As
 $F$
increases further, the flow exits the eddy saturation regime via a ‘drag crisis’ in which the form stress abruptly vanishes and
 $\bar{U}$
increases by a factor of over 200 as the solution jumps to the upper branch (4.3). In figure 8, this drag crisis is a discontinuous transition from the eddy saturated regime to the upper branch. The drag crisis, which requires non-zero
 $\unicode[STIX]{x1D6FD}$
, is qualitatively different from the continuous transition between the upper and lower branches which is characteristic of flows with small (or zero)
 $\unicode[STIX]{x1D6FD}_{\ast }$
.
Figure 8 shows results obtained with three different realizations of monoscale topography, namely the topography illustrated in figure 2(a) and two other realizations with the monoscale spectrum of figure 2(b). The large-scale flow
 $\bar{U}$
is insensitive to these changes in topographic detail. In this sense, the large-scale flow is ‘self-averaging’. However, the location of the drag crisis depends on differences between the three realizations. Figure 8(b) shows that the location of the jump from lower to upper branch is realization-dependent: the three realizations jump to the upper branch at different values of
 $F_{\ast }$
.
The case with
 $\unicode[STIX]{x1D6FD}_{\ast }=0.1$
, which corresponds a value close to realistic (cf. table 2), does show a drag crisis, i.e. a discontinuous jump from the lower to the upper branch at
 $F_{\ast }\approx 3.9$
; see figure 1. However, the eddy saturation regime, i.e. the regime in which
 $\bar{U}$
grows with wind-stress forcing at a rate less than linear, is not nearly as pronounced as in the case with
 $\unicode[STIX]{x1D6FD}_{\ast }=1.38$
shown in figure 8(a).
4.2 Hysteresis and multiple flow patterns
Starting with a severely truncated spectral model of the atmosphere introduced by Charney & DeVore (Reference Charney and Devore1979), there has been considerable interest in the possibility that topographic form stress might result in multiple stable large-scale flow patterns which might explain blocked and unblocked states of atmospheric circulation. Focusing on atmospheric conditions, Tung & Rosenthal (Reference Tung and Rosenthal1985) concluded that the results of low-order truncated models are not reliable guides to the full nonlinear problem: although multiple stable states still exist in the full problem, these occur only in a restricted parameter range that is not characteristic of the Earth’s atmosphere.
With this meteorological background in mind, it is interesting that in the oceanographic parameter regime emphasized here, we easily found multiple equilibrium solutions on either side of the drag crisis. After increasing
 $F$
beyond the crisis point, and jumping to the upper branch, we performed additional numerical simulations by decreasing
 $F$
and using initial conditions obtained from the upper-branch solutions at larger values of
 $F$
. Thus, we moved down the upper branch, past the crisis, and determined a range of wind-stress forcing values with multiple flow patterns. Figure 8(c), with
 $\unicode[STIX]{x1D6FD}_{\ast }=1.38$
, shows that multiple states coexist in the range
 $11\leqslant F_{\ast }\leqslant 29$
. It should be noted that for the quasirealistic case with
 $\unicode[STIX]{x1D6FD}_{\ast }=0.1$
, multiple solutions exist only in the limited parameter range
 $2.9\leqslant F_{\ast }\leqslant 3.9$
. These coexisting flows differ qualitatively. The lower-branch flows, being near the drag crisis, have an important transient-eddy component and almost all of
 $F$
is balanced by form stress; the example discussed in connection with figures 4 and 5 is typical. On the other hand, the coexisting upper-branch solutions are steady (that is,
 $\unicode[STIX]{x1D713}^{\prime }=U^{\prime }=0$
), and nearly all of the wind stress is balanced by bottom drag, so that
 $\unicode[STIX]{x1D707}U/F\approx 1$
.
4.3 A survey
In this section, we present a suite of solutions, all with
 $\unicode[STIX]{x1D707}_{\ast }=10^{-2}$
. The main conclusion from these extensive calculations is that the behaviour illustrated in figure 8 is representative of a broad region of parameter space.
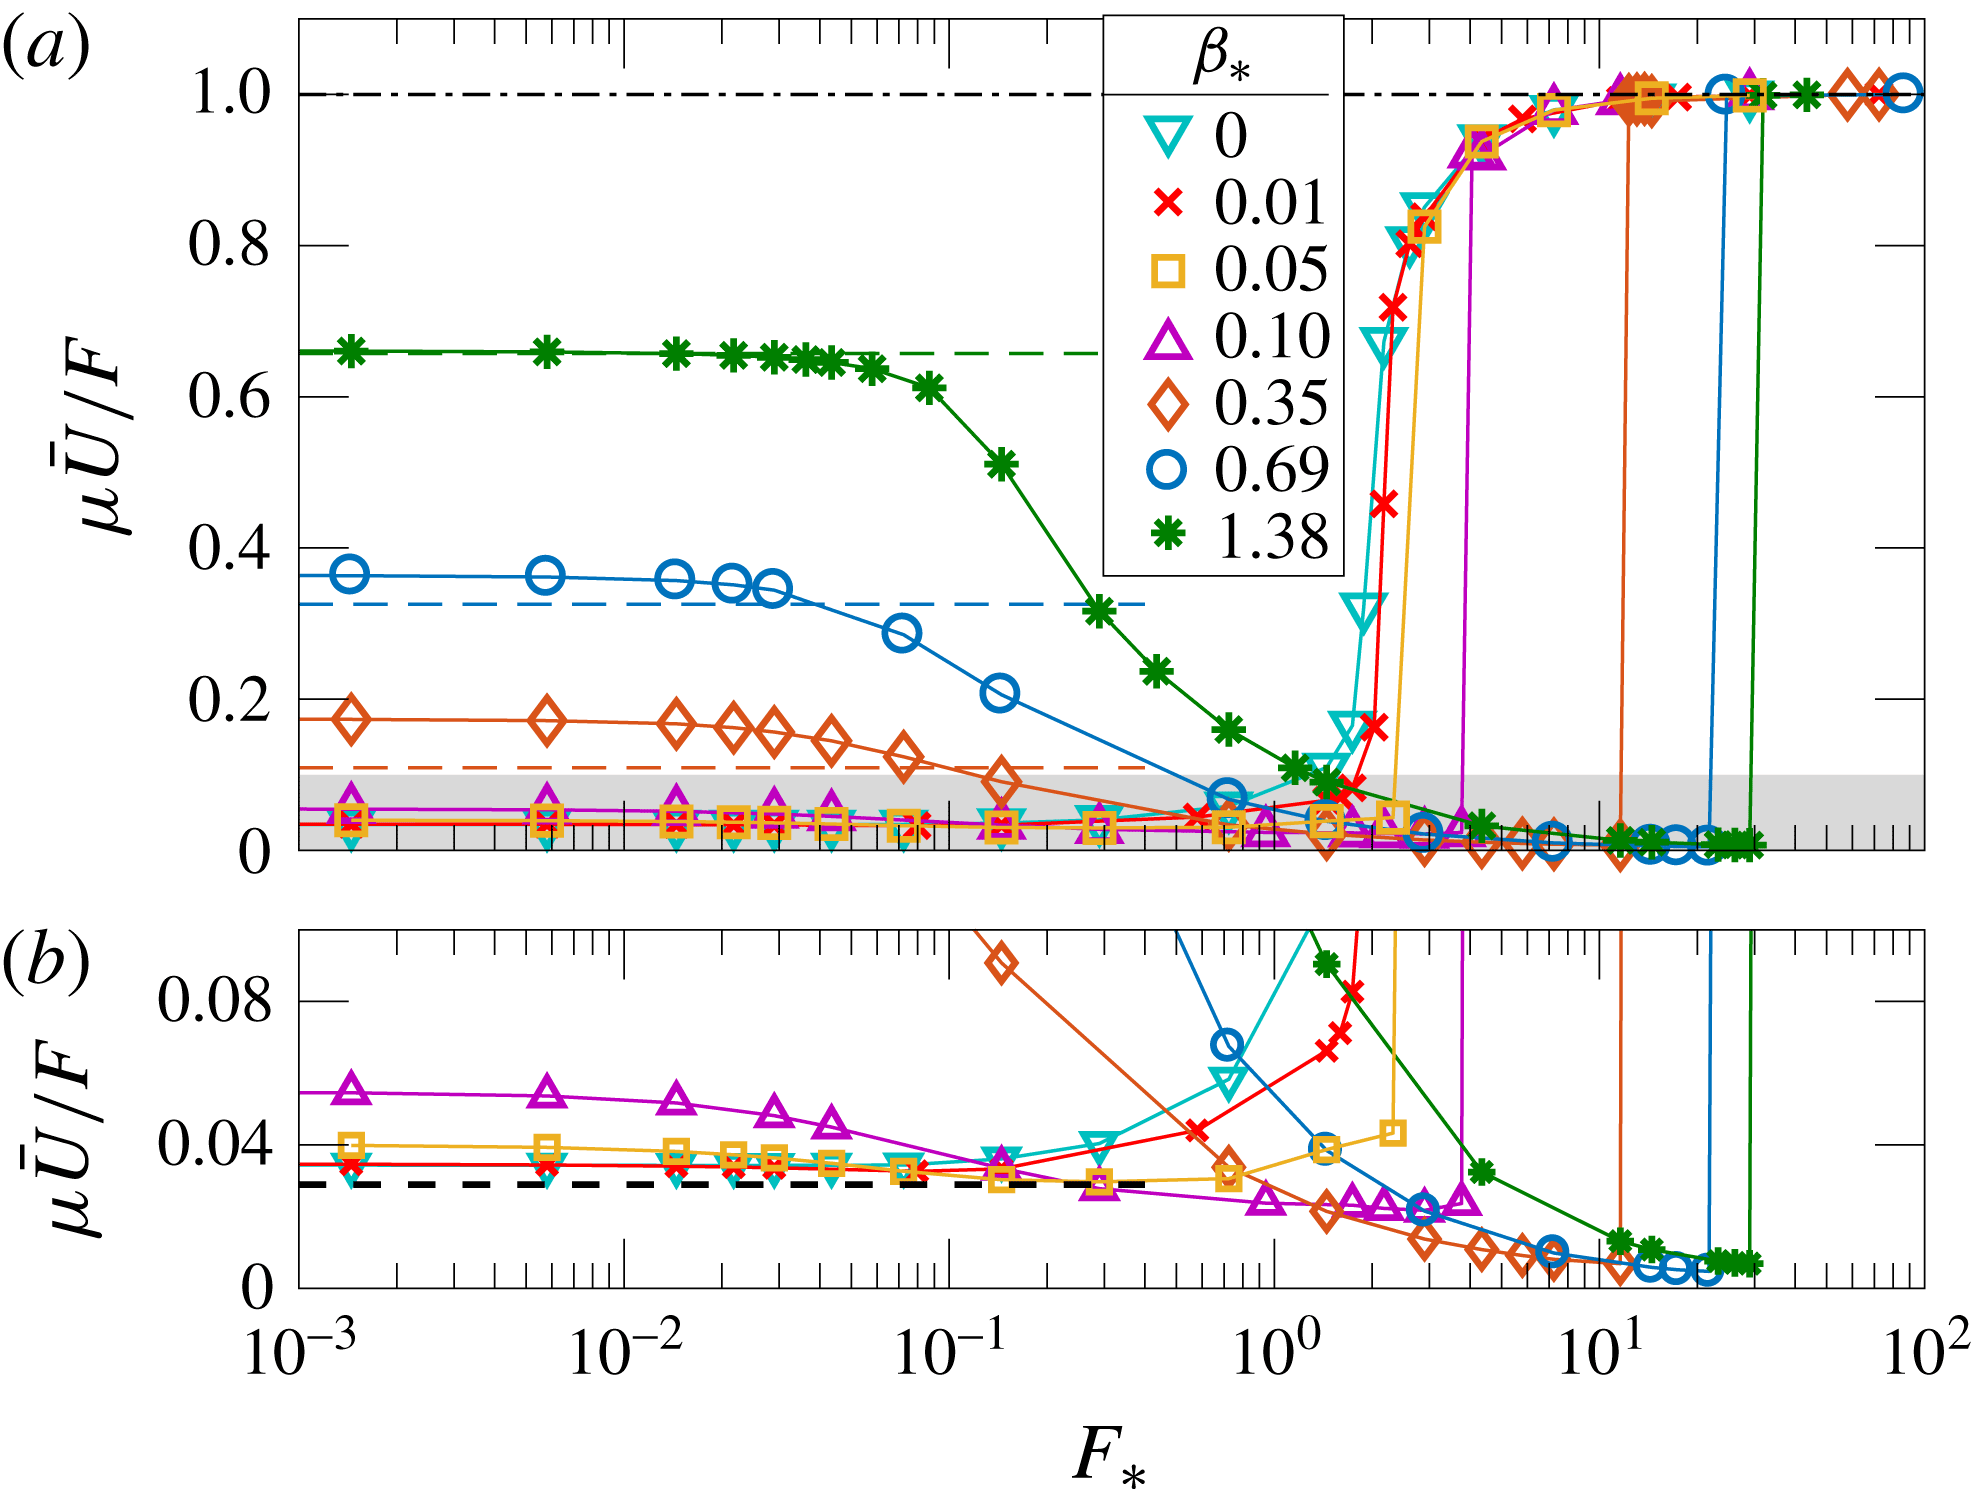
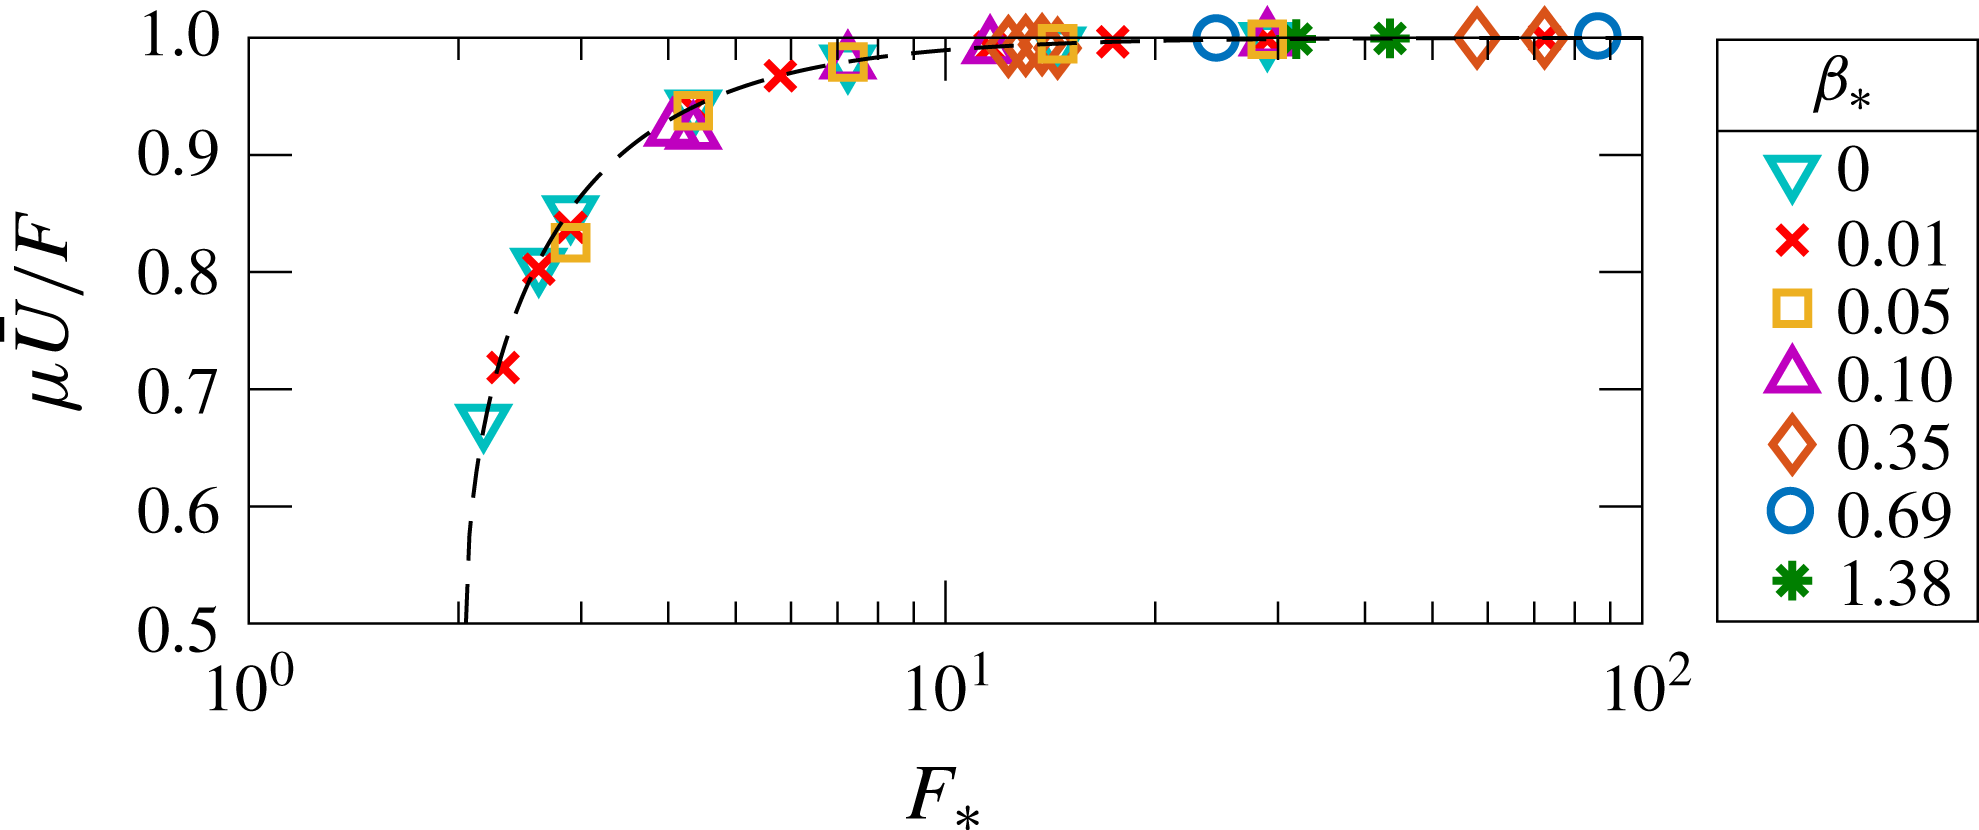
Figure 9(a) shows the ratio
 $\unicode[STIX]{x1D707}\bar{U}/F$
as a function of
 $F_{\ast }$
for seven different values of
 $\unicode[STIX]{x1D6FD}_{\ast }$
. The three series with
 $\unicode[STIX]{x1D6FD}_{\ast }\leqslant 0.10$
are ‘small-
 $\unicode[STIX]{x1D6FD}$
’ cases in which closed geostrophic contours fill most of the domain. The other four series, with
 $\unicode[STIX]{x1D6FD}_{\ast }\geqslant 0.35$
, are ‘large-
 $\unicode[STIX]{x1D6FD}$
’ cases in which open geostrophic contours fill most of the domain. For small values of
 $F_{\ast }$
in figure 9(a), the flow is steady (
 $\unicode[STIX]{x1D713}^{\prime }=U^{\prime }=0$
) and
 $\unicode[STIX]{x1D707}\bar{U}/F$
does not change with
 $F$
. This is the lower-branch relation (4.2) in which
 $\bar{U}$
varies linearly with
 $F$
with an effective drag coefficient
 $\unicode[STIX]{x1D707}_{\mathit{eff}}$
. As
 $F_{\ast }$
is increased, this steady flow becomes unstable and the strength of the transient-eddy field increases with
 $F$
.
Figure 9(b) shows a detailed view of the eddy saturation regime and the drag crisis. The dashed lines on the left of figure 9(a,b) show the analytic results derived in § 6. For the large-
 $\unicode[STIX]{x1D6FD}$
cases, the form stress makes a very large contribution to the large-scale momentum balance prior to the drag crisis. We emphasize that, although the drag
 $\unicode[STIX]{x1D707}$
does not directly balance
 $F$
in this regime, it does play a crucial role in producing non-zero form stress
 $\langle \bar{\unicode[STIX]{x1D713}}\unicode[STIX]{x1D702}_{x}\rangle$
. In all of the solutions summarized in figure 9, non-zero
 $\unicode[STIX]{x1D707}$
is required so that the flow is asymmetric upstream and downstream of topographic features; this asymmetry induces non-zero
 $\langle \bar{\unicode[STIX]{x1D713}}\unicode[STIX]{x1D702}_{x}\rangle$
.
(a) The ratio
 $\unicode[STIX]{x1D707}\bar{U}/F$
as a function of the non-dimensional forcing,
 $F_{\ast }$
, for seven values of
 $\unicode[STIX]{x1D6FD}_{\ast }$
. The dashed lines are asymptotic results in (6.3). (b) A detailed view of the shaded lower part of (a), showing the eddy saturation regime and the drag crisis. The dashed line is the asymptotic result in (6.5).

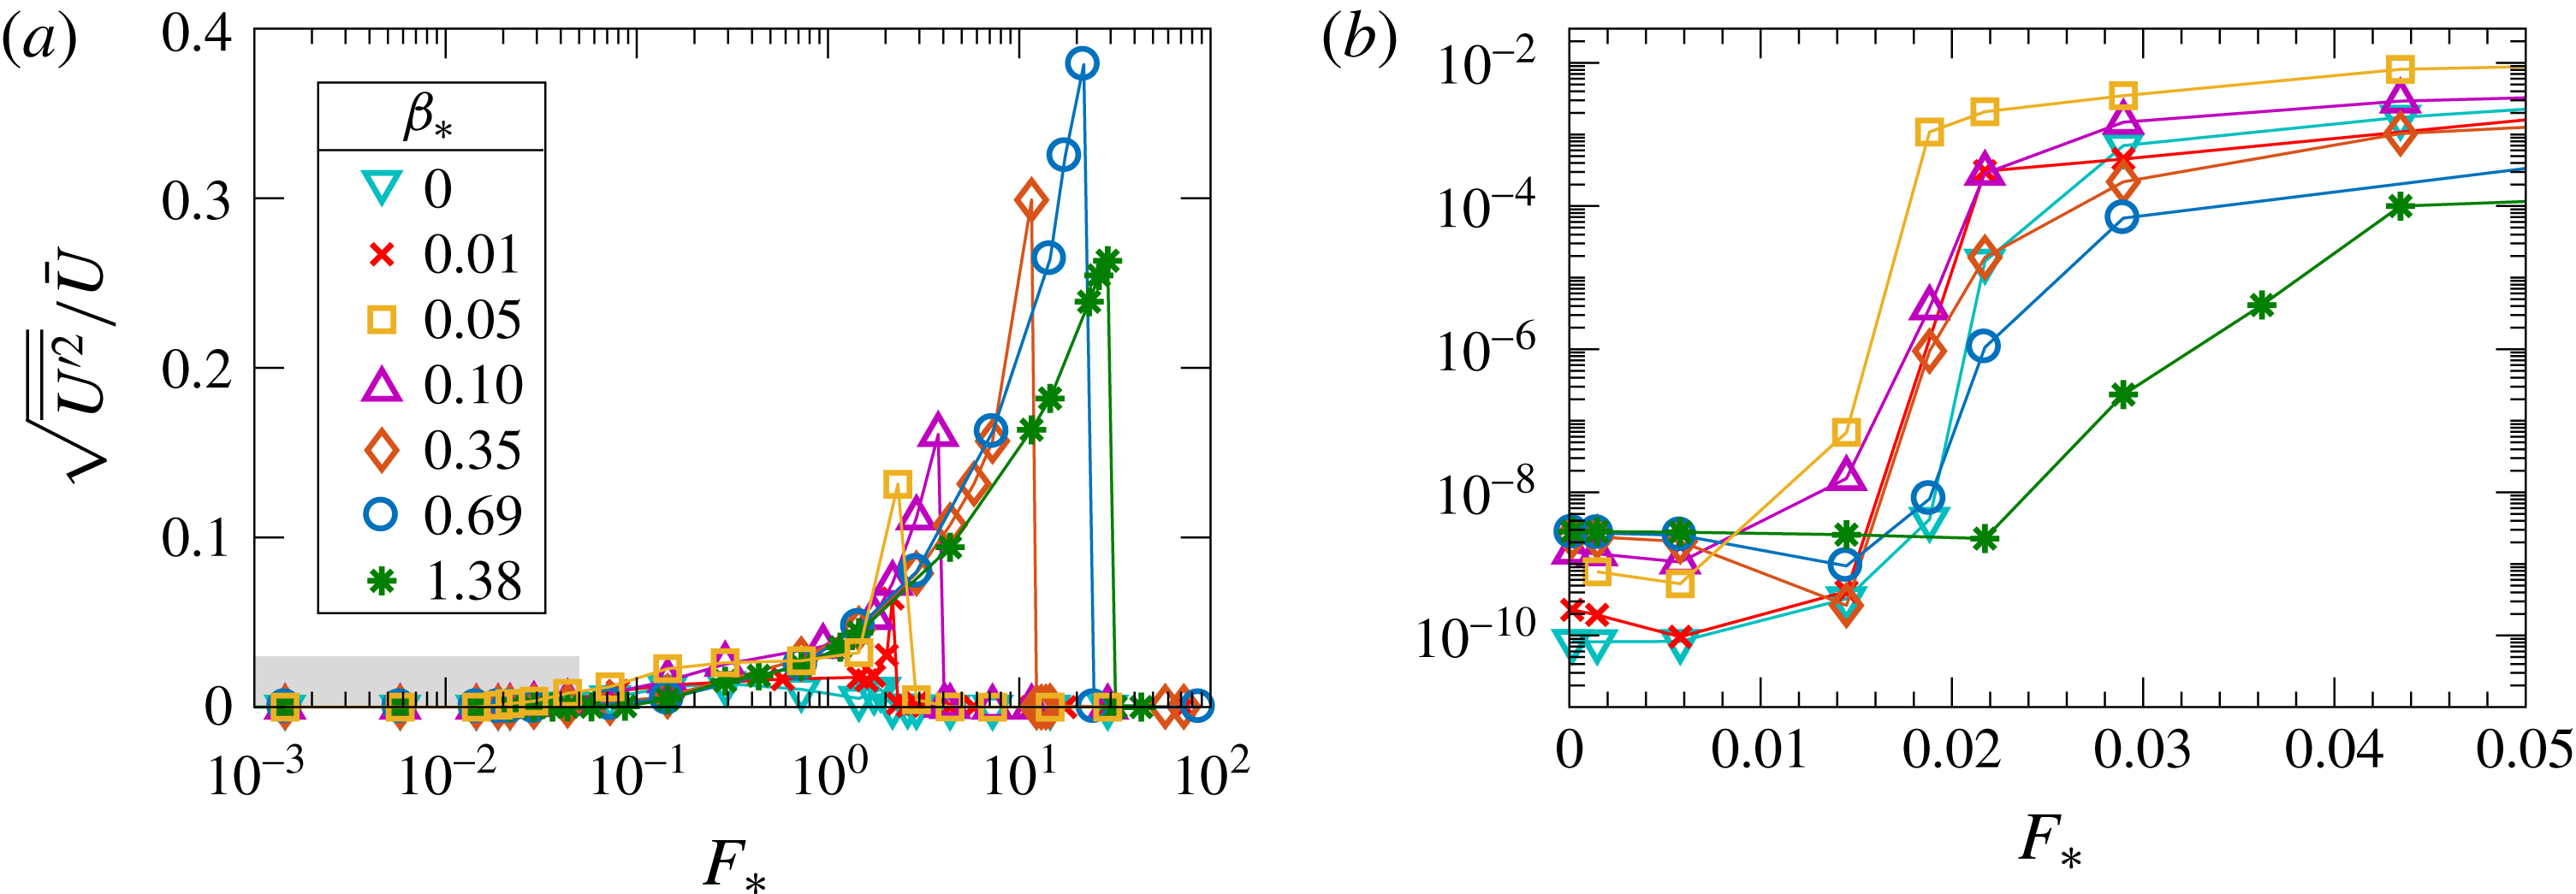
(a) The index in (4.4) measures the strength of the transient eddies as a function of the forcing
 $F_{\ast }$
. (b) A detailed view of the shaded lower-left part of (a). The onset of transient eddies is signalled by the large jump in the fluctuation index.

(a) The equilibrated large-scale flow,
 $\bar{U}$
, scaled with
 $\unicode[STIX]{x1D6FD}\ell _{\unicode[STIX]{x1D702}}^{2}$
as a function of the non-dimensional forcing for various values of
 $\unicode[STIX]{x1D6FD}_{\ast }$
. The dashed curves indicate the upper-branch analytic result from § 7 (also scaled with
 $\unicode[STIX]{x1D6FD}\ell _{\unicode[STIX]{x1D702}}^{2}$
). (b) An expanded view of the shaded part of (a) which shows the eddy saturation regime.

In figure 10, we use
 $$\begin{eqnarray}\sqrt{\overline{{U^{\prime }}^{2}}}/\bar{U}\end{eqnarray}$$
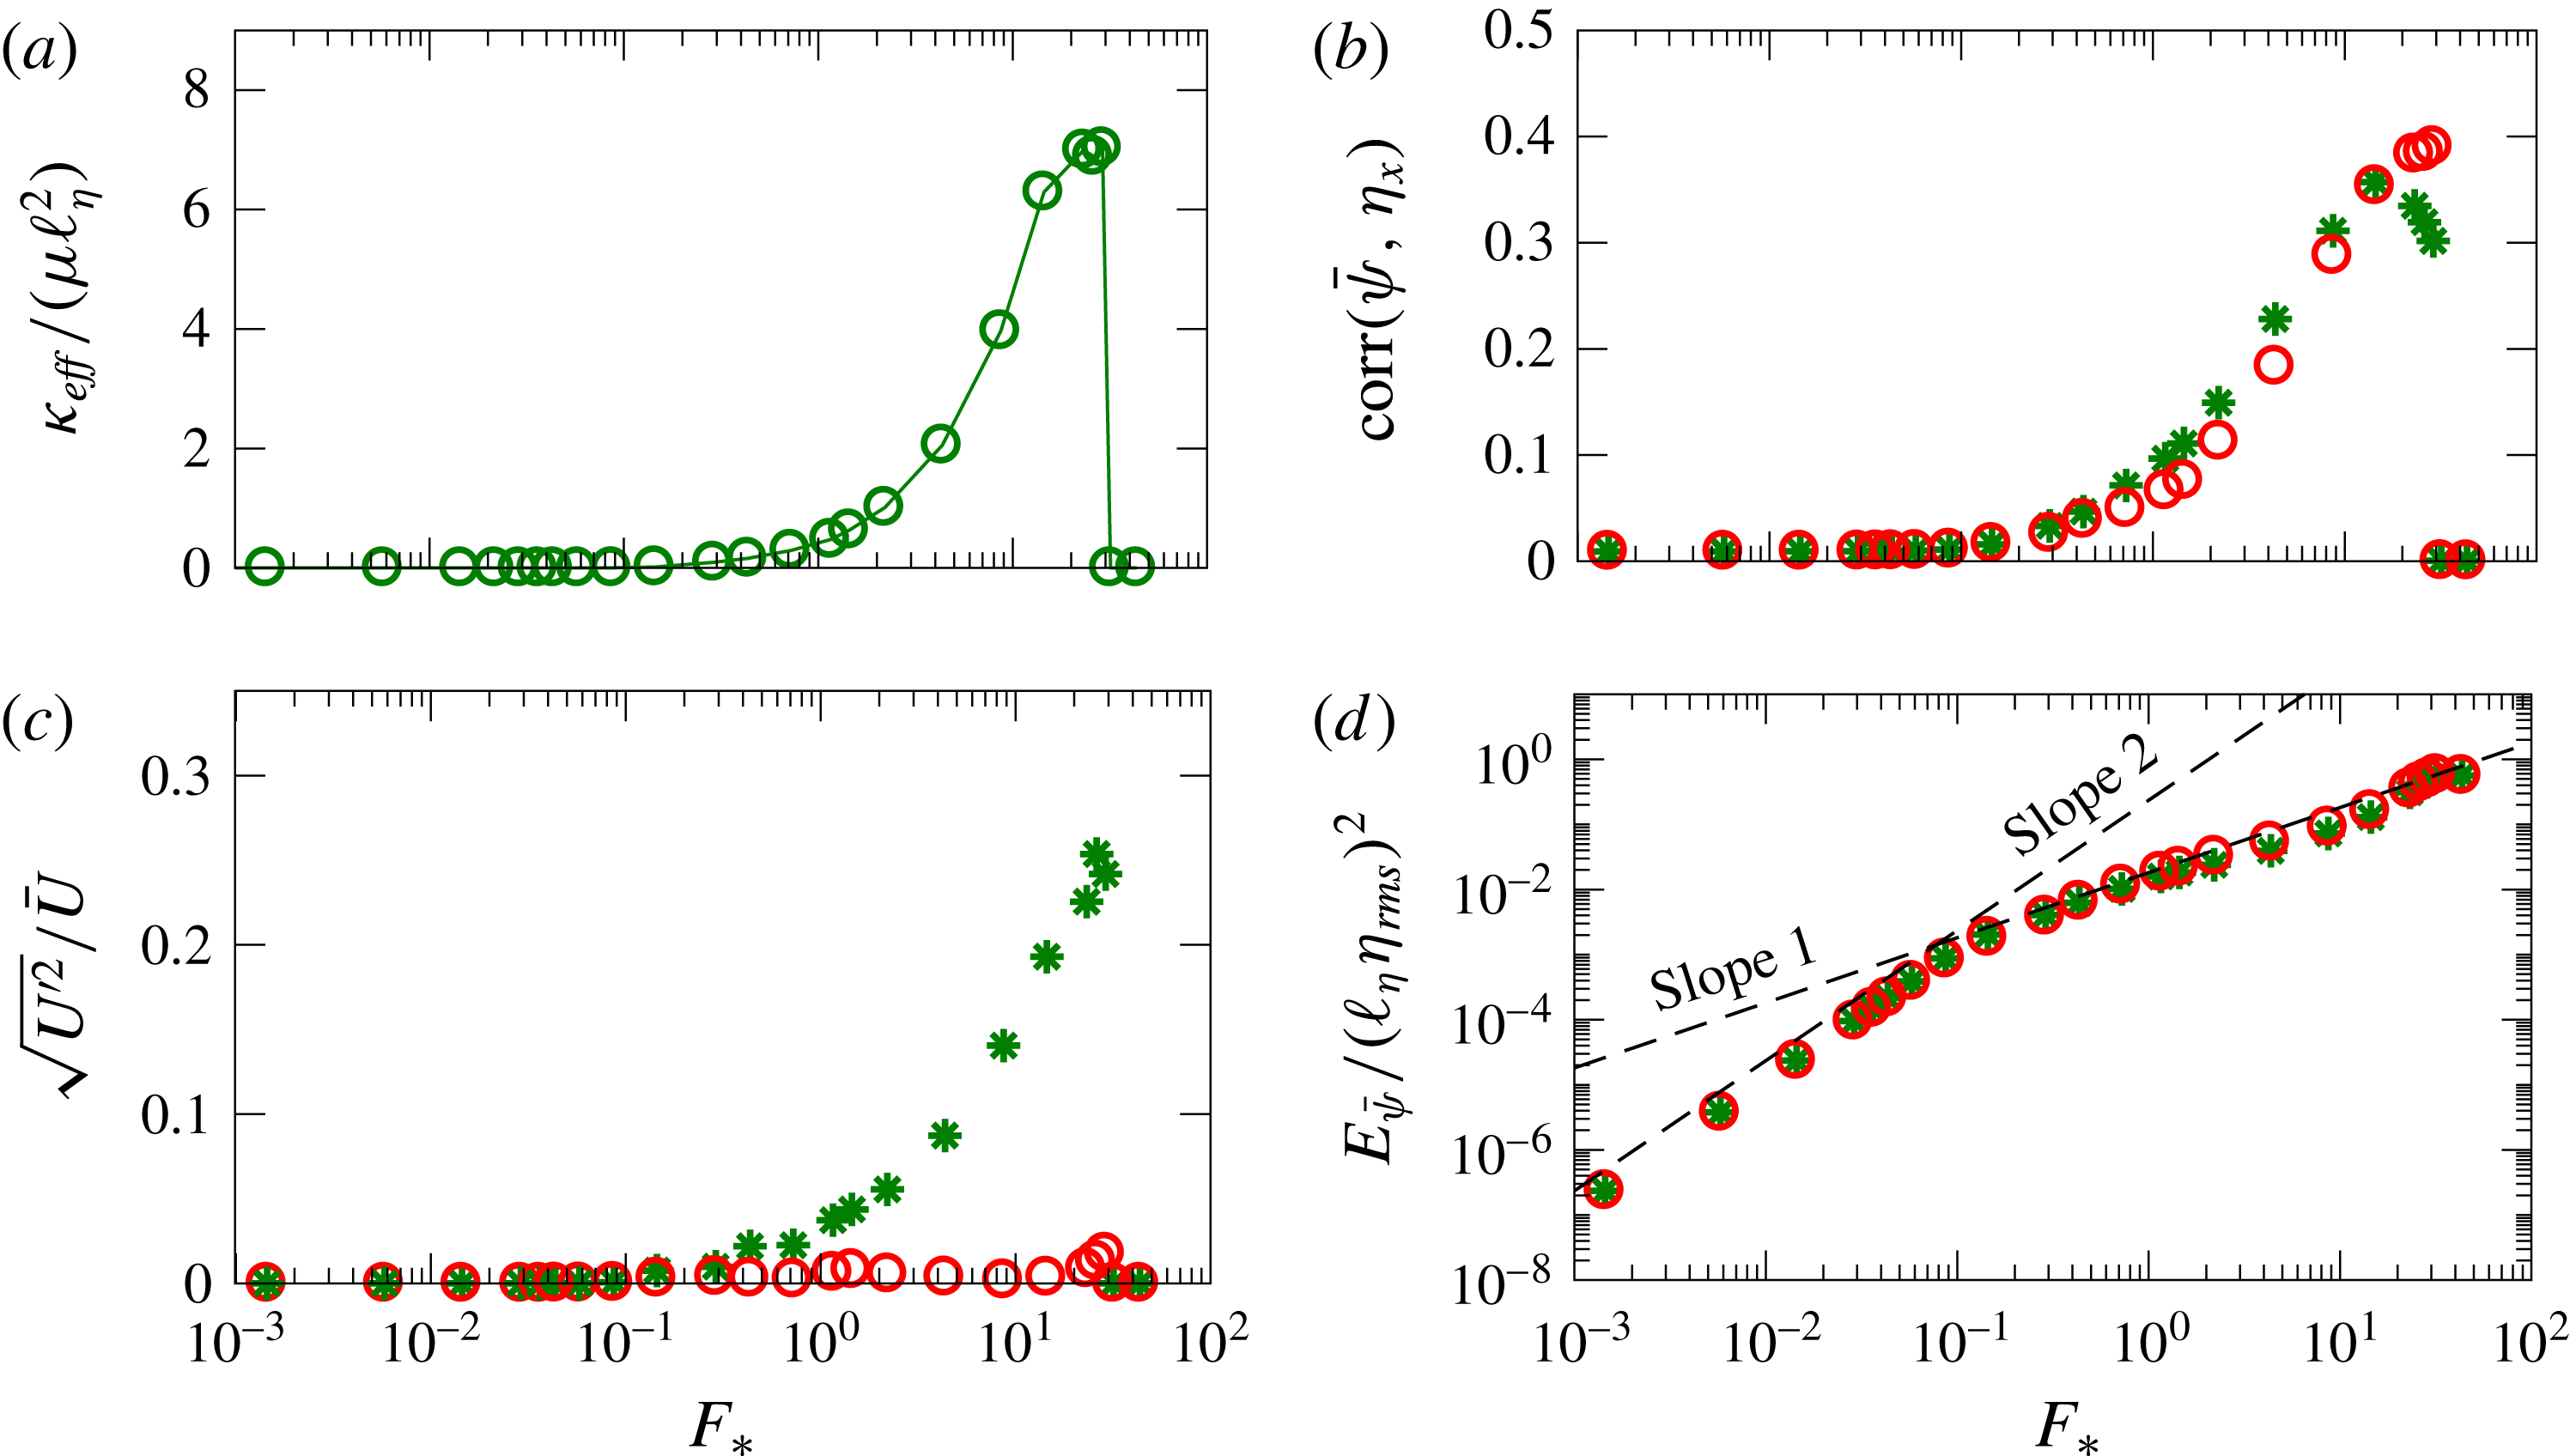
as an indication of the onset of the transient-eddy instability and as an index of the strength of the transient eddies. Remarkably, the onset of the instability is roughly at
 $F_{\ast }=1.5\times 10^{-2}$
for all values of
 $\unicode[STIX]{x1D6FD}_{\ast }$
. The onset of transient eddies is the sudden increase in (4.4) by a factor of approximately
 $10^{4}$
or
 $10^{5}$
in figure 10(b). The transient eddies result in a reduction of
 $\unicode[STIX]{x1D707}\bar{U}/F$
. For the large-
 $\unicode[STIX]{x1D6FD}$
runs, this is the eddy saturation regime. In the presentation in figure 9(a), the eddy saturation regime is the decease in
 $\unicode[STIX]{x1D707}\bar{U}/F$
that occurs once
 $0.03<F_{\ast }<0.3$
(depending on
 $\unicode[STIX]{x1D6FD}_{\ast }$
). The eddy saturation regime is terminated by the drag-crisis jump to the upper branch where
 $\unicode[STIX]{x1D707}\bar{U}/F\approx 1$
. This coincides with vanishing of the transients. On the upper branch, the flow becomes steady,
 $\unicode[STIX]{x1D713}^{\prime }=U^{\prime }=0$
; see figure 10(a).
(a) Correlation of the standing-eddy vorticity
 $\bar{\unicode[STIX]{x1D701}}$
with the topographic PV
 $\unicode[STIX]{x1D702}$
for
 $\unicode[STIX]{x1D6FD}_{\ast }=0$
, 0.10 and 1.38. For
 $\unicode[STIX]{x1D6FD}_{\ast }=0$
, the correlation
 $\text{corr}(\bar{\unicode[STIX]{x1D701}},\unicode[STIX]{x1D702})$
is always negative; for
 $F_{\ast }=10^{-3}$
,
 $\text{corr}(\bar{\unicode[STIX]{x1D701}},\unicode[STIX]{x1D702})=-1.35\times 10^{-3}$
. (b) Correlation of
 $\bar{\unicode[STIX]{x1D713}}$
with
 $\unicode[STIX]{x1D702}_{x}$
.

Figure 11 shows the eddy saturation regime that is characteristic of the three series with
 $\unicode[STIX]{x1D6FD}_{\ast }\geqslant 0.35$
. Eddy saturation occurs for forcing in the range
 $$\begin{eqnarray}0.1\lessapprox F_{\ast }\lessapprox 30.\end{eqnarray}$$
In this regime, the large-scale flow is limited to the relatively small range
 $$\begin{eqnarray}0.06\unicode[STIX]{x1D6FD}\ell _{\unicode[STIX]{x1D702}}^{2}\lessapprox \bar{U}\lessapprox 0.25\unicode[STIX]{x1D6FD}\ell _{\unicode[STIX]{x1D702}}^{2}.\end{eqnarray}$$
In anticipation of analytic results from the next section, we note that in (4.6)
 $\unicode[STIX]{x1D6FD}\ell _{\unicode[STIX]{x1D702}}^{2}$
is the speed of Rossby waves excited by topography with typical length scale
 $\ell _{\unicode[STIX]{x1D702}}$
.
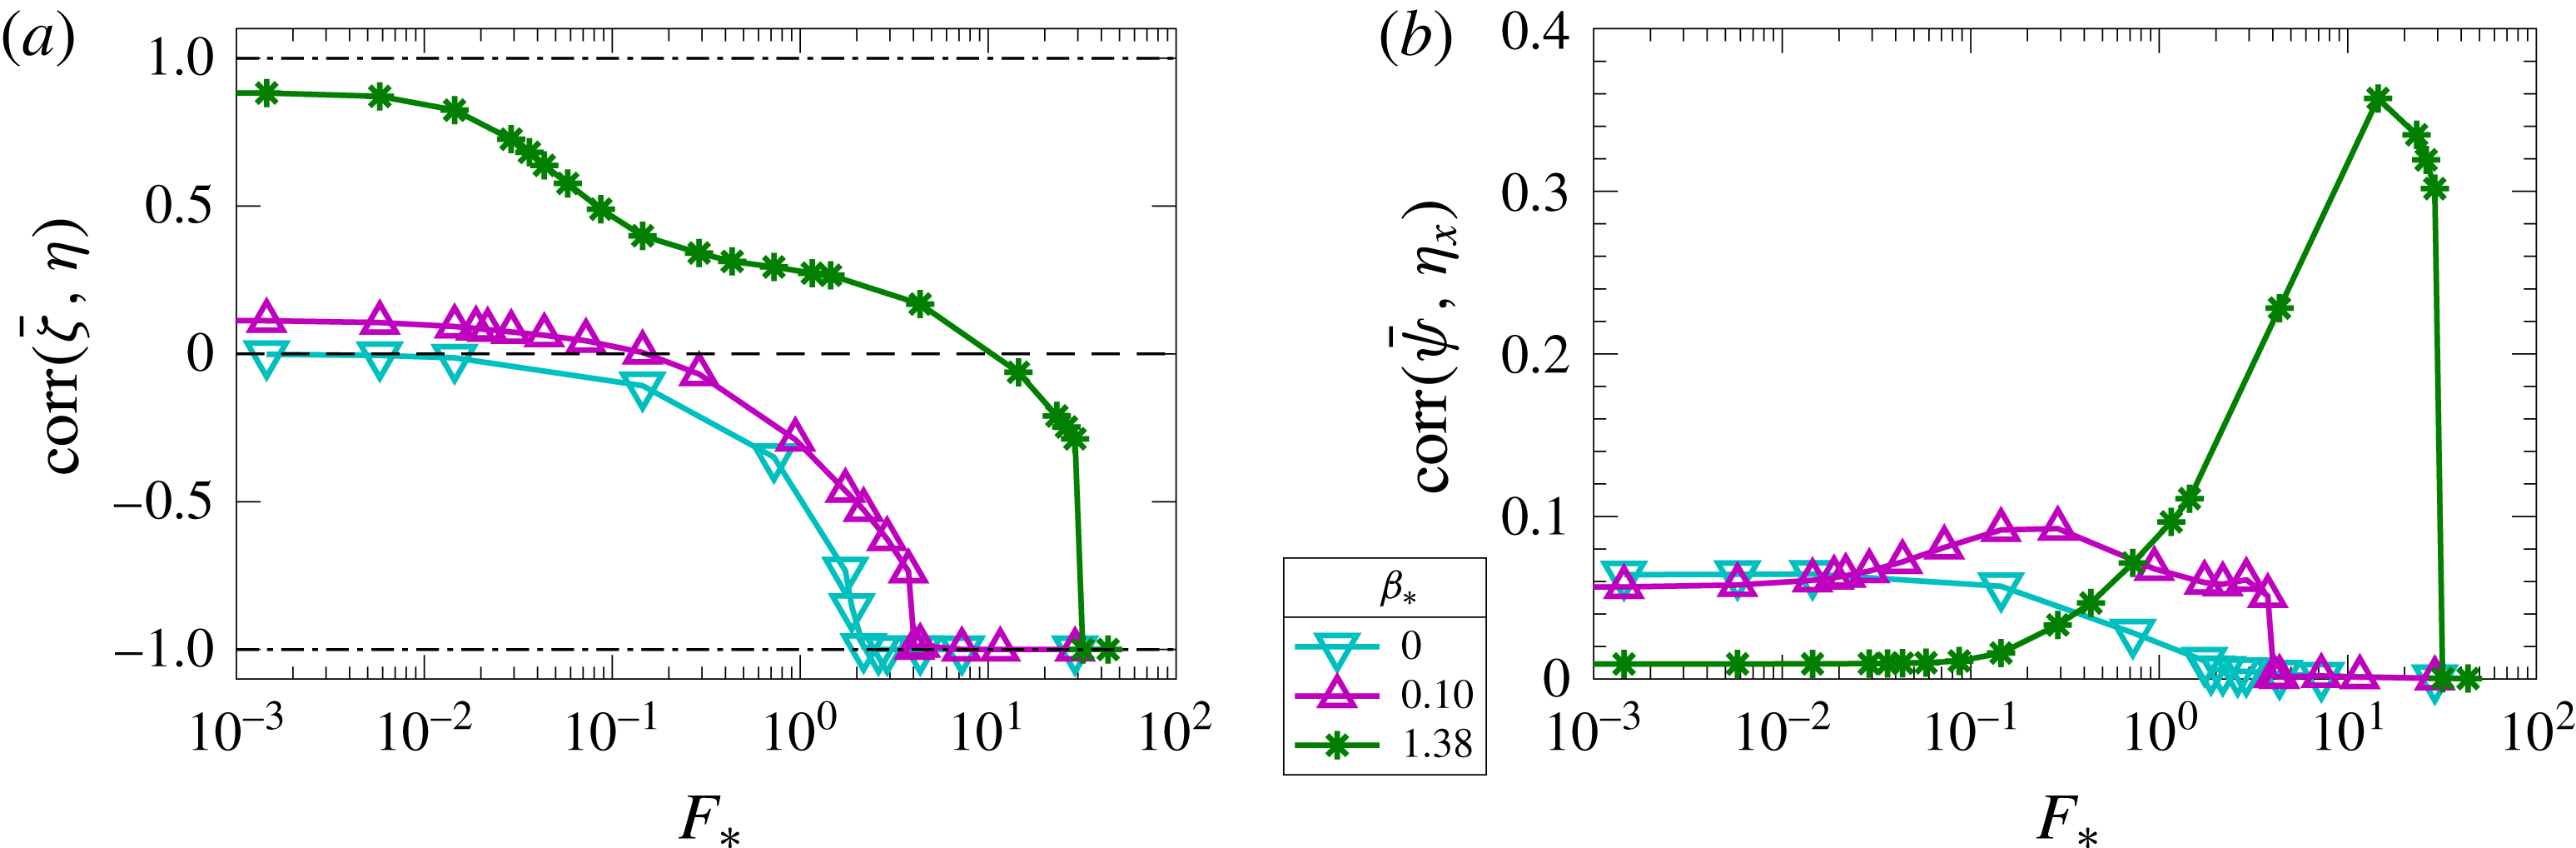
Figure 12 shows the correlations
 $\text{corr}(\bar{\unicode[STIX]{x1D701}},\unicode[STIX]{x1D702})$
and
 $\text{corr}(\bar{\unicode[STIX]{x1D713}},\unicode[STIX]{x1D702}_{x})$
as a function of the forcing
 $F_{\ast }$
for three values of
 $\unicode[STIX]{x1D6FD}_{\ast }$
. In the most weakly forced cases,
 $\bar{\unicode[STIX]{x1D701}}$
is positively correlated with
 $\unicode[STIX]{x1D702}$
. As the forcing
 $F$
increases,
 $\bar{\unicode[STIX]{x1D701}}$
and
 $\unicode[STIX]{x1D702}$
become anticorrelated. However, for
 $\unicode[STIX]{x1D6FD}_{\ast }=0$
, the correlation
 $\text{corr}(\bar{\unicode[STIX]{x1D701}},\unicode[STIX]{x1D702})$
is negative for all values of
 $F$
. For the monoscale topography used here, the term
 $\langle \unicode[STIX]{x1D702}\text{D}\bar{\unicode[STIX]{x1D701}}\rangle$
, which is the only source of enstrophy in the time average of (A 1b
) if
 $\unicode[STIX]{x1D6FD}=0$
, can be approximated as
 $(\unicode[STIX]{x1D707}+\unicode[STIX]{x1D708}/\ell _{\unicode[STIX]{x1D702}}^{2})\langle \bar{\unicode[STIX]{x1D701}}\unicode[STIX]{x1D702}\rangle$
. Therefore, in this case,
 $\langle \bar{\unicode[STIX]{x1D701}}\unicode[STIX]{x1D702}\rangle$
must be negative (see the discussion in appendix A).
5 A quasilinear theory
A prediction of the statistical steady state of (1.1) and (2.3) was first made by Davey (Reference Davey1980). In this section, we present Davey’s quasilinear (QL) theory, and, in subsequent sections, we explore its validity in various regimes documented in § 4. The QL theory is an exploratory approximation obtained by retention of all the terms consistent with easy analytic solution of the QGPV equation; see (5.1) below; terms hindering analytic solution are discarded without a priori justification. We show in §§ 6 and 7 that QL theory is in good agreement with numerical solutions in some parameter ranges, e.g. everywhere on the upper branch and on the lower branch provided that
 $\unicode[STIX]{x1D6FD}_{\ast }\gtrapprox 1$
. With hindsight, and by comparison with the numerical solution, one can understand these QL successes a posteriori by showing that the terms discarded to reach (5.1) are, in fact, small relative to at least some of the retained terms.
Let us (i) assume that the QGPV equation (2.3) has a steady solution and also (ii) neglect
 $\text{J}(\unicode[STIX]{x1D713},q)=\text{J}(\unicode[STIX]{x1D713},\unicode[STIX]{x1D702})+\text{J}(\unicode[STIX]{x1D713},\unicode[STIX]{x1D701})$
. These two ad hoc approximations result in the QL equation
 $$\begin{eqnarray}U\unicode[STIX]{x1D701}_{x}+\unicode[STIX]{x1D6FD}\unicode[STIX]{x1D713}_{x}+\unicode[STIX]{x1D707}\unicode[STIX]{x1D701}=-U\unicode[STIX]{x1D702}_{x},\end{eqnarray}$$
in which
 $U$
is determined by the steady mean-flow equation
 $$\begin{eqnarray}F-\unicode[STIX]{x1D707}U-\left\langle \unicode[STIX]{x1D713}\unicode[STIX]{x1D702}_{x}\right\rangle =0.\end{eqnarray}$$
In (5.1), we have neglected lateral dissipation, so that the dissipation is
 $\text{D}=\unicode[STIX]{x1D707}$
(see the discussion in § 2). It should be noticed that the only nonlinear term in (5.1) is
 $U\unicode[STIX]{x1D701}_{x}$
. Regarding
 $U$
as an unknown parameter, the solution of (5.1) is
 $$\begin{eqnarray}\unicode[STIX]{x1D713}=U\mathop{\sum }_{\boldsymbol{k}}\frac{\text{i}k_{x}\unicode[STIX]{x1D702}_{\boldsymbol{k}}\text{e}^{\text{i}\boldsymbol{k}\boldsymbol{\cdot }\boldsymbol{x}}}{\unicode[STIX]{x1D707}|\boldsymbol{k}|^{2}-\text{i}k_{x}(\unicode[STIX]{x1D6FD}-|\boldsymbol{k}|^{2}U)}.\end{eqnarray}$$
Thus, the QL approximation to the form stress in (5.2) is
 $$\begin{eqnarray}\langle \unicode[STIX]{x1D713}\unicode[STIX]{x1D702}_{x}\rangle =U\mathop{\sum }_{\boldsymbol{k}}\frac{\unicode[STIX]{x1D707}k_{x}^{2}|\boldsymbol{k}|^{2}|\unicode[STIX]{x1D702}_{\boldsymbol{k}}|^{2}}{\unicode[STIX]{x1D707}^{2}|\boldsymbol{k}|^{4}+k_{x}^{2}(\unicode[STIX]{x1D6FD}-|\boldsymbol{k}|^{2}U)^{2}}.\end{eqnarray}$$
Inserting (5.4) into the large-scale momentum equation (5.2), one obtains an equation for
 $U$
. This equation is a polynomial of order
 $2N+1$
, where
 $N\gg 1$
is the number of non-zero terms in the sum in (5.4). This implies, at least in principle, that there might be many real solutions for
 $U$
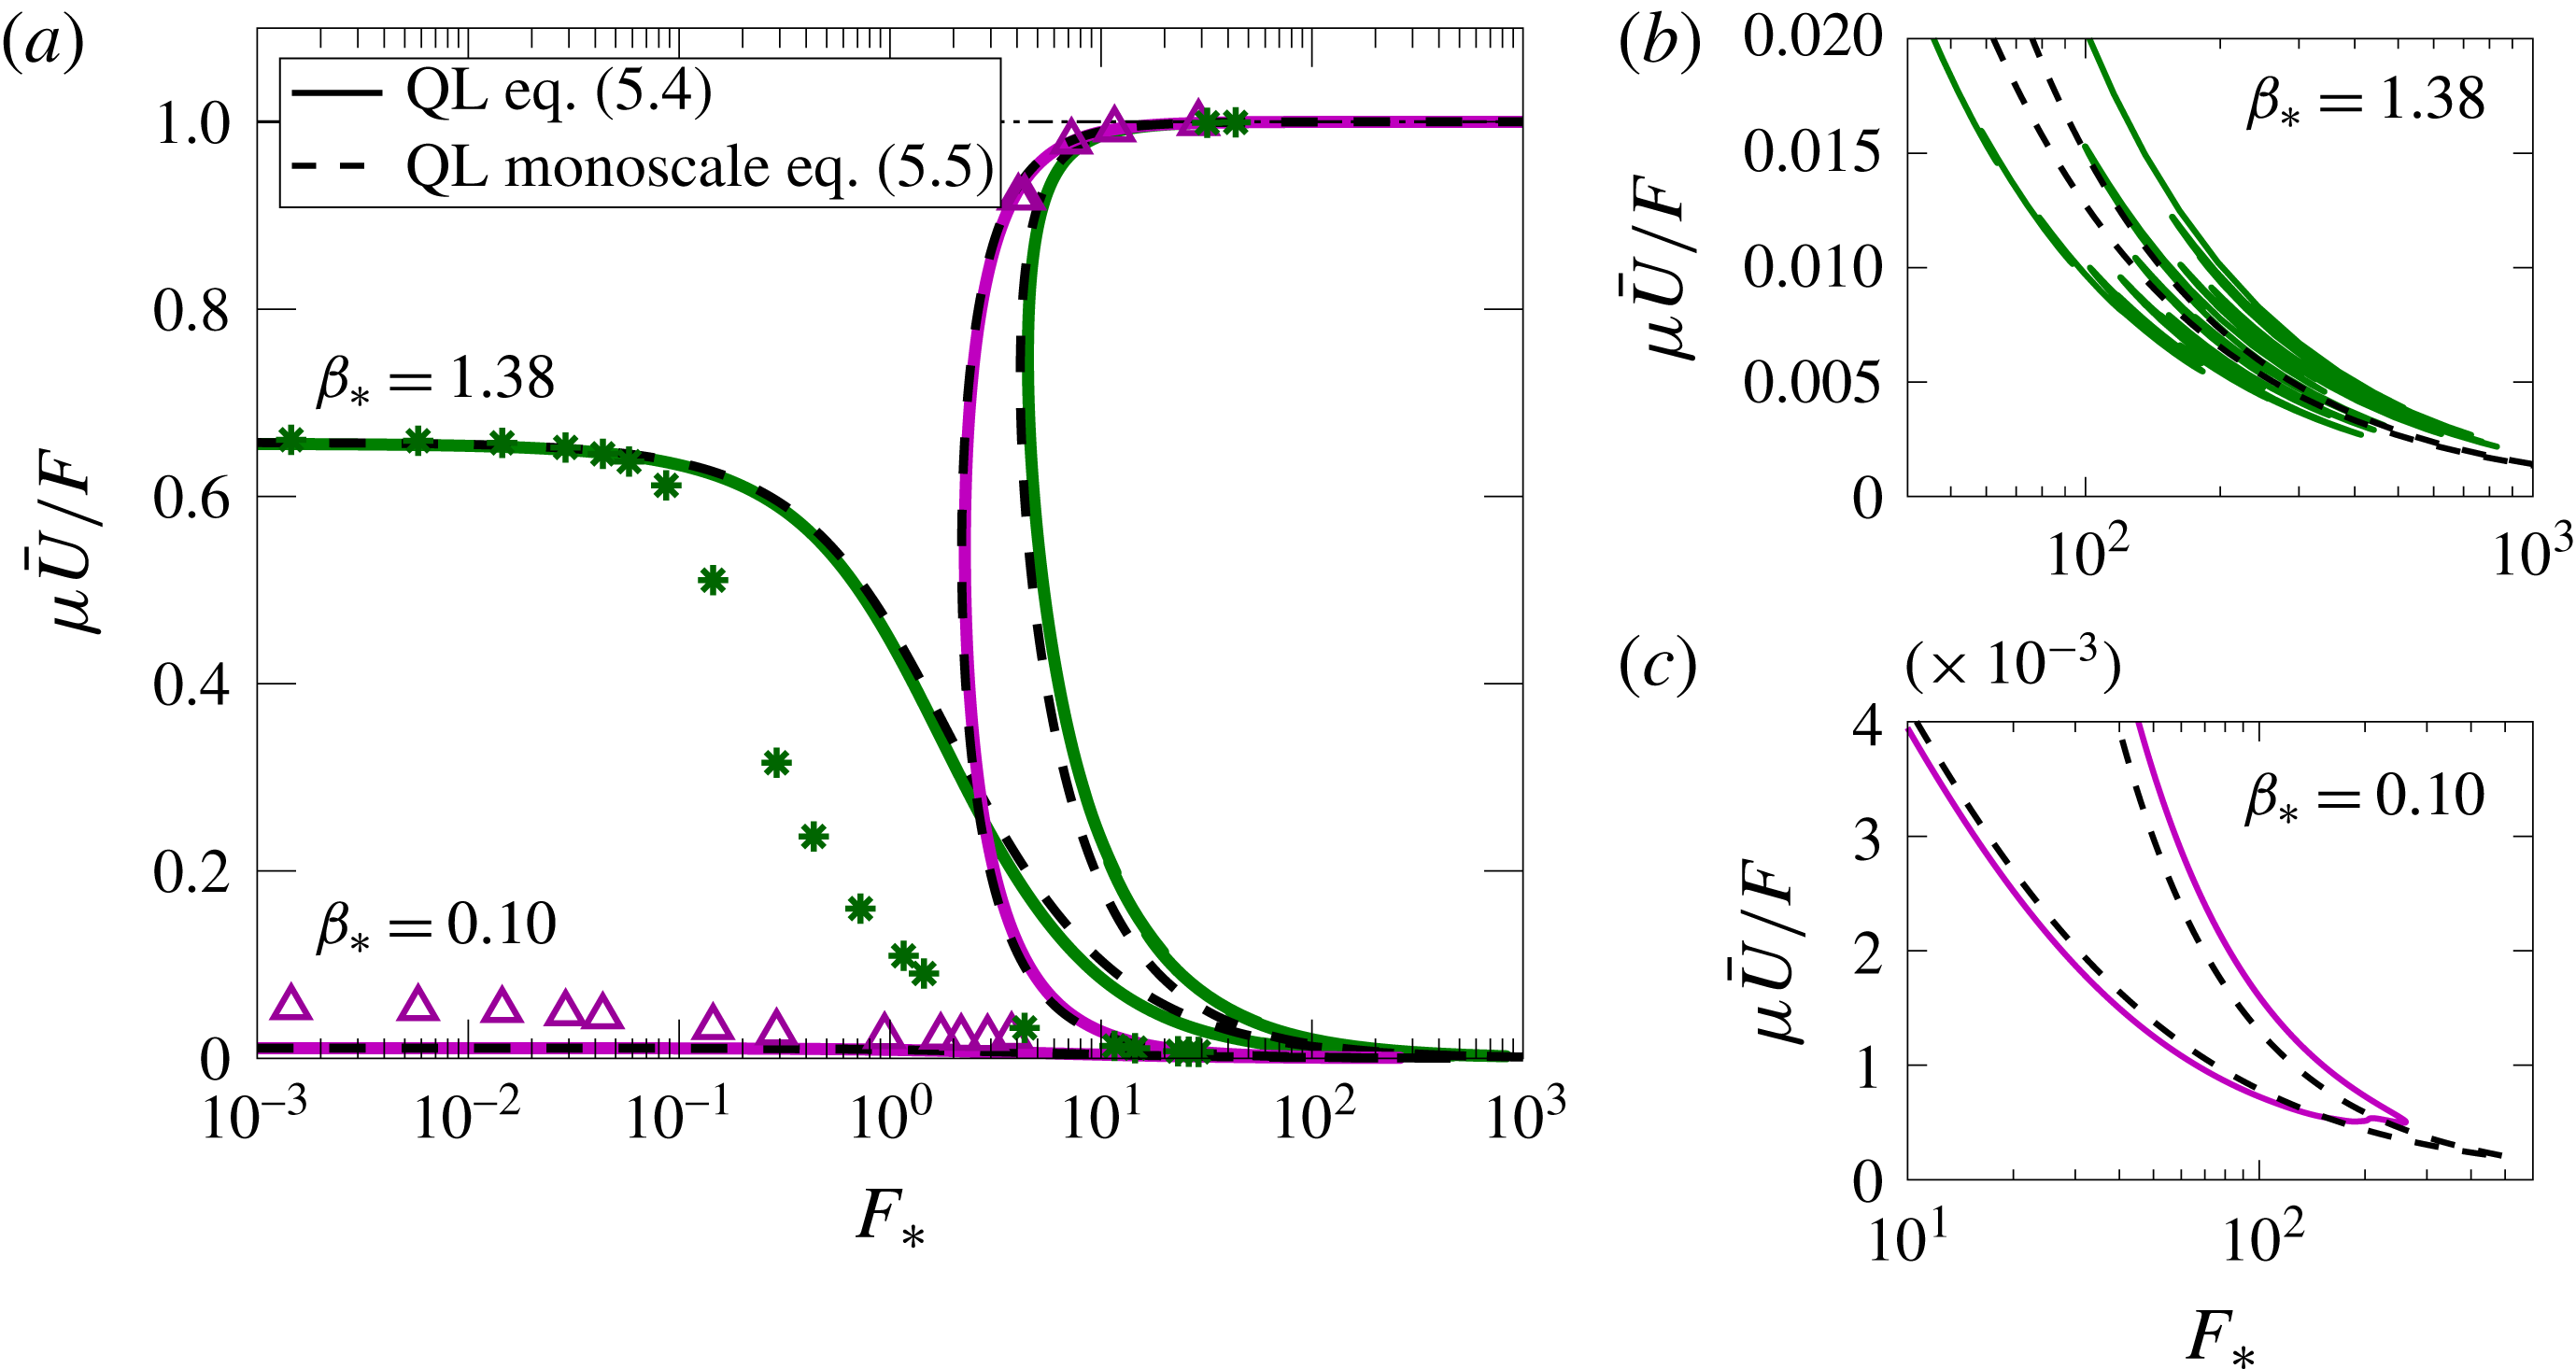
. However, for the monoscale topography of figure 2, we usually find either one or three real solutions as
 $F$
is varied; see figure 13(a). Only in a very limited parameter region do we find a multitude of additional real solutions; see figure 13(b). The fine-scale features evident in figure 13(b) vary greatly between different realizations of the topography and are irrelevant for the full nonlinear system.
(a) The large-scale flow,
 $\unicode[STIX]{x1D707}\bar{U}/F$
, as a function of the forcing
 $F_{\ast }$
for the cases with
 $\unicode[STIX]{x1D6FD}_{\ast }=0.10$
and 1.38. The solid curves are the QL predictions using a single realization to evaluate the sum in (5.4) and the dashed curves are the ensemble-average predictions from (5.5); the markers indicate the numerical solution of the full nonlinear system (1.1) and (2.3). (b,c) Detailed views of the bottom-right corner of (a); the resonances in the denominator of (5.4) come into play in this small region.

For the special case of isotropic monoscale topography, we simplify (5.4) by converting the sum over
 $\boldsymbol{k}$
into an integral that can be evaluated analytically (see appendix B). The result is
 $$\begin{eqnarray}\langle \unicode[STIX]{x1D713}\unicode[STIX]{x1D702}_{x}\rangle =\frac{\unicode[STIX]{x1D707}U\ell _{\unicode[STIX]{x1D702}}^{2}\unicode[STIX]{x1D702}_{\mathit{rms}}^{2}}{\unicode[STIX]{x1D707}^{2}\ell _{\unicode[STIX]{x1D702}}^{2}+(\unicode[STIX]{x1D6FD}\ell _{\unicode[STIX]{x1D702}}^{2}-U)^{2}+\unicode[STIX]{x1D707}\ell _{\unicode[STIX]{x1D702}}\sqrt{\unicode[STIX]{x1D707}^{2}\ell _{\unicode[STIX]{x1D702}}^{2}+(\unicode[STIX]{x1D6FD}\ell _{\unicode[STIX]{x1D702}}^{2}-U)^{2}}}.\end{eqnarray}$$
Expression (5.5) is a good approximation to the sum (5.4) for the monoscale topography of figure 2(a) that has power over an annular region in wavenumber space with width
 $\unicode[STIX]{x0394}k\,L\approx 8$
. The dashed curves in figure 13 are obtained by solving the mean-flow equation (5.2) with the form stress given by the analytic expression in (5.5). There is good agreement with the sum (5.4) except in the small regions shown in (b,c), where the resonances of the denominator come into play. This comparison shows that the form stress produced in a single realization of random topography is self-averaging, i.e. the ensemble average in (5.5) is close to the result obtained by evaluating the sum in (5.4) using a single realization of the
 $\unicode[STIX]{x1D702}_{\boldsymbol{k}}$
.
Figure 13 also compares the QL prediction in (5.4) and (5.5) with solutions of the full system. Regarding weak forcing (
 $F_{\ast }\ll 1$
), the QL approximation seriously underestimates
 $\unicode[STIX]{x1D707}U/F$
for the case with
 $\unicode[STIX]{x1D6FD}_{\ast }=0.1$
in figure 13. The failure of the QL approximation in this case with dominantly closed geostrophic contours is expected because the important term
 $\text{J}(\unicode[STIX]{x1D713},\unicode[STIX]{x1D702})$
is discarded in (5.1). On the other hand, the QL approximation has some success for the case with
 $\unicode[STIX]{x1D6FD}_{\ast }=1.38$
: proceeding in figure 13 from very small
 $F_{\ast }$
, we find close agreement until approximately
 $F_{\ast }\approx 0.1$
. At that point, the QL approximation departs from the full solution: the velocity
 $U$
predicted by the QL approximation is greater than the actual velocity, meaning that the QL form stress
 $\langle \bar{\unicode[STIX]{x1D713}}\unicode[STIX]{x1D702}_{x}\rangle$
is too small. This failure of the QL approximation is clearly associated with the linear instability of the steady solution and the development of transient eddies: the nonlinear results for the
 $\unicode[STIX]{x1D6FD}_{\ast }=1.38$
case in figure 13(a) first depart from the QL approximation when the index (4.4) signals the onset of unsteady flow. This failure of the QL theory due to transient eddies will be further discussed in § 8. For strong forcing (
 $F_{\ast }\gg 1$
), the QL approximation predicts the upper-branch solution very well.
The heuristic assumptions leading to the QL estimate (5.4) are drastic. However, we will see in §§ 6 and 7 that the QL approximation captures the qualitative behaviour of the full numerical solution and, in some parameter regimes such as
 $\unicode[STIX]{x1D6FD}_{\ast }\gtrapprox 1$
, even provides a good quantitative prediction of
 $\bar{U}$
.
6 The weakly forced regime,
$F_{\ast }\ll 1$

In this section, we consider the weakly forced case. In figures 8 and 9, this regime is characterized by the ‘effective drag’
 $\unicode[STIX]{x1D707}_{\mathit{eff}}$
in (4.2). Our main goal here is to determine
 $\unicode[STIX]{x1D707}_{\mathit{eff}}$
in the weakly forced regime.
Reducing the strength of the forcing
 $F_{\ast }$
to zero is equivalent to taking a limit in which the system is linear. This weakly forced flow is then steady,
 $\unicode[STIX]{x1D713}^{\prime }=0$
, and terms that are quadratic in the flow fields
 $U$
and
 $\unicode[STIX]{x1D713}$
, namely
 $U\unicode[STIX]{x1D701}_{x}$
and
 $\text{J}(\unicode[STIX]{x1D713},\unicode[STIX]{x1D701})$
, are negligible. Thus, in the limit
 $F_{\ast }\rightarrow 0$
, the eddy field satisfies the steady linearized QGPV equation,
 $$\begin{eqnarray}\text{J}(\unicode[STIX]{x1D713},\unicode[STIX]{x1D702})+\unicode[STIX]{x1D6FD}\unicode[STIX]{x1D713}_{x}+\unicode[STIX]{x1D707}\unicode[STIX]{x1D701}=-U\unicode[STIX]{x1D702}_{x}.\end{eqnarray}$$
When compared with the QL approximation (5.1), we see that (6.1) contains the additional linear term
 $\text{J}(\unicode[STIX]{x1D713},\unicode[STIX]{x1D702})$
and does not contain the nonlinear term
 $U\unicode[STIX]{x1D701}_{x}$
. We regard the right-hand side of the linear equation (6.1) as forcing that generates the streamfunction
 $\unicode[STIX]{x1D713}$
.
6.1 The case with either
$\unicode[STIX]{x1D707}_{\ast }\gg 1$
or
$\unicode[STIX]{x1D6FD}_{\ast }\gg 1$


Assuming that lengths scale with
 $\ell _{\unicode[STIX]{x1D702}}$
, the ratio of the terms on the left-hand side of (6.1) is
 $$\begin{eqnarray}\unicode[STIX]{x1D6FD}\unicode[STIX]{x1D713}_{x}/\text{J}\left(\unicode[STIX]{x1D713},\unicode[STIX]{x1D702}\right)=O(\unicode[STIX]{x1D6FD}_{\ast })\quad \text{and}\quad \unicode[STIX]{x1D707}\unicode[STIX]{x1D701}/\text{J}\left(\unicode[STIX]{x1D713},\unicode[STIX]{x1D702}\right)=O(\unicode[STIX]{x1D707}_{\ast }).\end{eqnarray}$$
If
 $\unicode[STIX]{x1D707}_{\ast }\gg 1$
or if
 $\unicode[STIX]{x1D6FD}_{\ast }\gg 1$
, then
 $\text{J}\left(\unicode[STIX]{x1D713},\unicode[STIX]{x1D702}\right)$
is negligible relative to one, or both, of the other two terms on the left-hand side of (6.1). In that case, one can neglect the Jacobian in (6.1) and adapt the QL expression (5.5) to determine the effective drag of monoscale topography as
 $$\begin{eqnarray}\unicode[STIX]{x1D707}_{\mathit{eff}}=\unicode[STIX]{x1D707}+\frac{\unicode[STIX]{x1D707}\unicode[STIX]{x1D702}_{\mathit{rms}}^{2}\ell _{\unicode[STIX]{x1D702}}^{2}}{\unicode[STIX]{x1D707}^{2}\ell _{\unicode[STIX]{x1D702}}^{2}+\unicode[STIX]{x1D6FD}^{2}\ell _{\unicode[STIX]{x1D702}}^{4}+\unicode[STIX]{x1D707}\ell _{\unicode[STIX]{x1D702}}\sqrt{\unicode[STIX]{x1D707}^{2}\ell _{\unicode[STIX]{x1D702}}^{2}+\unicode[STIX]{x1D6FD}^{2}\ell _{\unicode[STIX]{x1D702}}^{4}}}.\end{eqnarray}$$
In simplifying the QL expression (5.5) to the linear result (6.3), we have neglected
 $U$
relative to either
 $\unicode[STIX]{x1D6FD}\ell _{\unicode[STIX]{x1D702}}^{2}$
or
 $\unicode[STIX]{x1D707}\ell _{\unicode[STIX]{x1D702}}$
. This simplification is appropriate in the limit
 $F_{\ast }\rightarrow 0$
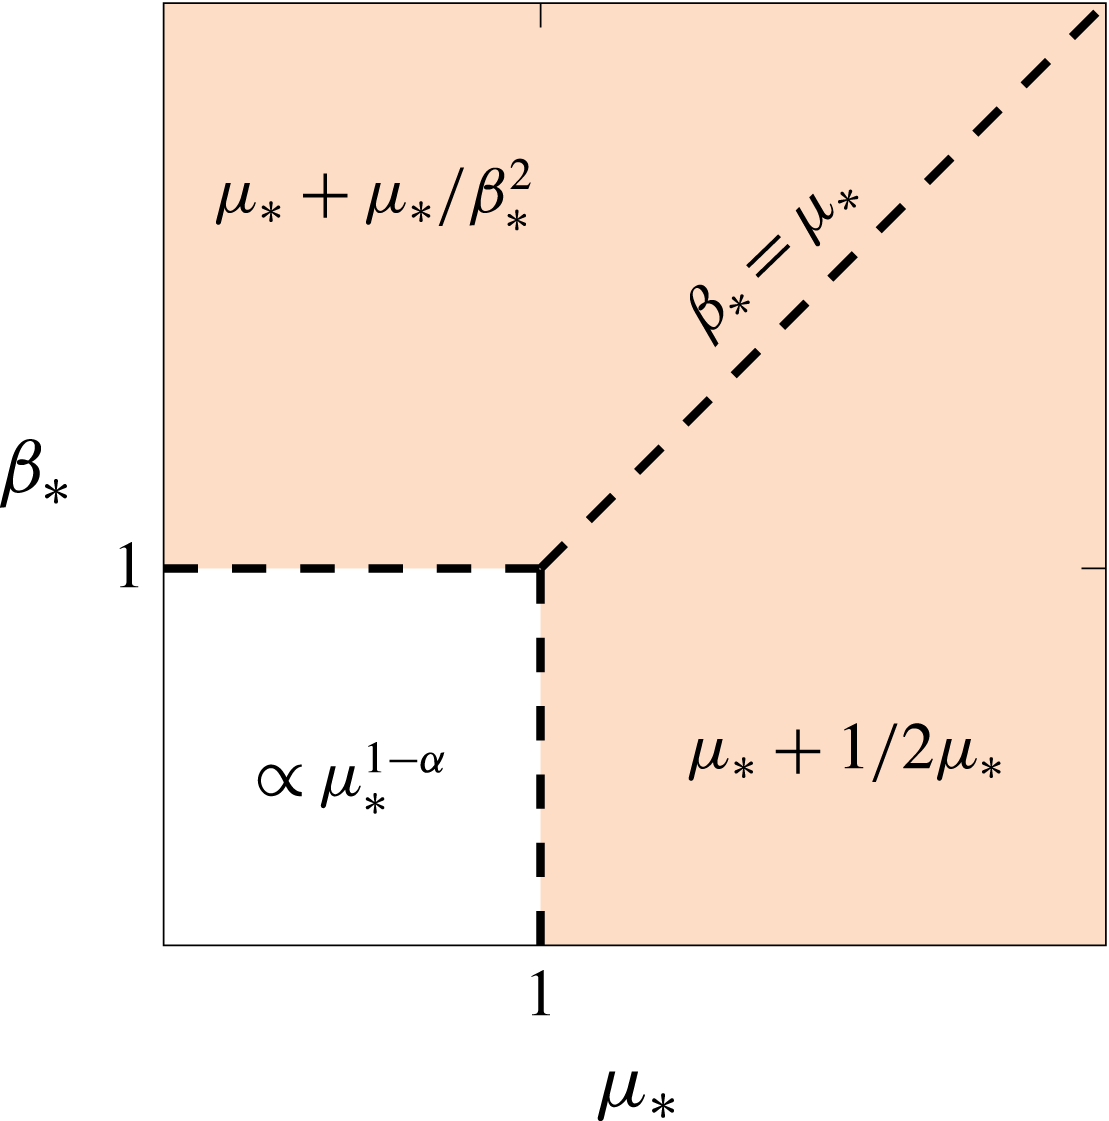
. The expression in (6.3) is accurate within the shaded region in figure 14. The dashed lines in figures 8 and 9(a) that correspond to the series with
 $\unicode[STIX]{x1D6FD}_{\ast }\geqslant 0.35$
indicate the approximation
 $\bar{U}\approx F/\unicode[STIX]{x1D707}_{\mathit{eff}}$
with
 $\unicode[STIX]{x1D707}_{\mathit{eff}}$
in (6.3).
Schematic for the three different parameter regions in the weakly forced regime. The shaded region depicts the parameter range for which the QL theory gives good predictions. For
 $\unicode[STIX]{x1D6FD}_{\ast }<1$
and
 $\unicode[STIX]{x1D707}_{\ast }<1$
, the form stress and the large-scale flow largely depend on the actual geometry of the topography and
 $\text{J}(\unicode[STIX]{x1D713},\unicode[STIX]{x1D702})$
cannot be neglected. The expressions show the behaviour of
 ${\unicode[STIX]{x1D707}_{\mathit{eff}}}_{\ast }=\unicode[STIX]{x1D707}_{\mathit{eff}}/\unicode[STIX]{x1D702}_{\mathit{rms}}$
in each parameter region.

6.2 The thermal analogy – the case with
$\unicode[STIX]{x1D707}_{\ast }\lessapprox 1$
and
$\unicode[STIX]{x1D6FD}_{\ast }\lessapprox 1$


When both
 $\unicode[STIX]{x1D707}_{\ast }$
and
 $\unicode[STIX]{x1D6FD}_{\ast }$
are order one or less, the term
 $\text{J}(\unicode[STIX]{x1D713},\unicode[STIX]{x1D702})$
in (6.1) cannot be neglected. As a result of this Jacobian, the weakly forced regime cannot be recovered as a special case of the QL approximation. In this interesting case, we rewrite (6.1) as
 $$\begin{eqnarray}\text{J}(\unicode[STIX]{x1D702}+\unicode[STIX]{x1D6FD}y,\unicode[STIX]{x1D713}-Uy)=\unicode[STIX]{x1D707}\unicode[STIX]{x1D6FB}^{2}\unicode[STIX]{x1D713}\end{eqnarray}$$
and rely on intuition based on the ‘thermal analogy’. To apply the analogy, we regard
 $\unicode[STIX]{x1D702}+\unicode[STIX]{x1D6FD}y$
as an effective steady streamfunction advecting a passive scalar
 $\unicode[STIX]{x1D713}-Uy$
. The planetary PV gradient
 $\unicode[STIX]{x1D6FD}$
is analogous to a large-scale zonal flow
 $-\unicode[STIX]{x1D6FD}$
, and the large-scale flow
 $U$
is analogous to a large-scale tracer gradient. The drag
 $\unicode[STIX]{x1D707}$
is equivalent to the diffusivity of the scalar. The form stress
 $\left\langle \unicode[STIX]{x1D713}\unicode[STIX]{x1D702}_{x}\right\rangle$
is analogous to the meridional flux of tracer
 $\unicode[STIX]{x1D713}$
by the meridional velocity
 $\unicode[STIX]{x1D702}_{x}$
. The geostrophic contours are equivalent to streamlines in the thermal analogy. Usually, in the passive-scalar problem, the large-scale tracer gradient
 $U$
is imposed and the main goal is to determine the flux
 $\left\langle \unicode[STIX]{x1D713}\unicode[STIX]{x1D702}_{x}\right\rangle$
(equivalently, the Nusselt number). However, here,
 $U$
is unknown and must be determined by satisfying the steady version of the large-scale momentum equation (5.2).
With the thermal analogy, we can import results from the passive-scalar problem. For example, in the passive-scalar problem, at large Péclet number, the scalar is uniform within closed streamlines (Batchelor Reference Batchelor1956; Rhines & Young Reference Rhines and Young1983). The analogue of this ‘Prandtl–Batchelor theorem’ is that in the limit
 $\unicode[STIX]{x1D707}_{\ast }\rightarrow 0$
, the total streamfunction,
 $\unicode[STIX]{x1D713}-Uy$
, is constant within any closed geostrophic contour, i.e. all parts of the domain contained within closed geostrophic contours are stagnant; see also Ingersoll (Reference Ingersoll1969). This ‘Prandtl–Batchelor theorem’ explains the result in figure 15, which shows a weakly forced small-drag solution with
 $\unicode[STIX]{x1D6FD}_{\ast }=0$
. The domain is packed with stagnant eddies (constant
 $\unicode[STIX]{x1D713}-Uy$
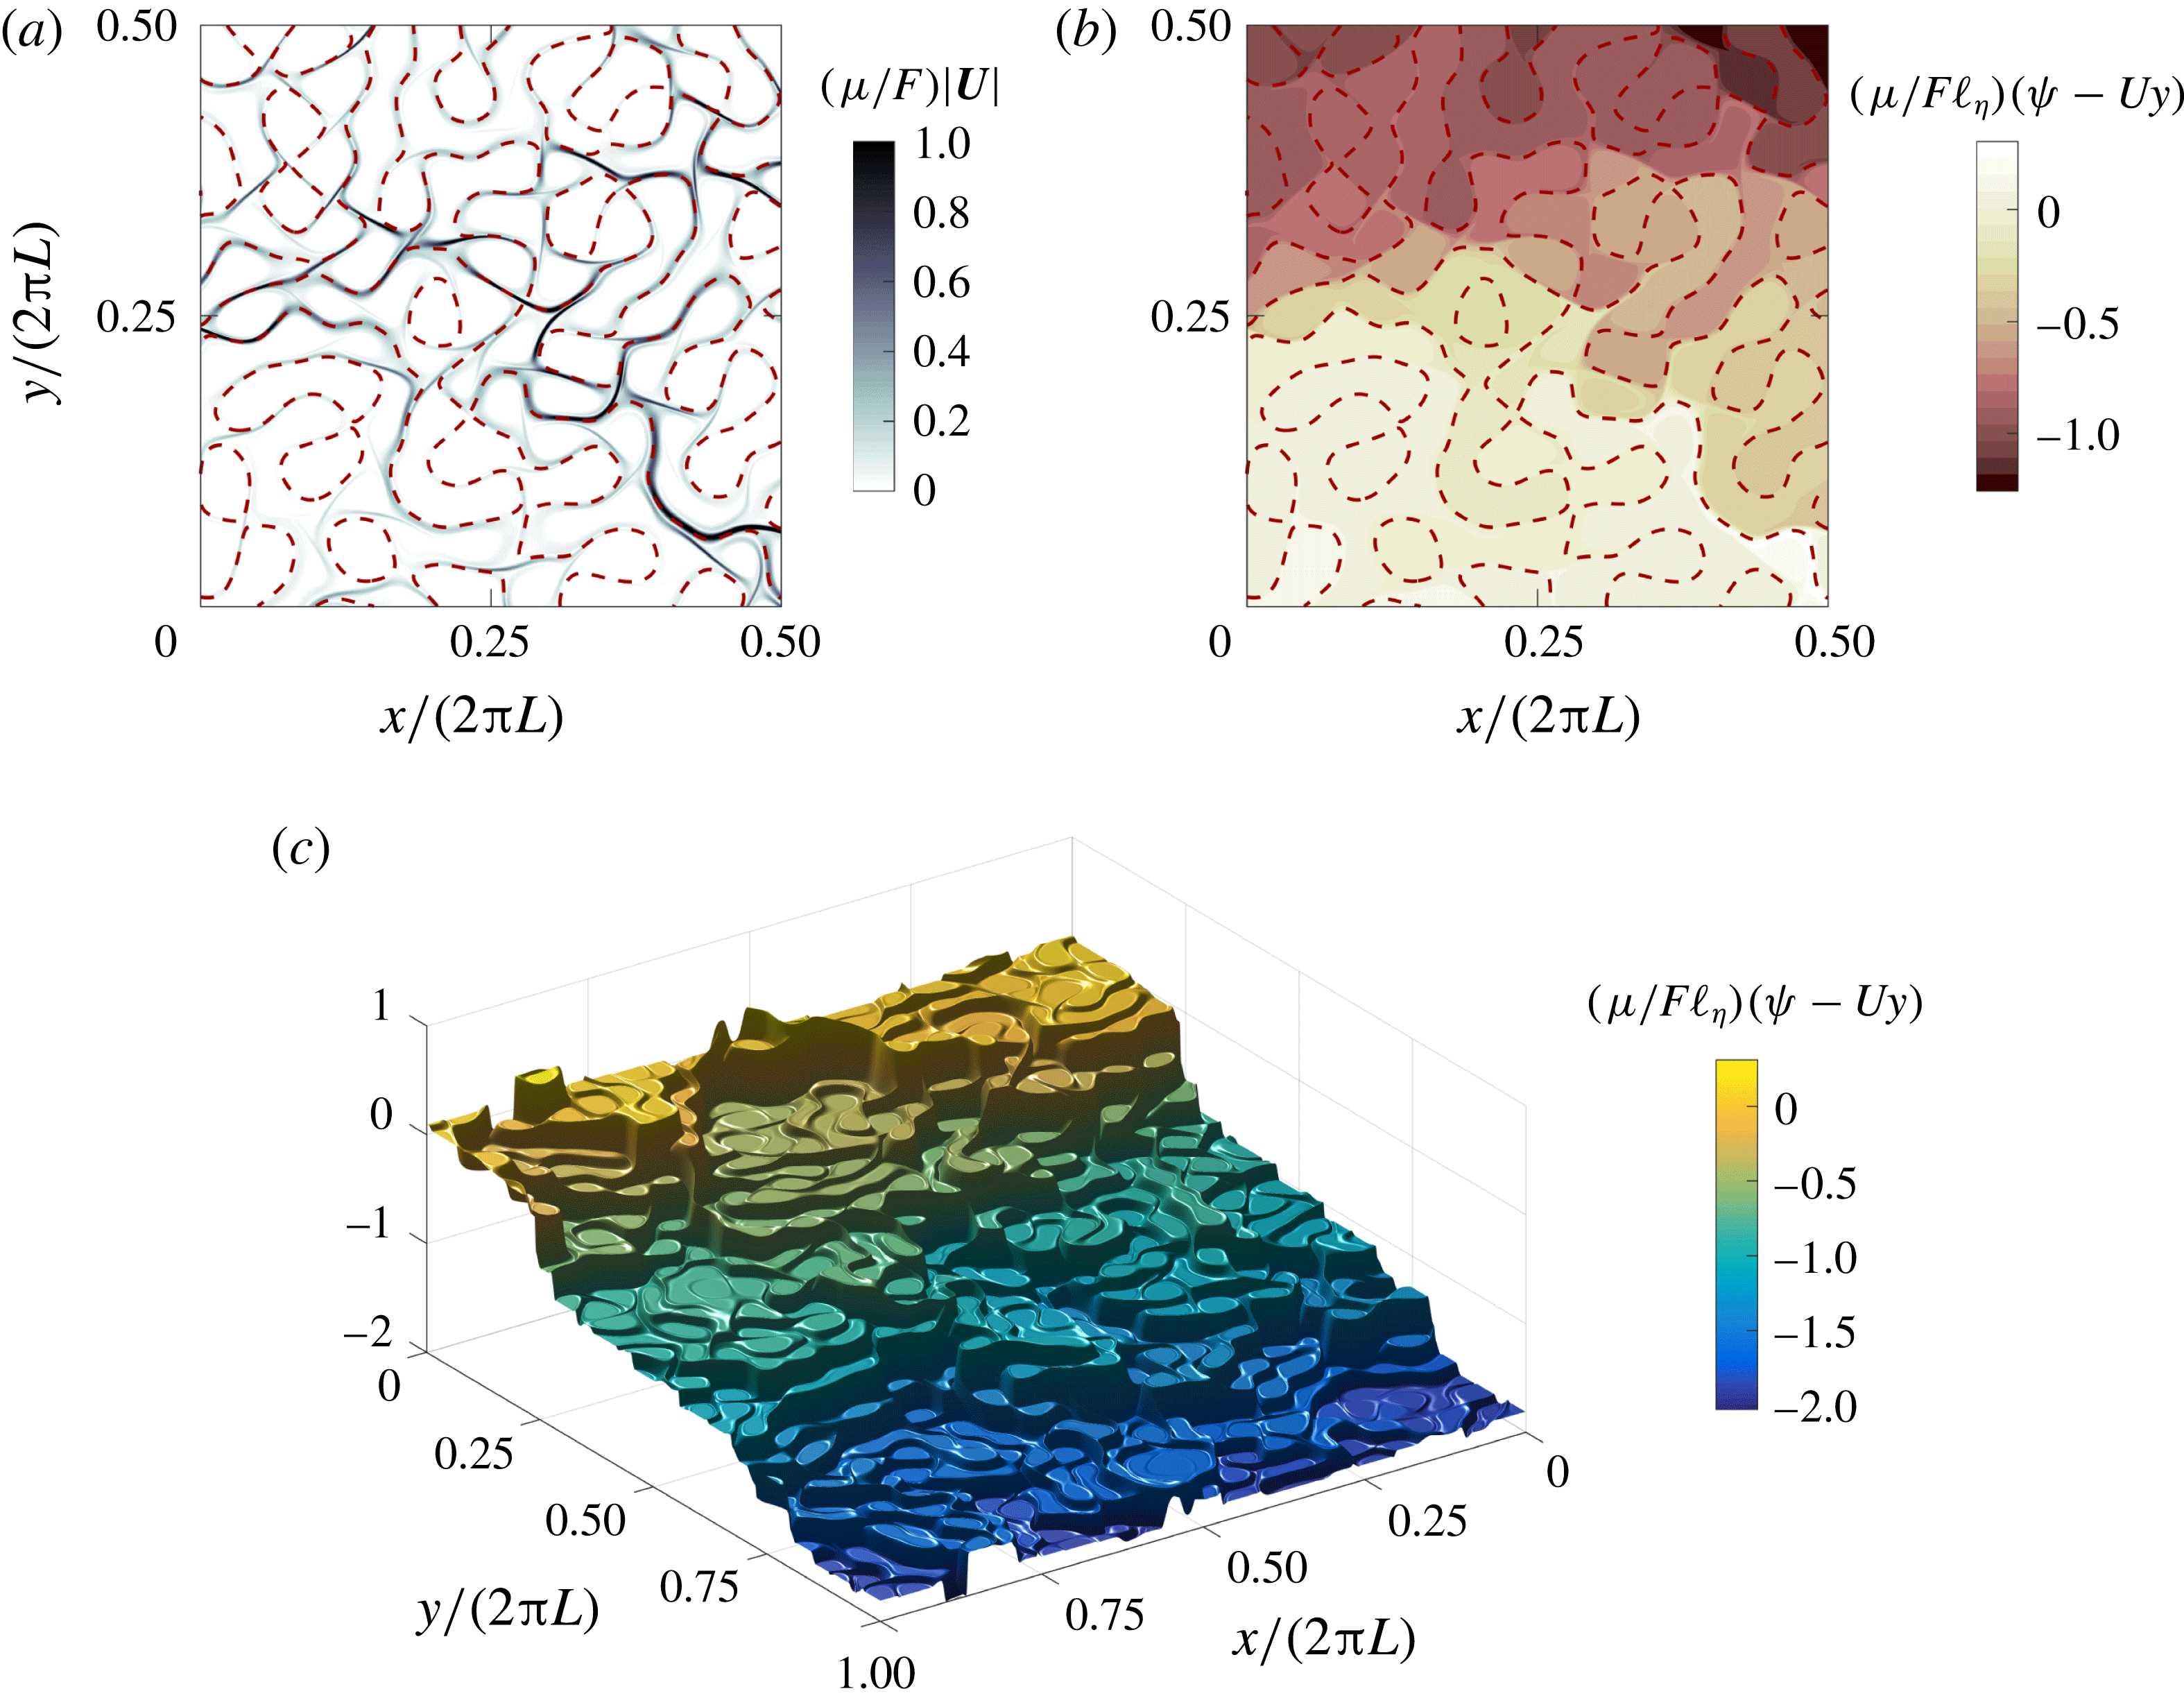
) separated by thin boundary layers. The ‘terraced hillside’ in figure 15(c) is even more striking than in figure 5(b). The solution in figure 5 has transient eddies, resulting a blurring of the terraced structure. The weakly forced solution in figure 15 is steady and the thickness of the steps between the terraces is limited only by the small drag,
 $\unicode[STIX]{x1D707}_{\ast }=5\times 10^{-3}$
.
Snapshots of the flow fields for the weakly forced solution at
 $F_{\ast }=10^{-3}$
with dissipation
 $\unicode[STIX]{x1D707}_{\ast }=5\times 10^{-3}$
and
 $\unicode[STIX]{x1D6FD}_{\ast }=0$
. (a) The total flow speed
 $|\boldsymbol{U}|$
. The flow is restricted to a boundary layer around the dashed
 $\unicode[STIX]{x1D702}=0$
contour. (b) The total streamfunction
 $\unicode[STIX]{x1D713}-Uy$
. (c) Surface plot of the total streamfunction,
 $\unicode[STIX]{x1D713}-Uy$
. The terraced hillside structure is apparent. (In (a,b), only one quarter of the domain is shown.)

The large-scale flow for weakly forced solutions (
 $F_{\ast }=10^{-3}$
) with
 $\unicode[STIX]{x1D6FD}=0$
as a function of
 $\unicode[STIX]{x1D707}_{\ast }$
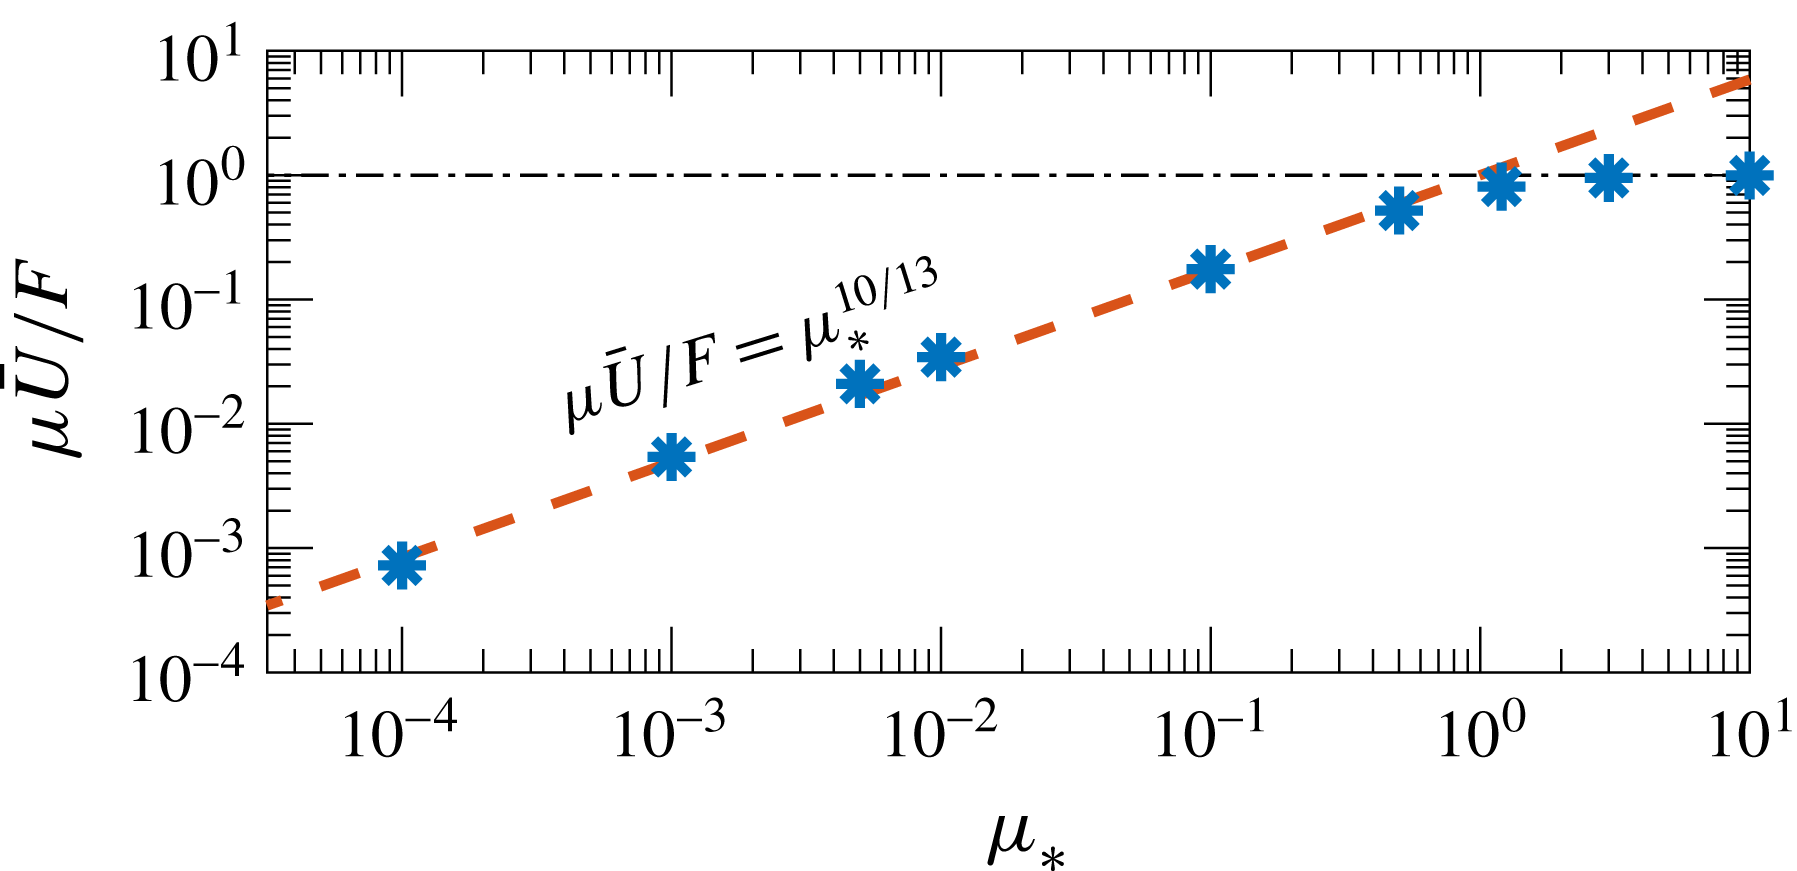
. The dashed line shows the scaling law (6.5) with
 $c=1$
.

Isichenko et al. (Reference Isichenko, Kalda, Tatarinova, Tel’kovskaya and Yan’kov1989) and Gruzinov, Isichenko & Kalda (Reference Gruzinov, Isichenko and Kalda1990) discussed the effective diffusivity of a passive scalar due to advection by a steady monoscale streamfunction. Using a scaling argument, Isichenko et al. (Reference Isichenko, Kalda, Tatarinova, Tel’kovskaya and Yan’kov1989) showed that in the high-Péclet-number limit, the effective diffusivity of a steady monoscale flow is
 $D_{\mathit{eff}}=DP^{10/13}$
, where
 $D$
is the small molecular diffusivity and
 $P$
is the Péclet number; the exponent
 $10/13$
relies on critical exponents determined by percolation theory. Applying Isichenko’s passive-scalar results to the
 $\unicode[STIX]{x1D6FD}=0$
form-stress problem, we obtain the scaling
 $$\begin{eqnarray}\unicode[STIX]{x1D707}_{\mathit{eff}}=c\unicode[STIX]{x1D707}^{3/13}\unicode[STIX]{x1D702}_{\mathit{rms}}^{10/13}\quad \text{and}\quad \frac{\unicode[STIX]{x1D707}\bar{U}}{F}=\frac{1}{c}\left(\frac{\unicode[STIX]{x1D707}}{\unicode[STIX]{x1D702}_{\mathit{rms}}}\right)^{10/13},\end{eqnarray}$$
where
 $c$
is a dimensionless constant. Numerical solutions of (1.1) and (2.3) summarized in figure 16 confirm this remarkable ‘10/13’ scaling and show that the constant
 $c$
in (6.5) is close to unity. The dashed lines in figures 8 and 9(b) corresponding to the solution suites with
 $\unicode[STIX]{x1D6FD}_{\ast }\leqslant 0.1$
show the scaling law (6.5) with
 $c=1$
.
To summarize, the weakly forced regime is divided into the easy large-
 $\unicode[STIX]{x1D6FD}$
case, in which
 $\unicode[STIX]{x1D707}_{\mathit{eff}}$
in (6.3) applies, and the more difficult case with small or zero
 $\unicode[STIX]{x1D6FD}$
. In the difficult case, with closed geostrophic contours, the thermal analogy and the Prandtl–Batchelor theorem show that the flow is partitioned into stagnant dead zones; Isichenko’s
 $\unicode[STIX]{x1D6FD}=0$
scaling law in (6.5) is the main result in this case. The value of
 $\unicode[STIX]{x1D6FD}_{\ast }$
separating these two regimes in the schematic of figure 14 is identified with the value of
 $\unicode[STIX]{x1D6FD}$
below which (6.3) underestimates
 $\unicode[STIX]{x1D707}U/F$
compared with (6.5). For the topography used in this work, and taking
 $c=1$
in (6.5), this is
 $\unicode[STIX]{x1D6FD}_{\ast }=0.17$
. (If we choose
 $c=0.5$
, the critical value is
 $\unicode[STIX]{x1D6FD}_{\ast }=0.24$
.) This rationalizes why the
 $\unicode[STIX]{x1D6FD}=0$
result in (6.5) works better than
 $\unicode[STIX]{x1D707}_{\mathit{eff}}$
in (6.3) for
 $\unicode[STIX]{x1D6FD}_{\ast }<0.35$
; see figure 9.
7 The strongly forced regime,
$F_{\ast }\gg 1$

We turn now to the upper branch, i.e. to the flow beyond the drag crisis. In this strongly forced regime, the flow is steady,
 $\unicode[STIX]{x1D713}^{\prime }=U^{\prime }=0$
, and the QL theory gives good results for all values of
 $\unicode[STIX]{x1D6FD}_{\ast }$
.
The solutions in figure 11(a) show that on the upper branch, the large-scale flow
 $\bar{U}$
is much faster than the phase speed of the Rossby waves excited by the topography, i.e.
 $\bar{U}\gg \unicode[STIX]{x1D6FD}\ell _{\unicode[STIX]{x1D702}}^{2}$
. Therefore, we can simplify the QL approximation in (5.5) by neglecting terms smaller than
 $\unicode[STIX]{x1D6FD}\ell _{\unicode[STIX]{x1D702}}^{2}/U$
. This gives
 $$\begin{eqnarray}\langle \unicode[STIX]{x1D713}\unicode[STIX]{x1D702}_{x}\rangle =\frac{\unicode[STIX]{x1D707}\unicode[STIX]{x1D702}_{\mathit{rms}}^{2}\ell _{\unicode[STIX]{x1D702}}^{2}}{U}+O(\unicode[STIX]{x1D6FD}\ell _{\unicode[STIX]{x1D702}}^{2}/U)^{2}.\end{eqnarray}$$
This result is independent of
 $\unicode[STIX]{x1D6FD}$
up to
 $O(\unicode[STIX]{x1D6FD}\ell _{\unicode[STIX]{x1D702}}^{2}/U)^{2}$
. Using (7.1) in the large-scale zonal momentum equation (5.2), while keeping in mind that
 $0\leqslant U\leqslant F/\unicode[STIX]{x1D707}$
, we solve a quadratic equation for
 $U$
to obtain
 $$\begin{eqnarray}\frac{\unicode[STIX]{x1D707}U}{F}=\frac{1}{2}+\sqrt{\frac{1}{4}-\frac{1}{F_{\ast }^{2}}}.\end{eqnarray}$$
The location of the drag crisis depends on
 $\unicode[STIX]{x1D6FD}$
, and on details of the topography that are beyond the reach of the QL approximation. However, once the solution is on the upper branch, these complications are irrelevant, e.g. (7.2) does not contain
 $\unicode[STIX]{x1D6FD}$
. The dashed curve in figure 17 compares (7.2) with numerical solutions of the full system and shows close agreement.
We get further intuition about the structure of the upper-branch flow through the QL equation (5.1). For large
 $U$
, we have a two-term balance in (5.1) that gives
 $\bar{\unicode[STIX]{x1D701}}\approx -\unicode[STIX]{x1D702}$
, so that
 $\bar{q}$
is
 $O(\ell _{\unicode[STIX]{x1D702}}\unicode[STIX]{x1D702}_{\mathit{rms}}^{-2}U^{-1})$
. Figure 12(a) shows that on the upper branch, the correlation of
 $\bar{\unicode[STIX]{x1D701}}$
with
 $\unicode[STIX]{x1D702}$
is close to
 $-1$
, and numerical upper-branch solutions confirm that
 $\bar{\unicode[STIX]{x1D701}}\approx \unicode[STIX]{x1D702}$
.

8 Intermediate forcing: eddy saturation and the drag crisis
In §§ 6 and 7, we discussed limiting cases with weak and strong forcing respectively. In both of these limits, the solution has no transient eddies. We now turn to the more complicated situation with forcing of intermediate strength. In this regime, transient eddies arise and numerical solutions show that these transient eddies produce drag that is additional to the QL prediction (see figure 13 and the related discussion). The eddy saturation regime, in which
 $U$
is insensitive to large changes in
 $F_{\ast }$
(see figure 11), is also characterized by forcing of intermediate strength; the solution described in § 3.5 is an example. Thus, a goal is to better understand the eddy saturation regime and its termination by the drag crisis.
8.1 Eddy saturation regime
As wind stress increases transient eddies emerge; in figure 10, this instability of the steady solution occurs very roughly at
 $F_{\ast }=1.5\times 10^{-2}$
for all values of
 $\unicode[STIX]{x1D6FD}$
. The power integrals in appendix A show that the transient eddies gain kinetic energy from the standing eddies
 $\bar{\unicode[STIX]{x1D713}}$
through the conversion term
 $\langle \bar{\unicode[STIX]{x1D713}}\unicode[STIX]{x1D735}\boldsymbol{\cdot }\boldsymbol{E}\rangle$
, where
 $$\begin{eqnarray}\boldsymbol{E}\stackrel{\text{def}}{=}\,\overline{\boldsymbol{U}^{\prime }q^{\prime }}\end{eqnarray}$$
is the time-averaged eddy PV flux.
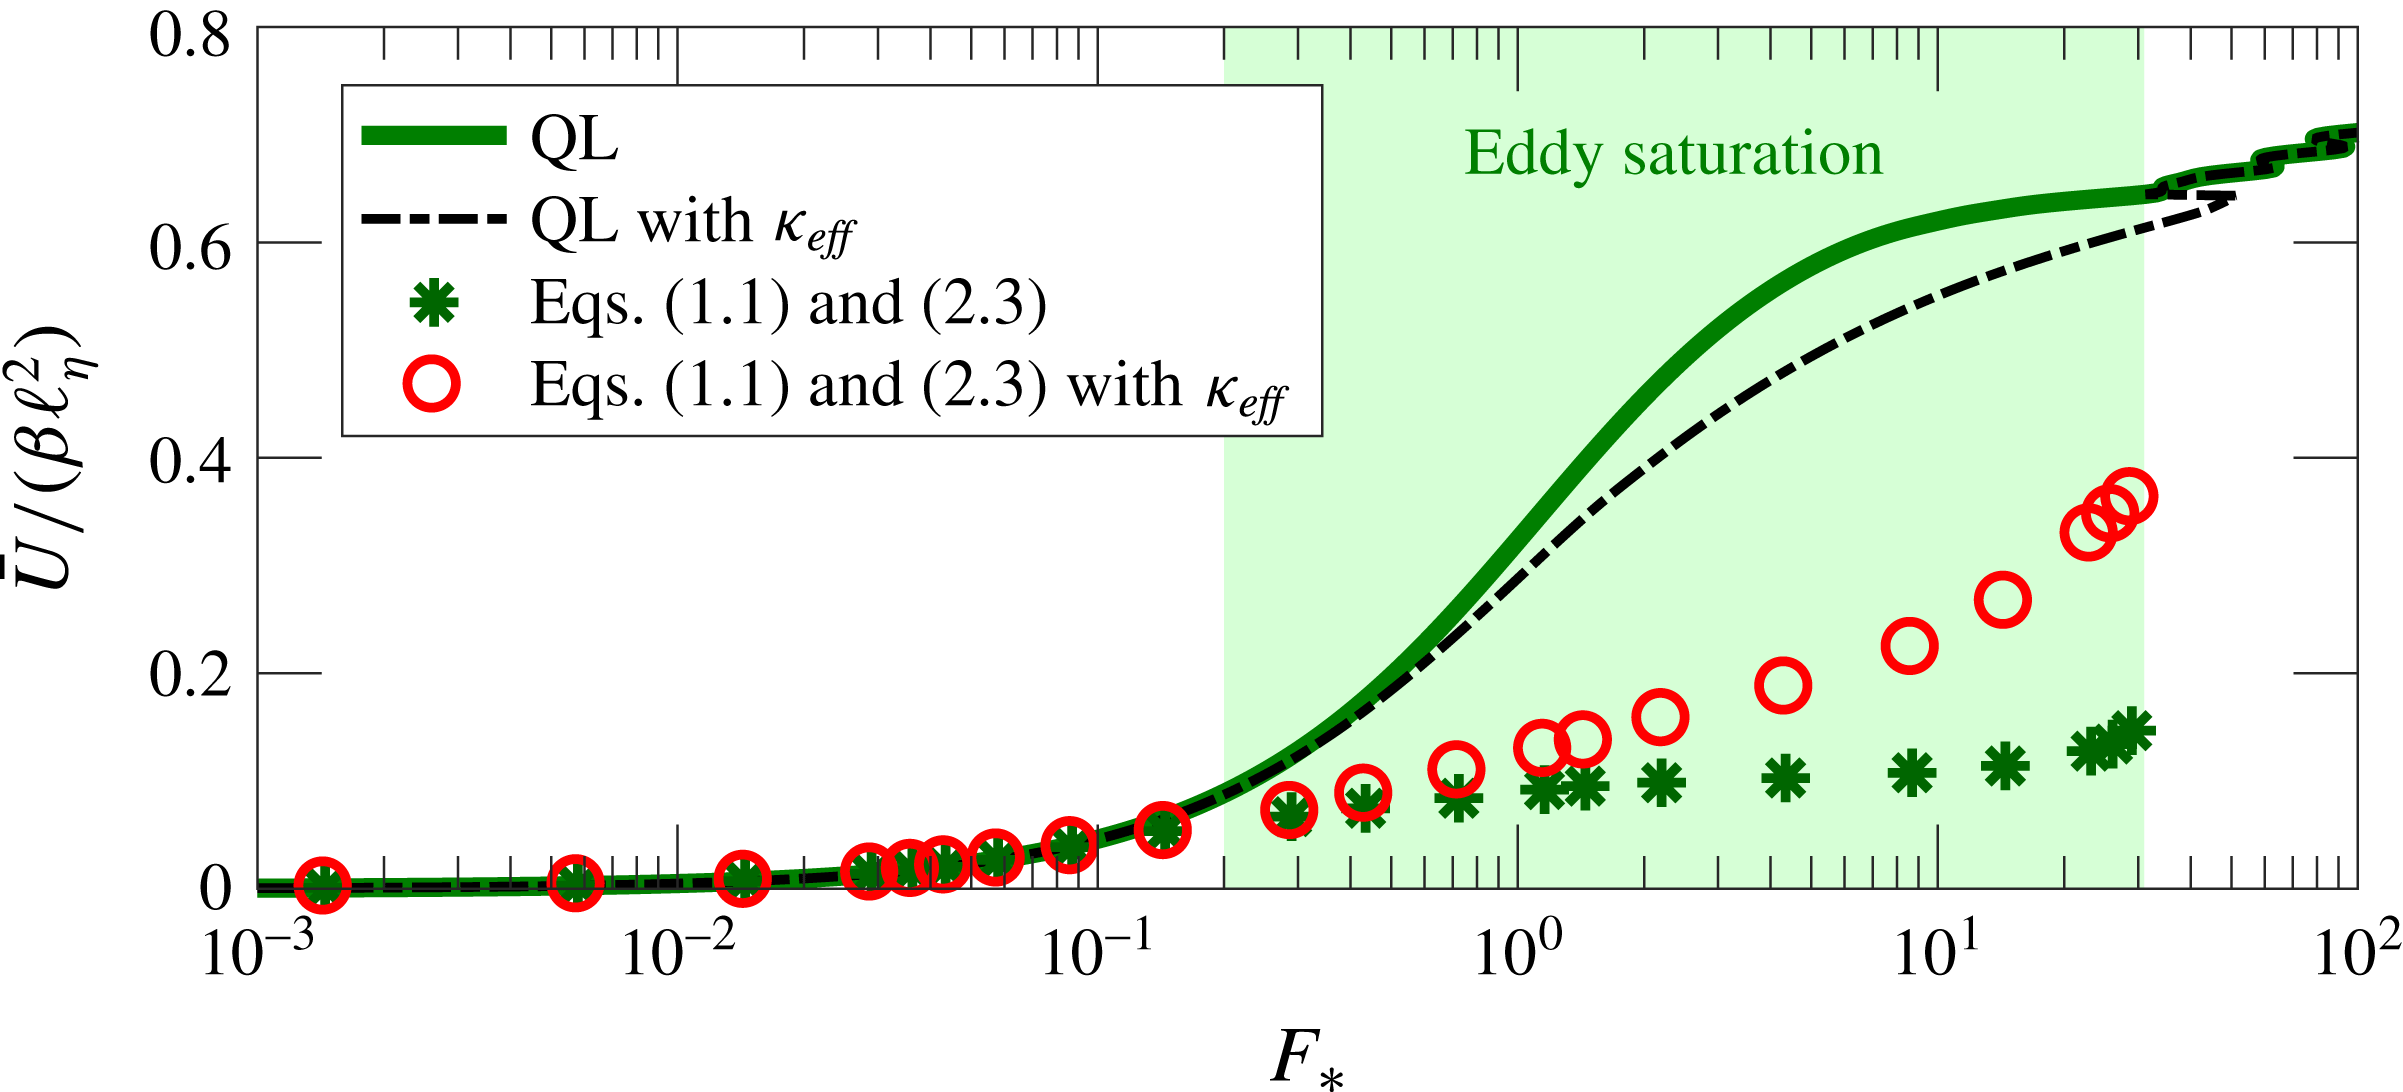
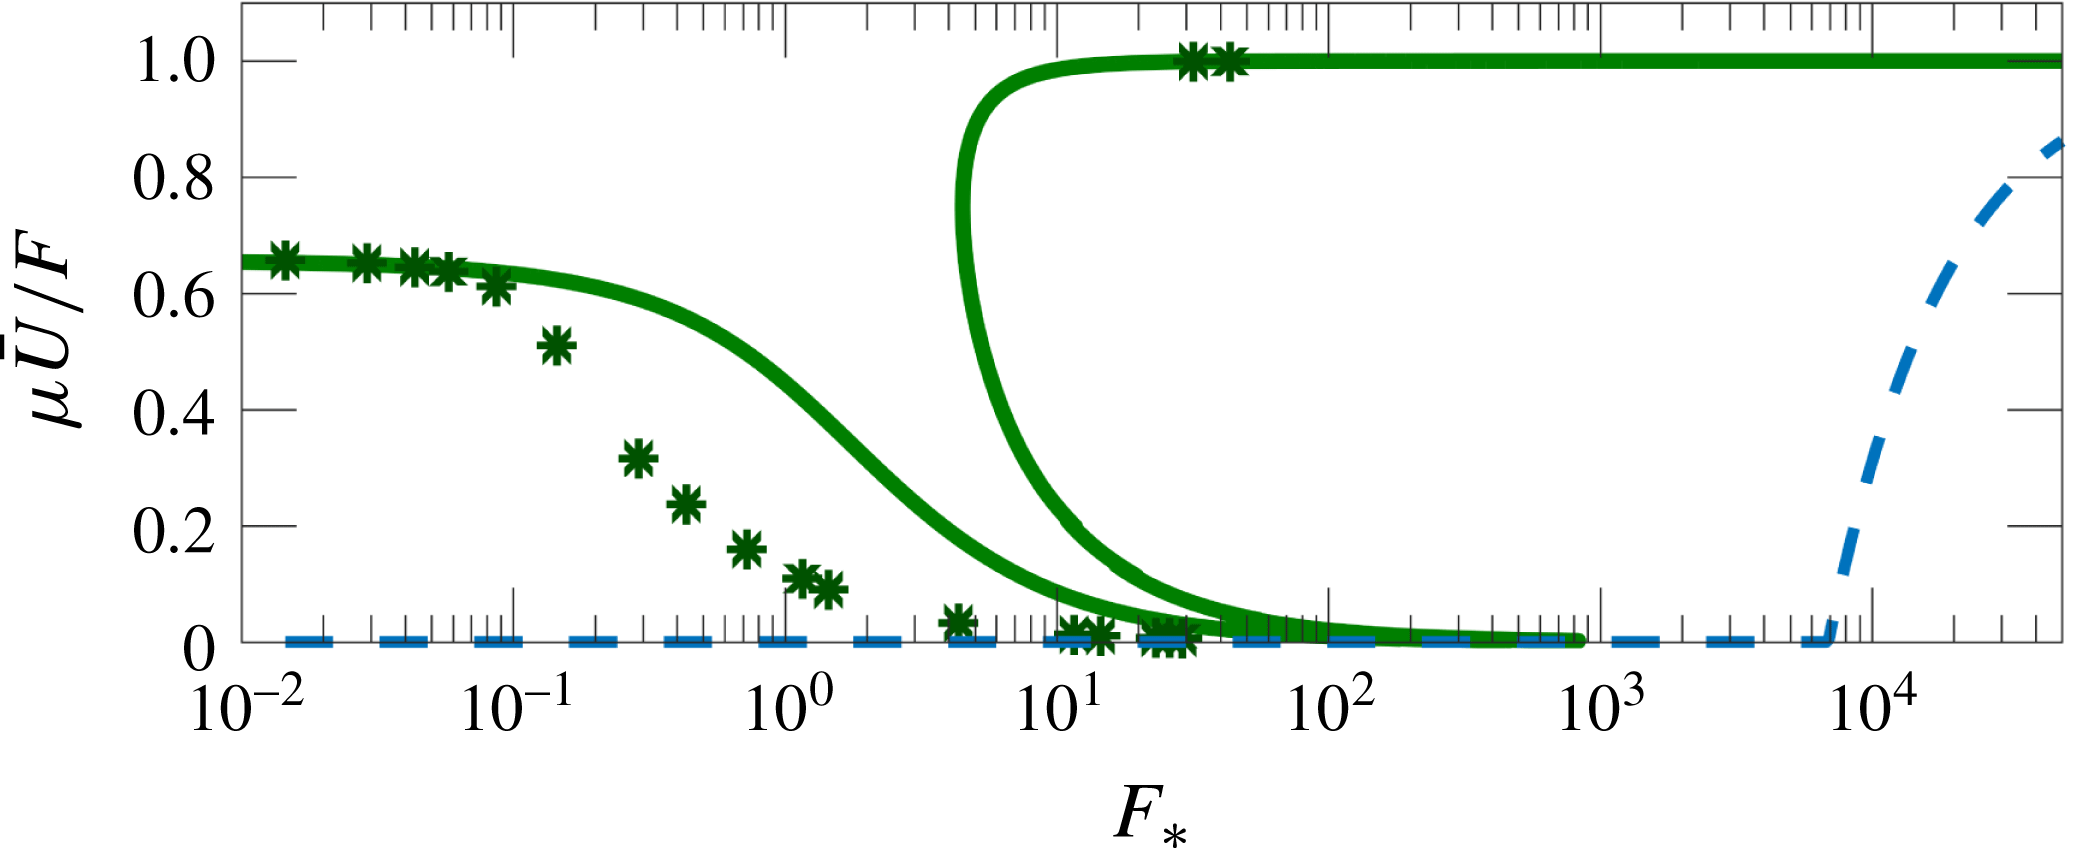
Figure 18 compares the numerical solutions of (1.1) and (2.3) with the prediction of the QL approximation (asterisks versus the solid QL curve) for the case with
 $\unicode[STIX]{x1D6FD}_{\ast }=1.38$
. The QL approximation has a stronger large-scale flow than that of the full system in (1.1) and (2.3). Moreover, the full system is more impressively eddy saturated than its QL approximation. There are at least two causes for these failures of the QL approximation: (i) the QL approximation assumes steady flow and has no way of incorporating the effect of transient eddies on the time-mean flow and (ii) the QL approximation neglects the term
 $\text{J}(\bar{\unicode[STIX]{x1D713}},\bar{q})$
.
We address these points by following Rhines & Young (Reference Rhines and Young1982) and approximating the effect of the transient eddies as PV diffusion:
 $$\begin{eqnarray}\unicode[STIX]{x1D735}\boldsymbol{\cdot }\boldsymbol{E}\approx -\unicode[STIX]{x1D705}_{\mathit{eff}}\unicode[STIX]{x1D6FB}^{2}\bar{q}.\end{eqnarray}$$
In the discussion surrounding (A 6), we determine
 $\unicode[STIX]{x1D705}_{\mathit{eff}}$
using the time-mean eddy energy power integral (A 5b
). According to this diagnosis, the PV diffusivity is
 $$\begin{eqnarray}\unicode[STIX]{x1D705}_{\mathit{eff}}=\unicode[STIX]{x1D707}\overline{\langle |\unicode[STIX]{x1D735}\unicode[STIX]{x1D713}^{\prime }|^{2}\rangle }/\left\langle \bar{\unicode[STIX]{x1D701}}\,\bar{q}\right\rangle .\end{eqnarray}$$
Figure 19(a) shows
 $\unicode[STIX]{x1D705}_{\mathit{eff}}$
in (8.3) for the solution suite with
 $\unicode[STIX]{x1D6FD}_{\ast }=1.38$
.
The eddy saturation regime for
 $\unicode[STIX]{x1D6FD}_{\ast }=1.38$
(shaded). The asterisks indicate numerical solutions of (1.1) and (2.3). The circles show the numerical solutions of (1.1) and (2.3) with the added PV diffusion,
 $\unicode[STIX]{x1D705}_{\mathit{eff}}\unicode[STIX]{x1D6FB}^{2}q$
. The solid curve is the QL prediction (5.4) and the dash-dotted curve is the QL prediction with added PV diffusion.

(a) The effective PV diffusivity,
 $\unicode[STIX]{x1D705}_{\mathit{eff}}$
, diagnosed from (8.3) for the series of solutions with
 $\unicode[STIX]{x1D6FD}_{\ast }=1.38$
. (b) The correlation
 $\text{corr}(\bar{\unicode[STIX]{x1D713}},\unicode[STIX]{x1D702}_{x})$
for this series of solutions (asterisks) and for the solutions with parameterized transient eddies (circles). (c) The same as (b), but showing the strength of the transient eddies using the index (4.4). (c) The same as (b), but showing the energy of the standing eddies
 $\bar{\unicode[STIX]{x1D713}}$
. Also shown are the power laws
 $F_{\ast }^{1}$
and
 $F_{\ast }^{2}$
as dashed black lines.

Abernathey & Cessi (Reference Abernathey and Cessi2014), in their study of baroclinic equilibration in a channel with topography, developed a two-layer QG model that incorporated the role of standing eddies in determining the transport. Abernathey & Cessi (Reference Abernathey and Cessi2014) also used an effective PV diffusion to parameterize transient eddies. However, they specified
 $\unicode[STIX]{x1D705}_{\mathit{eff}}$
, rather than determining it diagnostically from the energy power integral as in (8.3).
With
 $\unicode[STIX]{x1D705}_{\mathit{eff}}$
in hand, we can revisit the QL theory and ask for its prediction when the term
 $\unicode[STIX]{x1D705}_{\mathit{eff}}\unicode[STIX]{x1D6FB}^{2}q$
is added on the right-hand side of (5.1). In this way, we include the effect of the transients on the time-mean flow but do not include the effect of the term
 $\text{J}(\bar{\unicode[STIX]{x1D713}},\bar{q})$
. The QL prediction is only slightly improved – see the dash-dotted curve in figure 18.
To include also the effect of the term
 $\text{J}(\bar{\unicode[STIX]{x1D713}},\bar{q})$
, we obtain solutions of (1.1) and (2.3) with added PV diffusion in (2.3) with
 $\unicode[STIX]{x1D705}_{\mathit{eff}}$
as in figure 19(a). With the added PV diffusion, we find that the strength of the transient eddies is dramatically reduced; see figure 19(c). Thus, the approximation (8.2) with the PV diffusivity supplied by (8.3) is self-consistent in the sense that we do not both resolve and parameterize transient eddies. Moreover, the large-scale flow
 $\bar{U}$
with parameterized transient eddies is in much closer agreement with
 $\bar{U}$
from the solutions with transient eddies – see figure 18. This striking quantitative agreement as we vary
 $F_{\ast }$
shows that at least in the case with
 $\unicode[STIX]{x1D6FD}_{\ast }=1.38$
the transient eddies act as PV diffusion on the time-mean flow.
Thus, we conclude that, in addition to
 $\unicode[STIX]{x1D6FD}$
, the main physical mechanisms operating in the eddy saturation regime are PV diffusion via the transient eddies and the mean advection of mean PV, i.e. the term
 $\text{J}(\bar{\unicode[STIX]{x1D713}},\bar{q})$
.
There are three remarkable aspects of this success. First, it is important to use
 $\unicode[STIX]{x1D705}_{\mathit{eff}}\unicode[STIX]{x1D6FB}^{2}(\bar{\unicode[STIX]{x1D701}}+\unicode[STIX]{x1D702})$
in (8.2); if one uses only
 $\unicode[STIX]{x1D705}_{\mathit{eff}}\unicode[STIX]{x1D6FB}^{2}\bar{\unicode[STIX]{x1D701}}$
, then the agreement in figure 18 is degraded. Second, PV diffusion does not decrease the amplitude of the standing eddies; see figure 19(d). Furthermore, PV diffusion quantitatively captures
 $\text{corr}(\bar{\unicode[STIX]{x1D713}},\unicode[STIX]{x1D702}_{x})$
; see figure 19(b).
Unfortunately, the success of the PV diffusion parameterization does not extend to cases with closed geostrophic contours (small
 $\unicode[STIX]{x1D6FD}_{\ast }$
), such as the case with
 $\unicode[STIX]{x1D6FD}_{\ast }=0.1$
. For small
 $\unicode[STIX]{x1D6FD}_{\ast }$
, the flow is strongly affected by the detailed structure of the topography. The solution described in § 3.4 shows that the flow is channelled into a few streams and thus a parameterization that does account for the actual structure of the topography is, probably, doomed to fail. In fact, for
 $\unicode[STIX]{x1D6FD}_{\ast }=0.1$
, the
 $\unicode[STIX]{x1D705}_{\mathit{eff}}$
diagnosed according to (8.3) is negative because
 $\langle \bar{\unicode[STIX]{x1D701}}\bar{q}\rangle <0$
.
In conclusion, the PV diffusion approximation (8.2) gives good quantitative results provided that the flow does not crucially dependent on the structure of the topography itself, i.e. for large
 $\unicode[STIX]{x1D6FD}_{\ast }$
, so that the geometry is dominated by open geostrophic contours. In the context of baroclinic models, eddy saturation is not captured by standard parameterizations of transient baroclinic eddies (Hallberg & Gnanadesikan Reference Hallberg and Gnanadesikan2001). Only very recently have Mak et al. (Reference Mak, Marshall, Maddison and Bachman2017) proposed a parameterization of baroclinic turbulence that successfully produces baroclinic eddy saturation. Thus, the success of (8.2) in the barotropic context, even though it depends on diagnosis of
 $\unicode[STIX]{x1D705}_{\mathit{eff}}$
via (8.3), is significant.
8.2 Drag crisis
In this section, we provide some further insight into the drag crisis. We argue that the requirement of enstrophy balance among the flow components leads to a transition from the lower to the upper branch as wind-stress forcing increases. We make this argument by constructing lower bounds on the large-scale flow
 $\bar{U}$
based on energy and enstrophy power integrals.
We consider a ‘test streamfunction’ that is efficient at producing form stress,
 $$\begin{eqnarray}\unicode[STIX]{x1D713}^{\mathit{test}}=\unicode[STIX]{x1D6FC}\unicode[STIX]{x1D702}_{x},\end{eqnarray}$$
with
 $\unicode[STIX]{x1D6FC}$
a positive constant to be determined by satisfying either the energy or the enstrophy power integrals from appendix A. A maximum form stress corresponds to a minimum large-scale flow
 $\bar{U}^{\mathit{min}}$
, which in turn can be determined by substituting (8.4) into the time-mean large-scale flow equation (5.2):
 $$\begin{eqnarray}\unicode[STIX]{x1D707}\bar{U}^{\mathit{min}}=F-\unicode[STIX]{x1D6FC}\langle \unicode[STIX]{x1D702}_{x}^{2}\rangle .\end{eqnarray}$$
We can determine
 $\unicode[STIX]{x1D6FC}$
so that the eddy energy power integral, that is the sum of (A 5a
) and (A 5b
) is satisfied:
 $$\begin{eqnarray}0=\bar{U}^{\mathit{min}}\,\unicode[STIX]{x1D6FC}\langle \unicode[STIX]{x1D702}_{x}^{2}\rangle -\unicode[STIX]{x1D707}\unicode[STIX]{x1D6FC}^{2}\langle |\unicode[STIX]{x1D735}\unicode[STIX]{x1D702}_{x}|^{2}\rangle -\unicode[STIX]{x1D708}\unicode[STIX]{x1D6FC}^{2}\langle (\unicode[STIX]{x1D6FB}^{2}\unicode[STIX]{x1D702}_{x})^{2}\rangle .\end{eqnarray}$$
The averages above are evaluated using properties of monoscale topography, e.g.
 $\langle (\unicode[STIX]{x1D6FB}^{2}\unicode[STIX]{x1D702}_{x})^{2}\rangle =\unicode[STIX]{x1D702}_{\mathit{rms}}^{2}\ell _{\unicode[STIX]{x1D702}}^{-6}/2$
. Solving (8.5) and (8.6) for
 $\unicode[STIX]{x1D6FC}$
and
 $\bar{U}^{\mathit{min}}$
, we obtain a lower bound on the large-scale flow based on the energy constraint,
 $$\begin{eqnarray}\bar{U}\geqslant \bar{U}_{E}^{\mathit{min}}\stackrel{\text{def}}{=}\frac{F}{\unicode[STIX]{x1D707}}\left[1+\frac{\unicode[STIX]{x1D702}_{\mathit{rms}}^{2}}{2(\unicode[STIX]{x1D707}+\unicode[STIX]{x1D708}/\ell _{\unicode[STIX]{x1D702}}^{2})^{2}}\right]^{-1}.\end{eqnarray}$$
Alternatively, one can determine
 $\unicode[STIX]{x1D6FC}$
and
 $\bar{U}^{\mathit{min}}$
by satisfying the eddy enstrophy power integral; the sum of (A 8a
) and (A 8b
). This leads to a second bound,
 $$\begin{eqnarray}\bar{U}\geqslant \bar{U}_{Q}^{\mathit{min}}\stackrel{\text{def}}{=}\frac{F}{\unicode[STIX]{x1D707}}\left[1-\frac{\unicode[STIX]{x1D6FD}\unicode[STIX]{x1D702}_{\mathit{rms}}^{2}\ell _{\unicode[STIX]{x1D702}}^{2}}{2(\unicode[STIX]{x1D707}+\unicode[STIX]{x1D708}/\ell _{\unicode[STIX]{x1D702}}^{2})F}\right].\end{eqnarray}$$
Thus,
 $$\begin{eqnarray}U\geqslant \max (\bar{U}_{E}^{\mathit{min}},\bar{U}_{Q}^{\mathit{min}}).\end{eqnarray}$$
The test function in (8.4) does not closely resemble the realized flow, so the bound above is not tight. Nonetheless, it does capture some qualitative properties of the turbulent solutions.
(Using a more elaborate test function with two parameters, one can satisfy both the energy and the enstrophy power integrals simultaneously and obtain a single bound. However, the calculation is much longer and the result is not much better than the relatively simple (8.9).)
The lower bound (8.9) is shown in figure 20 for the case with
 $\unicode[STIX]{x1D6FD}_{\ast }=1.38$
together with the numerical solution of the full nonlinear equations (1.1) and (2.3) and the QL prediction. Although it cannot be clearly seen, the energy bound
 $\bar{U}_{E}^{\mathit{min}}$
does not allow
 $\bar{U}$
to vanish completely, e.g. for
 $\unicode[STIX]{x1D707}_{\ast }=10^{-2}$
we have that
 $\unicode[STIX]{x1D707}\bar{U}_{E}^{\mathit{min}}/F=2\times 10^{-4}$
. On the other hand, the dominance of the enstrophy bound
 $\bar{U}_{Q}^{\mathit{min}}$
at high forcing values explains the occurrence of the drag crisis: the enstrophy power integral requires that the large-scale flow transitions from the lower to the upper branch as
 $F_{\ast }$
is increased beyond a certain value.

The bounds (8.7) and (8.8) provide a qualitative explanation for the existence of the drag crisis. However, the critical forcing predicted by the enstrophy bound dominance overestimates the actual value of the drag crisis. For example, for the case with
 $\unicode[STIX]{x1D6FD}_{\ast }=1.38$
shown in figure 20,
 $\bar{U}_{Q}^{\mathit{min}}$
becomes the lower bound at a value of
 $F_{\ast }$
that is approximately 240 times larger than the actual drag-crisis point. We have no reason to expect these bounds to be tight: they do not depend on the actual structure of the topography itself but only on gross statistical properties, e.g.
 $\unicode[STIX]{x1D702}_{\mathit{rms}}$
,
 $\ell _{\unicode[STIX]{x1D702}}$
,
 $L_{\unicode[STIX]{x1D702}}$
. For example, a sinusoidal topography
 $$\begin{eqnarray}\unicode[STIX]{x1D702}=\sqrt{2}\unicode[STIX]{x1D702}_{\mathit{rms}}\cos (x/\ell _{\unicode[STIX]{x1D702}})\end{eqnarray}$$
has identical statistical properties to the random monoscale topography used in this paper and, therefore, imposes the same bounds. However, with the topography in (8.10), there is a laminar solution with
 $\unicode[STIX]{x1D713}_{y}=0$
and, as a result, also
 $\text{J}(\unicode[STIX]{x1D713},q)=0$
. In this case, the QL solution (5.3) is an exact solution of the full nonlinear equations (1.1) and (2.3) and the bound (8.9) is tight.
9 Discussion and conclusion
The main new results in this work are illustrated by the two limiting cases described in §§ 3.4 and 3.5. The case in § 3.4, with
 $\unicode[STIX]{x1D6FD}_{\ast }=0.1$
, is realistic in that ballpark estimates indicate that topographic PV will overpower
 $\unicode[STIX]{x1D6FD}y$
to produce closed geostrophic contours almost everywhere. The topographically blocked flow then consists of close-packed stagnant ‘dead zones’ separated by narrow jets. Dead zones are particularly notable in the steady solution shown in figure 15. However, they are also clear in the unsteady solution of figure 5. There is no eddy saturation in this topographically blocked regime: the large-scale flow
 $\bar{U}$
increases roughly linearly with
 $F$
until the drag-crisis jump to the upper branch. Because of the topographic partitioning into dead zones, the large-scale time-mean flow
 $\bar{U}$
is an unoccupied mean: in most of the domain there are weak recirculating eddies.
The complementary limit, illustrated by the case in § 3.5 with
 $\unicode[STIX]{x1D6FD}_{\ast }=1.38$
, is when all of the geostrophic contours are open. In this limit, we find that (i) the large-scale flow
 $\bar{U}$
is insensitive to changes in
 $F$
and (ii) the kinetic energy of the transient eddies increases linearly with
 $F$
; see figure 19(d). Both (i) and (ii) are defining symptoms of the eddy saturation phenomenon documented in eddy-resolving Southern Ocean models. Constantinou (Reference Constantinou2017) identified a third symptom common to both barotropic and baroclinic eddy saturation: increasing the Ekman drag coefficient
 $\unicode[STIX]{x1D707}$
increases the large-scale mean flow (Hogg & Blundell Reference Hogg and Blundell2006; Nadeau & Straub Reference Nadeau and Straub2012; Nadeau & Ferrari Reference Nadeau and Ferrari2015; Marshall et al.
Reference Marshall, Abhaum, Maddison, Munday and Novak2016). This somewhat counterintuitive dependence on
 $\unicode[STIX]{x1D707}$
can be rationalized by arguing that the main effect of increasing the Ekman drag is to damp the transient eddies responsible for producing
 $\unicode[STIX]{x1D705}_{\mathit{eff}}$
in (8.3). Section 8 shows that decreasing the strength of the transient eddies, and their associated effective PV diffusivity, also decreases the topographic form stress and thus increases the transport.
The two limiting cases described above are not quirks of the monoscale topography in figure 2. Using a multiscale topography with a
 $k^{-2}$
power spectral density, we find similar qualitative behaviours (not shown here), including eddy saturation in the limit of § 3.5. Moreover, the main controlling factor for eddy saturation in this barotropic model is whether the geostrophic contours are open or closed – the numerical value of
 $\unicode[STIX]{x1D6FD}_{\ast }$
is important only in so far as
 $\unicode[STIX]{x1D6FD}_{\ast }$
determines whether the geostrophic contours are open or closed. For example, the ‘unidirectional’ topography in (8.10) always has open geostrophic contours. Using this sinusoidal topography, Constantinou (Reference Constantinou2017) showed that there is barotropic eddy saturation with
 $\unicode[STIX]{x1D6FD}_{\ast }$
as low as 0.1. Thus, Constantinou (Reference Constantinou2017) demonstrated that it is the structure of the geostrophic contours, rather than the numerical value of
 $\unicode[STIX]{x1D6FD}_{\ast }$
, that is decisive as far as barotropic eddy saturation is concerned.
The explanation of baroclinic eddy saturation, starting with Straub (Reference Straub1993), is that the isopycnal slope has a hard upper limit set by the marginal condition for baroclinic instability. As the strength of the wind is increased from small values, the isopycnal slope initially increases and so does the associated ‘thermal-wind transport’. (The thermal-wind transport is diagnosed from the density field by integrating the thermal-wind relation upwards from a level of no motion at the bottom.) However, once the isopycnal slope reaches the marginal condition for baroclinic instability, further increases in slope, and in thermal-wind transport, are no longer possible. At the margin of baroclinic instability, the unstable flow can easily make more eddies to counteract further wind-driven steepening of the isopycnal slope. This is the standard explanation of baroclinic eddy saturation in which the transport (approximated by the thermal-wind transport) is unchanging, while the strength of the transient eddies increases linearly with wind stress.
Direct comparison of the barotropic model with baroclinic Southern Ocean models, and with the Southern Ocean itself, is difficult and probably not worthwhile except for gross parameter estimation as in table 2. However, several qualitative points should be mentioned. Most strikingly, we find that eddy saturation occurs without baroclinic instability and without thermal-wind transport. This finding shows that baroclinic instability is not necessary for eddy saturation – as generally assumed in existing theories – but the relationship between eddy saturation in the barotropic model studied here and eddy saturation in baroclinic Southern Ocean models is unclear. Nonetheless, the onset of transient barotropic eddies, shown in figure 10(b), is also the onset of barotropic eddy saturation. This barotropic-topographic instability is the source of the transient eddies that produce
 $\unicode[STIX]{x1D705}_{\mathit{eff}}$
in (8.3). Thus, in common with the baroclinic mechanism of Straub (Reference Straub1993), one can speculate that barotropic eddy saturation also involves a flow remaining close to a marginal stability condition. Substantiation of this claim, and clarification of the connection between barotropic and baroclinic eddy saturation, require better characterization the barotropic-topographic instability and also of the effect of small-scale topography on baroclinic instability. The latter point is fundamental: in a baroclinic flow, topographically blocked geostrophic contours in the deep layers coexist with open contours in shallower layers. The marginal condition for baroclinic instability in this circumstance is not well understood. The issue is further confused because (i) transient eddies generated by barotropic-topographic instability have, initially, the same length scale as the topography, which can be close to the deformation length scale of baroclinic eddies, and (ii) eddies generated by baroclinic instability tend to barotropize and thus also project on the barotropic manifold. The model studied here shows that the topographic form stress, produced by
 $\unicode[STIX]{x1D6FD}$
-plane geostrophic turbulence, perhaps close to the marginal stability condition of a topographic-barotropic instability, exerts an active control on transport.
Acknowledgements
The authors acknowledge fruitful discussions with N. A. Bakas, P. Cessi, T. D. Drivas, B. F. Farrell, G. R. Flierl, A. McC. Hogg, P. J. Ioannou and A. F. Thompson. Comments from three anonymous reviewers greatly improved the paper. N.C.C. was supported by the NOAA Climate and Global Change Postdoctoral Fellowship Program, administered by UCAR’s Cooperative Programs for the Advancement of Earth System Sciences. W.R.Y. was supported by the National Science Foundation under OCE-1357047. The Matlab code used in this paper is available at the github repository: https://github.com/navidcy/QG_ACC_1layer.
Supplementary movies
Supplementary movies are available at https://doi.org/10.1017/jfm.2017.482.
Appendix A. Energy and enstrophy power integrals and balances
In this appendix, we derive energy and enstrophy power integrals as well as the time-averaged energy and enstrophy balances for
 $\bar{U}$
,
 $U^{\prime }$
,
 $\bar{\unicode[STIX]{x1D713}}$
and
 $\unicode[STIX]{x1D713}^{\prime }$
.
The energy and enstrophy of the flow are defined in (2.5). From (1.1) and (2.3), we find
 $$\begin{eqnarray}\displaystyle \frac{\text{d}E}{\text{d}t} & = & \displaystyle FU-\unicode[STIX]{x1D707}U^{2}-\left\langle \unicode[STIX]{x1D707}|\unicode[STIX]{x1D735}\unicode[STIX]{x1D713}|^{2}+\unicode[STIX]{x1D708}\unicode[STIX]{x1D701}^{2}\right\rangle ,\end{eqnarray}$$
 $$\begin{eqnarray}\displaystyle \frac{\text{d}Q}{\text{d}t} & = & \displaystyle F\unicode[STIX]{x1D6FD}-\left\langle \unicode[STIX]{x1D702}\text{D}\unicode[STIX]{x1D701}\right\rangle -\unicode[STIX]{x1D707}\unicode[STIX]{x1D6FD}U-\left\langle \unicode[STIX]{x1D707}\unicode[STIX]{x1D701}^{2}+\unicode[STIX]{x1D708}|\unicode[STIX]{x1D735}\unicode[STIX]{x1D701}|^{2}\right\rangle .\end{eqnarray}$$
 $FU$
, appears on the right-hand side of (A 1a
); because
 $F$
is constant, the energy injection varies directly with the large-scale mean flow
 $U(t)$
. On the other hand, the main enstrophy injection rate on the right-hand side of (A 1b
) is fixed and equal to
 $F\unicode[STIX]{x1D6FD}$
. The subsidiary enstrophy source
 $\langle \unicode[STIX]{x1D702}\text{D}\unicode[STIX]{x1D701}\rangle$
becomes important if
 $\unicode[STIX]{x1D6FD}$
is small relative to the gradients of the topographic PV; in the special case
 $\unicode[STIX]{x1D6FD}=0$
,
 $\langle \unicode[STIX]{x1D702}\text{D}\unicode[STIX]{x1D701}\rangle$
is the only enstrophy source.
Following (2.6), we represent all flow fields as a time mean plus a transient; it should be noted that
 $\bar{q}=\bar{\unicode[STIX]{x1D701}}+\unicode[STIX]{x1D702}$
and
 $q^{\prime }=\unicode[STIX]{x1D701}^{\prime }$
. Equations (1.1) and (2.3) decompose into
 $$\begin{eqnarray}\displaystyle & \text{J}(\bar{\unicode[STIX]{x1D713}}-\bar{U}y,\bar{q}+\unicode[STIX]{x1D6FD}y)+\unicode[STIX]{x1D735}\boldsymbol{\cdot }\boldsymbol{E}+\text{D}\bar{\unicode[STIX]{x1D701}}=0, & \displaystyle\end{eqnarray}$$
 $$\begin{eqnarray}\displaystyle & q_{t}^{\prime }+\text{J}(\unicode[STIX]{x1D713}^{\prime }-U^{\prime }y,\bar{q}+\unicode[STIX]{x1D6FD}y)+\text{J}(\bar{\unicode[STIX]{x1D713}}-\bar{U}y,q^{\prime })+\unicode[STIX]{x1D735}\boldsymbol{\cdot }(\boldsymbol{E}^{\prime \prime }-\boldsymbol{E})+\text{D}\unicode[STIX]{x1D701}^{\prime }=0, & \displaystyle\end{eqnarray}$$
 $$\begin{eqnarray}\displaystyle & F-\unicode[STIX]{x1D707}\bar{U}-\langle \bar{\unicode[STIX]{x1D713}}\unicode[STIX]{x1D702}_{x}\rangle =0, & \displaystyle\end{eqnarray}$$
 $$\begin{eqnarray}\displaystyle & U_{t}^{\prime }=-\unicode[STIX]{x1D707}U^{\prime }-\langle \unicode[STIX]{x1D713}^{\prime }\unicode[STIX]{x1D702}_{x}\rangle , & \displaystyle\end{eqnarray}$$
 $\boldsymbol{E}^{\prime \prime }\stackrel{\text{def}}{=}\boldsymbol{U}^{\prime }q^{\prime }$
and
 $\boldsymbol{E}\stackrel{\text{def}}{=}~\overline{\boldsymbol{U}^{\prime }q^{\prime }}$
.
A.1 Energy and enstrophy balances
Following the definitions in (2.5), the energy of each flow component is
 $$\begin{eqnarray}E_{\bar{U}}=\bar{U}^{2}/2,\quad E_{U^{\prime }}={U^{\prime }}^{2}/2,\quad E_{\bar{\unicode[STIX]{x1D713}}}=\langle |\unicode[STIX]{x1D735}\bar{\unicode[STIX]{x1D713}}|^{2}\rangle /2\quad \text{and}\quad E_{\unicode[STIX]{x1D713}^{\prime }}=\langle |\unicode[STIX]{x1D735}\unicode[STIX]{x1D713}^{\prime }|^{2}\rangle /2.\end{eqnarray}$$
Thus, the total energies of the large-scale flow and the eddies are
 $$\begin{eqnarray}E_{U}=E_{\bar{U}}+E_{U^{\prime }}+\bar{U}\,U^{\prime }\quad \text{and}\quad E_{\unicode[STIX]{x1D713}}=E_{\bar{\unicode[STIX]{x1D713}}}+E_{\unicode[STIX]{x1D713}^{\prime }}+\langle \unicode[STIX]{x1D735}\bar{\unicode[STIX]{x1D713}}\boldsymbol{\cdot }\unicode[STIX]{x1D735}\unicode[STIX]{x1D713}^{\prime }\rangle .\end{eqnarray}$$
The cross-terms above are removed by time averaging.
The energy and enstrophy transfers between the four flow components: the time-mean large-scale flow
 $\bar{U}$
, the standing eddies
 $\bar{\unicode[STIX]{x1D713}}$
, and the corresponding transient components
 $U^{\prime }$
and
 $\unicode[STIX]{x1D713}^{\prime }$
.

The time-mean energy balances for each flow component are obtained by manipulations of (A 2) as follows:
 $$\begin{eqnarray}\displaystyle E_{\bar{\unicode[STIX]{x1D713}}}\hspace{-4.0pt} & : & \displaystyle \quad \langle -\bar{\unicode[STIX]{x1D713}}\times (\text{A}\,2a)\rangle \hspace{-0.1pt}\quad \Rightarrow \quad 0=\bar{U}\langle \bar{\unicode[STIX]{x1D713}}\unicode[STIX]{x1D702}_{x}\rangle +\langle \bar{\unicode[STIX]{x1D713}}\unicode[STIX]{x1D735}\boldsymbol{\cdot }\boldsymbol{E}\rangle +\langle \bar{\unicode[STIX]{x1D713}}\text{D}\bar{\unicode[STIX]{x1D701}}\rangle ,\end{eqnarray}$$
 $$\begin{eqnarray}\displaystyle \overline{E_{\unicode[STIX]{x1D713}^{\prime }}}\hspace{-4.0pt} & : & \displaystyle \quad \overline{\langle -\unicode[STIX]{x1D713}^{\prime }\times (\text{A}\,2b)\rangle }\hspace{-2.5pt}\quad \Rightarrow \quad 0=\overline{U^{\prime }\langle \unicode[STIX]{x1D713}^{\prime }\unicode[STIX]{x1D702}_{x}\rangle }-\langle \bar{\unicode[STIX]{x1D713}}\unicode[STIX]{x1D735}\boldsymbol{\cdot }\boldsymbol{E}\rangle +\overline{\langle \unicode[STIX]{x1D713}^{\prime }\text{D}\unicode[STIX]{x1D701}^{\prime }\rangle },\end{eqnarray}$$
 $$\begin{eqnarray}\displaystyle E_{\bar{U}}\hspace{-4.0pt} & : & \displaystyle \quad \bar{U}\times (\text{A}\,2c)\hspace{6.3pt}\quad \quad \Rightarrow \quad 0=F\bar{U}-\unicode[STIX]{x1D707}\bar{U}^{2}-\bar{U}\langle \bar{\unicode[STIX]{x1D713}}\unicode[STIX]{x1D702}_{x}\rangle ,\end{eqnarray}$$
 $$\begin{eqnarray}\displaystyle \overline{E_{U^{\prime }}}\hspace{-4.0pt} & : & \displaystyle \quad \overline{U^{\prime }\times (\text{A}\,2d)}\hspace{3.0pt}\quad \quad \Rightarrow \quad 0=-\unicode[STIX]{x1D707}\overline{{U^{\prime }}^{2}}-\overline{U^{\prime }\langle \unicode[STIX]{x1D713}^{\prime }\unicode[STIX]{x1D702}_{x}\rangle }.\end{eqnarray}$$
 $\langle \bar{\unicode[STIX]{x1D713}}\unicode[STIX]{x1D735}\boldsymbol{\cdot }\boldsymbol{E}\rangle$
cancels and we obtain the energy power integral (2.7) for the total (standing plus transient) eddy field.
The time mean of the energy integral in (A 1a
) is the sum of equations (A 5). It should be noted that from (A 5d
) we have that
 $\overline{U^{\prime }\langle \unicode[STIX]{x1D713}^{\prime }\unicode[STIX]{x1D702}_{x}\rangle }<0$
, and thus from (A 5b
) we infer that
 $\langle \bar{\unicode[STIX]{x1D713}}\unicode[STIX]{x1D735}\boldsymbol{\cdot }\boldsymbol{E}\rangle <0$
. The energy balances (A 5) are summarized in figure 21(a).
In § 8, we approximate
 $\unicode[STIX]{x1D735}\boldsymbol{\cdot }\boldsymbol{E}$
as PV diffusion (8.2). The effective PV diffusivity
 $\unicode[STIX]{x1D705}_{\mathit{eff}}$
can be diagnosed by requiring that the time-mean eddy energy balance (A 5a
) and the transient-eddy flow energy balance (A 5b
) are satisfied. According to these requirements,
 $$\begin{eqnarray}\displaystyle \unicode[STIX]{x1D705}_{\mathit{eff}} & = & \displaystyle \left(\bar{U}\langle \bar{\unicode[STIX]{x1D713}}\unicode[STIX]{x1D702}_{x}\rangle +\langle \bar{\unicode[STIX]{x1D713}}\text{D}\bar{\unicode[STIX]{x1D701}}\rangle \right)/\left\langle \bar{\unicode[STIX]{x1D701}}\,\bar{q}\right\rangle\end{eqnarray}$$
 $$\begin{eqnarray}\displaystyle & = & \displaystyle -(\overline{\langle \unicode[STIX]{x1D713}^{\prime }\text{D}\unicode[STIX]{x1D701}^{\prime }\rangle }+\overline{U^{\prime }\langle \unicode[STIX]{x1D713}^{\prime }\unicode[STIX]{x1D702}_{x}\rangle })/\left\langle \bar{\unicode[STIX]{x1D701}}\,\bar{q}\right\rangle .\end{eqnarray}$$
 $\bar{U}\langle \bar{\unicode[STIX]{x1D713}}\unicode[STIX]{x1D702}_{x}\rangle$
and
 $\langle \bar{\unicode[STIX]{x1D713}}\text{D}\bar{\unicode[STIX]{x1D701}}\rangle$
are of opposite sign; the magnitude of the former is generally much larger than that of the latter. In (A 6b
), the term
 $\overline{U^{\prime }\langle \unicode[STIX]{x1D713}^{\prime }\unicode[STIX]{x1D702}_{x}\rangle }$
is negligible compared with
 $\overline{\langle \unicode[STIX]{x1D713}^{\prime }\text{D}\unicode[STIX]{x1D701}^{\prime }\rangle }$
. Neglecting the small term
 $\overline{U^{\prime }\langle \unicode[STIX]{x1D713}^{\prime }\unicode[STIX]{x1D702}_{x}\rangle }$
, and using
 $\text{D}\unicode[STIX]{x1D701}^{\prime }=\unicode[STIX]{x1D707}\unicode[STIX]{x1D701}^{\prime }$
, we simplify (A 6b
) to obtain the expression for
 $\unicode[STIX]{x1D705}_{\mathit{eff}}$
in (8.3).
The enstrophy of each flow component is
 $$\begin{eqnarray}Q_{\bar{U}}=\unicode[STIX]{x1D6FD}\bar{U},\quad Q_{U^{\prime }}=\unicode[STIX]{x1D6FD}U^{\prime },\quad Q_{\bar{\unicode[STIX]{x1D713}}}=\langle \bar{q}^{2}\rangle /2\quad \text{and}\quad Q_{\unicode[STIX]{x1D713}^{\prime }}=\langle {q^{\prime }}^{2}\rangle /2.\end{eqnarray}$$
The transient large-scale flow has, by definition,
 $\overline{Q_{U^{\prime }}}=0$
. The enstrophy power integrals follow by manipulations similar to those in (A 5):
 $$\begin{eqnarray}\displaystyle Q_{\bar{\unicode[STIX]{x1D713}}}\hspace{-4.0pt} & : & \displaystyle \quad \langle \bar{q}\times (\text{A}\,2a)\rangle \quad \Rightarrow \quad 0=\unicode[STIX]{x1D6FD}\langle \bar{\unicode[STIX]{x1D713}}\unicode[STIX]{x1D702}_{x}\rangle -\langle \bar{q}\,\unicode[STIX]{x1D735}\boldsymbol{\cdot }\boldsymbol{E}\rangle -\langle \bar{\unicode[STIX]{x1D701}}\text{D}\bar{\unicode[STIX]{x1D701}}\rangle -\langle \unicode[STIX]{x1D702}\text{D}\bar{\unicode[STIX]{x1D701}}\rangle ,\end{eqnarray}$$
 $$\begin{eqnarray}\displaystyle \overline{Q_{\unicode[STIX]{x1D713}^{\prime }}}\hspace{-4.0pt} & : & \displaystyle \quad \overline{\langle q^{\prime }\times (\text{A}\,2b)\rangle }\quad \hspace{-2.1pt}\Rightarrow \quad 0=\left\langle \bar{q}\,\unicode[STIX]{x1D735}\boldsymbol{\cdot }\boldsymbol{E}\right\rangle -\overline{\left\langle \unicode[STIX]{x1D701}^{\prime }\text{D}\unicode[STIX]{x1D701}^{\prime }\right\rangle },\end{eqnarray}$$
 $$\begin{eqnarray}\displaystyle Q_{\bar{U}}\hspace{-4.0pt} & : & \displaystyle \quad \unicode[STIX]{x1D6FD}\times (\text{A}\,2c)\quad \quad \hspace{-3.55pt}\Rightarrow \quad 0=F\unicode[STIX]{x1D6FD}-\unicode[STIX]{x1D707}\unicode[STIX]{x1D6FD}\bar{U}-\unicode[STIX]{x1D6FD}\langle \bar{\unicode[STIX]{x1D713}}\unicode[STIX]{x1D702}_{x}\rangle .\end{eqnarray}$$
 $\langle \bar{q}\,\unicode[STIX]{x1D735}\boldsymbol{\cdot }\boldsymbol{E}\rangle >0$
; the term
 $\langle \unicode[STIX]{x1D702}\text{D}\bar{\unicode[STIX]{x1D701}}\rangle$
in (A 8a
) can have either sign. The enstrophy power integrals (A 8) are summarized in figure 21(b).
Appendix B. Form stress for isotropic topography
For the case of isotropic topography, analytic progress follows the QL expression for the form stress by converting the sum over
 $\boldsymbol{k}$
in (5.4) into an integral,
 $$\begin{eqnarray}\langle \unicode[STIX]{x1D713}\unicode[STIX]{x1D702}_{x}\rangle =U\int \frac{\unicode[STIX]{x1D707}k_{x}^{2}|\boldsymbol{k}|^{2}|\hat{\unicode[STIX]{x1D702}}(\boldsymbol{k})|^{2}}{\unicode[STIX]{x1D707}^{2}|\boldsymbol{k}|^{4}+k_{x}^{2}(\unicode[STIX]{x1D6FD}-|\boldsymbol{k}|^{2}U)^{2}}\,\text{d}^{2}\boldsymbol{k},\end{eqnarray}$$
where
 $\hat{\unicode[STIX]{x1D702}}(\boldsymbol{k})\stackrel{\text{def}}{=}\int \unicode[STIX]{x1D702}(\boldsymbol{x})\text{e}^{-\text{i}\boldsymbol{k}\boldsymbol{\cdot }\boldsymbol{x}}\,\text{d}^{2}\boldsymbol{x}$
. Now, we assume that the topography is isotropic, i.e. its power spectral density
 $S(k)$
is only a function of the total wavenumber
 $k=|\boldsymbol{k}|$
, given by
 $S(k)=2\unicode[STIX]{x03C0}k|\hat{\unicode[STIX]{x1D702}}(\boldsymbol{k})|^{2}$
, so that
 $\unicode[STIX]{x1D702}_{\mathit{rms}}^{2}=\int S(k)\,\text{d}k$
. In this case, we further simplify the integral (B 1) using polar coordinates
 $(k_{x},k_{y})=k(\cos \unicode[STIX]{x1D703},\sin \unicode[STIX]{x1D703})$
:
 $$\begin{eqnarray}\langle \unicode[STIX]{x1D713}\unicode[STIX]{x1D702}_{x}\rangle =\frac{U}{2\unicode[STIX]{x03C0}\unicode[STIX]{x1D707}}\int _{0}^{\infty }S(k)\oint \frac{\cos ^{2}\unicode[STIX]{x1D703}}{1+\unicode[STIX]{x1D709}\cos ^{2}\unicode[STIX]{x1D703}}\,\text{d}\unicode[STIX]{x1D703}\,\text{d}k,\end{eqnarray}$$
where
 $\unicode[STIX]{x1D709}\stackrel{\text{def}}{=}(\unicode[STIX]{x1D6FD}-k^{2}U)^{2}/(\unicode[STIX]{x1D707}k)^{2}>0$
. The
 $\unicode[STIX]{x1D703}$
-integral above is evaluated analytically, so that
 $$\begin{eqnarray}\langle \unicode[STIX]{x1D713}\unicode[STIX]{x1D702}_{x}\rangle =\unicode[STIX]{x1D707}U\int _{0}^{\infty }\frac{k^{2}S(k)\,\text{d}k}{\unicode[STIX]{x1D707}^{2}k^{2}+(\unicode[STIX]{x1D6FD}-k^{2}U)^{2}+\unicode[STIX]{x1D707}k\sqrt{\unicode[STIX]{x1D707}^{2}k^{2}+(\unicode[STIX]{x1D6FD}-k^{2}U)^{2}}}.\end{eqnarray}$$
For the special case of idealized monoscale topography,
 $S(k)=\unicode[STIX]{x1D702}_{\mathit{rms}}^{2}\,\unicode[STIX]{x1D6FF}(k-\ell _{\unicode[STIX]{x1D702}}^{-1})$
, the
 $k$
-integral in (B 3) can be evaluated in closed form. In that case, (B 3) reduces to (5.5).