

Series overview: Epistemological diversity in computer simulation
There now exists an informative and burgeoning historical and philosophical literature on computer simulation.Footnote 1 However, there has so far been little comparative analysis of how the differences between the epistemological sensibilities held by different simulation designers have affected the ways in which simulations have been constructed, deployed, and evaluated.
According to the most common view, computer simulations accept input values or parameters that run through a series of pre-determined computational instructions, a “model” approximating the laws or principles governing real systems. Their outputs are typically characterized as sharp values computing – or forecasting – a result in which we are interested, and which would have been extremely difficult, if not impossible, to calculate otherwise. Such models can sometimes be regarded as replacements for expensive or otherwise difficult experiments, and are regularly used, for instance, to predict outcomes in scientific experiments and engineering projects. Even in systems that are more open, that are messier, and that have greater uncertainty at their core – such as in transportation systems or financial securities – simulations are constantly mobilized to provide reasonably robust forecasts, which can then be used to craft plans and policies. In most computational cultures, this sort of practice virtually defines the purpose and value of computer simulations. While such models may be hidden from public view, they are pervasive in the functioning of contemporary society.Footnote 2
In this series, we look at historical simulations that fell outside of the epistemological rubric of forecasting. In Part I, we examine the construction of electrical engineer Jay Forrester's “Industrial Dynamics” simulation method in the late 1950s and early 1960s. In Part II, we turn to simulations performed by several different researchers in the formative years of chaos theory. Eschewing forecasting, both Forrester and the chaos modelers embraced epistemological sensibilities that did not depend on model validation, i.e. confirmation that the models being used reflected the actual functioning of a real-world system. It is not that model fidelity was not important; fidelity served as a guide toward conclusions that could not be confirmed against measured values. Within the bounds of this sensibility, some traditional scientific virtues ceased to carry clear epistemological benefits, notably, the statement of testable claims, the quest for precision, and the minimization of error. In their place, modelers determined the value of their models by their ability to increase familiarity or conceptual understanding of real-world phenomena. Thus, these simulations could be said to have served a more purely heuristic function, akin to the uses of models (digital, physical, or mathematical) analyzed in some recent discussions of the methodology of economic theory.Footnote 3
How a simulation user can claim to have learned by gaining “familiarity” or “conceptual understanding,” but without having validated a model by verifying a forecast, relates closely to the context of simulation use. Here we must treat the idea of context with care, because similarities in epistemological sensibility can easily transcend superficial cultural differences. Forrester was firmly entrenched in postwar American industrial culture: his work was well-funded and sought to augment managerial control over firms. On the other hand, modelers of chaotic phenomena in Santa Cruz, California, were marginal figures who were far more attuned to the American counterculture than mainstream industry, and sought to understand how systems can resist control. Nevertheless, both Forrester and the Santa Cruz group shared striking similarities in epistemology: a commitment to continual model revision or tinkering, and a concern with qualitative and visualizable model behavior rather than measurable output.Footnote 4
However, Forrester's and the chaos modelers’ similar sensibilities did not arise from similar circumstances. Forrester's approach was rooted in his understanding of Industrial Dynamics as a pedagogical tool, which would systematize managers’ understanding of their businesses, and management students’ understanding of general business principles. If managers were able to make reasonably competent decisions based on a fragmented knowledge of their businesses and the markets they served, Forrester believed they could make better decisions by testing new policies in complex simulations, and comparing the behaviors resulting from different model structures produced against their own more intuitive expectations. Thus, Forrester's pedagogical aims and his institutional surroundings in the new MIT School of Industrial Management will be central to Part I. Chaos modelers, on the other hand, had no such aims. Seeking to reproduce the qualitative characteristics of real-world chaotic phenomena in simulations, they valued the ability to manipulate their simulations so as more readily to produce and alter simulation behaviors that were inherently unpredictable. Thus, in Part II of this series, we will turn from the institutions to machines, and examine what sorts of machines chaos modelers found most valuable. Strikingly, cutting-edge work in chaos could thrive in material contexts that were decidedly remote from the computational vanguard. We will draw attention to the ways valuable results could be produced by machines that defied traditional measures of computational utility (such as ability to incorporate greater numbers of variables, and longer and more finely grained timescales), as well as to similarly divergent attitudes toward the desirability of “error” within this new epistemological project.Footnote 5
Introduction to part I: Finding Forrester
This first part in our series deals exclusively with the motivations behind and context surrounding Jay Forrester's “Industrial Dynamics” models. Forrester's modeling work has long been of interest to science studies scholars writing on the relationship between computer models and polity. In the past, perhaps needlessly broad attempts to address the postwar relationship between technology and society, writ large, have focused historians’ attentions on the deployment of complicated command-and-control technologies and on the manageability of increasingly enormous industrial, military, and public works projects and global policy issues. Forrester's career arc has fit into this rubric nicely (Pickering Reference Pickering1995, 13–18; Hughes Reference Hughes1998, esp. 176–185; Elichirigoity Reference Elichirigoity1999; Edwards Reference Edwards, Hughes and Hughes2000).Footnote 6 His work on Industrial Dynamics has been grouped with his work on analog servomechanisms during World War II; with his development of the Whirlwind I digital computer, which became the centerpiece for the U.S. Air Force's Semi-automated Ground Environment (SAGE) radar tracking system;Footnote 7 and with his later expanded application of his computer modeling techniques (accordingly renamed “System Dynamics”) to problems of urban development, and global demographic and economic growth. Indeed, his move from one computer system used to detect and track hostile bombers on a continent-wide scale to another computer designed to model global phenomena provides a fairly clean picture from which to read the scope of scientists’ and engineers’ ambitions in mid-twentieth-century America. It has thus become de rigueur to see Forrester as a technology-infused world controller.Footnote 8
Retreating from this historiographical trend, we would like to get closer to Forrester's day-to-day motivations by concentrating on the development of the relatively modest Industrial Dynamics models. We do so in three stages, concentrating in all three on Industrial Dynamics as a conscious attempt to develop a pedagogy for managers and management students, rather than as a rote application of Forrester's engineering background to managerial problems. First, we examine the search for a novel pedagogy of management at MIT from 1950 to 1955. Prior to Forrester's career turn toward Industrial Dynamics, administrators at MIT struggled to find a way to take advantage of the Institute's expertise in science and technology in the design of a new management curriculum. We will see how that search gravitated away from the up-and-coming fields of operations research (OR) and management science, which styled themselves as forms of scientific consulting; and how in 1956 it alighted on Forrester, who believed that any new pedagogy should be aimed at managers themselves. We then take a closer look at Forrester's seminal Reference Forrester1961 book Industrial Dynamics to see how he expected his models to give managers and students a tool they could use to combine the disparate traditional fields of managerial interest into robust managerial strategies. We conclude by examining how and why Forrester portrayed his digital models as fundamentally different from the mathematical analysis then used by economists, and operations research and management science practitioners to examine related issues in the management of complex systems.
The main advantage in concentrating on this limited timeframe and on Industrial Dynamics’ specifically pedagogical context is that it elucidates the sources of legitimacy in the culture of simulation Forrester aspired to create. Traditionally, it has been supposed that limitations in the ability of Forrester's modeling technique to offer accurate forecasts undermined the authority of his models. Instead, if we see the models in his books as examples of how managers and students might organize and test the validity and consistency of more traditional forms of managerial knowledge they might have, and if we understand that these users were expected to be vested with authority because of their managerial positions (not because they wielded intimidating computer printouts), we can better explain what Paul Edwards has referred to as Forrester's “strikingly cavalier attitude toward empirical information” (Reference Edwards, Hughes and Hughes2000, 238). Further, we will at least begin to understand why Forrester was so enthusiastic about his modeling scheme as a path to better governance. When we are finished analyzing this bracketed-off phase of Forrester's career, we will be able to remove the brackets to offer more pointed assessments of Forrester's later extensions of System Dynamics, and avoid parroting the longstanding and rather superficial critiques of his policy modeling work.
Theology, psychology, and psychoses: Bringing science to management at MIT
On 5 September 1950, General Motors magnate Alfred P. Sloan, Jr. met with Karl Compton, then chairman of the MIT Corporation, to discuss the donation of over five million dollars from the Sloan Foundation toward the establishment of a new school for industrial management at the Institute.Footnote 9 MIT was eager to accept the gift, and its administrators immediately began discussing what sort of new impetus the Institute's traditional strengths in science and engineering could lend the field of management. They envisioned a program designed to offer more scientific and technological awareness to industries that were increasingly leaning toward the production of high-tech goods and using more automation in their own operations. A confidential 30 October memorandum pointed vaguely to the burgeoning field of automatic control as a potential area of development and suggested the possibility of collaboration between MIT's servomechanisms group (of which Jay Forrester had been a member during World War II) and members of the new school.Footnote 10
However, on 20 November (before the public announcement of Sloan's gift), representatives of the National Research Council's (NRC) new Committee on Operations Research (OR) paid a visit to MIT's provost, Julius Stratton.Footnote 11 OR had come into being during World War II when trained scientists were employed to study military tactics and equipment in action. The NRC committee was created to push OR beyond military problems into industry, and to establish it as its own professional field.Footnote 12 The OR advocates received encouraging words from Stratton, and their visit clearly had an effect. A memorandum of 6 December largely replicated the language of the 30 October memo, but a discussion of establishing a program in OR replaced the mention of the servomechanisms group.Footnote 13 At that time OR was still mostly defined only as the close and regular scrutiny of policy rationales by trained scientists, and, as such, seemed to be a plausible cornerstone for an innovative new industrial management program at a science-oriented university.Footnote 14 However, integration of OR and the new school was not foreordained.
In 1951 MIT hired a vice-president from Sears, Roebuck, and Co., Pennell Brooks, to be the first dean of the School of Industrial Management (SIM). Brooks assigned Tom Hill, a professor of accounting, to investigate the new field.Footnote 15 In January 1952, after reading the available literature, consulting with the relevant people at MIT and Arthur D. Little, and attending MIT seminars on the subject, Hill reported back that OR did not seem to have an especially novel perspective on industrial problems. The conduct of “scientific” investigations was not foreign to industrial managers, and, although OR proponents showed a willingness to employ sophisticated mathematical models, the conclusions they reached using these models did not differ radically from those already reached by skilled managers. He felt that the new school should maintain a friendly relationship with OR proponents, but that it ought to chart its own course. And indeed, OR would go on to establish itself successfully at MIT with strong SIM support, but under an interdepartmental committee that was outside its administrative umbrella.Footnote 16
SIM, meanwhile, opened its doors in 1952, but still lacked a unique new approach to the discipline of management. That September a new professor of finance, Eli Shapiro from the University of Chicago, joined SIM. Within a year MIT's “consulting professor” of electrical engineering, Edward Bowles, began to consult with SIM as well.Footnote 17 Although Bowles had no immediate qualifications in management as a field, during the war he had served as an “expert consultant” to the Secretary of War and had the ear of the provost Stratton, who had worked for his office during much of the war.Footnote 18 Bowles had been impressed by wartime OR, but, like Tom Hill, he felt that the term had since become imbued with too much “theology” and that the new profession could not live up to the promises of its most vocal advocates.Footnote 19 He counseled instead, “We must have a man so developed that you can depend upon him directly to build a school of analysis around himself.” He pointed to the possibilities of crossover with engineering, reintroducing possible applications of servomechanism theory to “man-machine systems,” and stressing the potential of automated data-handling using digital computing. He suggested collaboration with professors from the engineering departments, with an eye toward his own specialty of electrical engineering.Footnote 20
By 1954 the situation at SIM was in disarray. Bowles and Shapiro had become close allies and were privately grousing at what they viewed as a lack of intellectual leadership by the dean. Bowles successfully pushed Shapiro to assert his own position with Stratton and MIT president Jim Killian. Shapiro was named assistant dean of SIM in November, and he and Bowles began actively campaigning against a trend under Brooks leading to the promotion of researchers “whose primary interests,” according to Bowles, were “psychology, psychoses and what have you (or what have they).”Footnote 21 By the fall of 1955, Shapiro and Bowles’ attempt to reshape the SIM curriculum according to their wishes received a boost when Shapiro began the process of soliciting additional funds from the Ford Foundation on behalf of SIM with the help of MIT's resident OR advocate, physicist Philip Morse. An increasing number of useful mathematical techniques had already become associated with OR (thereby increasing its notoriety in industrial circles), and Morse was also spearheading efforts to develop a computing center at MIT, which fit neatly with the perceived need for attention to research and education in computing at SIM (Owens Reference Owens1996). Shapiro joined Morse's OR committee, and Morse began communicating with Shapiro in the development of the Ford Foundation grant proposal.Footnote 22
Ultimately of more importance, though, was Shapiro and Bowles’ decision to bring in Jay Forrester, then the driving force behind the MIT Lincoln Laboratory's Whirlwind digital computer project, to write the bulk of the grant proposal. Forrester completed his first draft in October 1955. This draft and later ones, while paying heed to OR and other developments, showcased Forrester's own interests, identifying five especially opportune subject areas: game theory, sampled data control system theory, digital computation, servomechanism theory, and simulation. The last three of these would go on to become central components of Industrial Dynamics.
The new program that Forrester proposed was meant to be something different from the applied mathematics that had become the most visible side of OR and related “management sciences.” He wanted to address the specific concerns of the general managers rather than their staff advisers. While SIM might train a certain number of advisers, he preferred to envision them as coming from “operations research training courses or elsewhere.” Quoting the rising star of managerial thinking Peter Drucker (Reference Drucker1955), Forrester explicitly hoped to develop a line of inquiry surrounding the concerns of general or “line” managers. In other words, the program would train managers who could make appropriate use of scientific advisers, not the advisers themselves.Footnote 23 In his comments on the draft, in addition to Forrester's five areas of research, Morse added a section on operations research, but acknowledged that managers should not be OR specialists, agreeing that the object of the SIM program was to train people who could exploit OR rather than perform it.Footnote 24
Managerial Alchemy: Transforming art into science
In 1956 Shapiro offered Forrester a position at SIM, and, sensing a new opportunity, Forrester joined and was given his first year off to lay the foundations for an industrial management program. During this period, he set about developing the simulation techniques that came to be known as Industrial Dynamics, and, later, System Dynamics. In 1958 he produced an article on Industrial Dynamics for the Harvard Business Review (Forrester Reference Forrester1958), and published his touchstone work, Industrial Dynamics, in 1961, wherein he laid out the technique and pedagogical philosophy behind the dynamic modeling program that would dominate the remainder of his career.Footnote 25 It was intended to provide a firm conceptual grounding for management students as well as a means of continued learning for actual managers within the context of their specific businesses (Forrester Reference Forrester1961, vii).
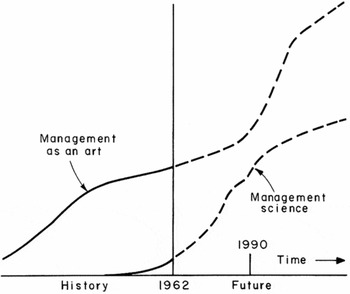
Forrester began the main text of Industrial Dynamics with a discussion of his perception of the relationship between “art” and “science.” In his opinion, industrial management was, at the dawn of the 1960s, a fairly well-developed art, comprised of a series of specialties with separate notions of what constituted sound business practice. Through acquired wisdom business managers could learn about labor contracts, advertising, and production control as individual fields of inquiry. According to Forrester, this knowledge was then typically amalgamated into practice through the use of case studies (the preferred pedagogical method of the nearby Harvard Business School). Forrester was dissatisfied with this approach, and argued that “science” was needed to consolidate haphazard knowledge acquired through art into higher theories and principles, much as he felt engineering practices had been given common ground in the framework of physics earlier in the century (ibid., 1–9).Footnote 26 Once the practical art of management was properly grounded in science, it could then proceed to grow once again through more artisinal means (see fig. 1).
Forrester's illustration of the progress of managerial art bolstered by “management science.” (Forrester Reference Forrester1961, 2, Figure I-1). ©1961, Pegasus Communications <www.pegasuscom.com>

As a response to this need, Forrester did not present Industrial Dynamics as a science in and of itself. Rather, it was supposed to serve as a conceptual foundation or an analytic language on which new knowledge might be built, altered, and adapted to suit particular managerial needs. It was based on the representation of a business as a series of flows of people, money, capital, goods, and information between reservoirs that were regulated by policies (represented as differential equations governing the rate or change of flow that took locally observed levels as an input), and that were crucially influenced by delayed reactions. All of these flows, policies, and delays were linked together, like a servomechanism, in a tangled mass of feedback loops. Reservoir levels at any given point in time could be computed by integrating the flows at time-step intervals on a digital computer given a set of initial conditions. The analogy to engineering is obvious enough, but, taken from a different perspective, Forrester's program simply boiled down to an injunction to follow people, money, and so forth, as they could be expected to move through an organization.Footnote 27
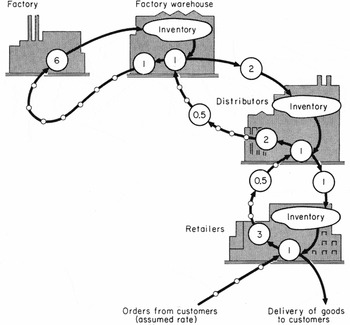
In his initial Harvard Business Review article, and later in the opening chapters of Industrial Dynamics, Forrester used the problem of inventory and production control to demonstrate the power of his simulations. Forrester posited a simple inventory-production chain composed of a retailer, a distributor, a factory warehouse, and a factory (ibid., chap. 2; Forrester Reference Forrester1958, 42–45) (see fig. 2). This model also included the time it took for a factory to increase or decrease production and to move goods between locations, as well as the time to send orders to suppliers (keeping in mind that it is only economical to order and deliver goods in batches). Forrester then posited a sudden 10 per cent increase in demand.
Forrester's simple production and inventory model. The dotted lines represent orders; solid lines represent movement of goods; and the numbers represent delays, measured in weeks. For instance, the 6 at the factory represents the six weeks needed to change production levels. The 2 above the distributors represents the shipping time from the warehouse. The 0.5 represents the transmission time of the order. (Forrester Reference Forrester1961, 22, Figure 2-1). ©1961, Pegasus Communications <www.pegasuscom.com>

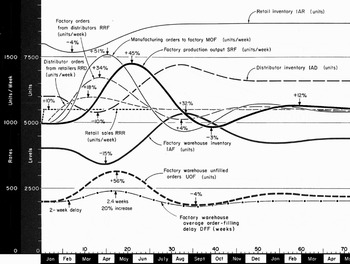
Readers of Forrester's book could trace the downstream effects of this increase on the inventory-production system (see fig. 3). In ordering from the warehouse, the retailer would have to adjust not only for the 10 per cent increase, but also for the depletion of inventory it had already experienced before it sent the order. The distributor would then perceive a greater than 10 per cent increase in demand, and that already amplified demand would be amplified again and passed on to the factory warehouse and, again, to factory production levels. Meanwhile, because of the delay in deliveries from the warehouse, the retailer would have to order still more in subsequent periods until its inventory was replenished, when, of course, its orders would decrease to the increased 10 per cent level, and the warehouses and the factory would be left at excess capacity and would have to cut back their production or orders sharply, even below their original levels. In this scenario there is no need for precision, because qualitatively the amplification phenomenon would still exist for 5 per cent or 20 per cent increases in demand, or if delays in processing and fulfilling orders were shortened or lengthened. The point was not to evaluate exactly how quickly or by how much the factory would overshoot necessary production. It was only to understand how the stated structure and policies governing such an inventory-production chain would give rise to such a phenomenon.
A detail of the simplest computer output Forrester used to demonstrate the ability of Industrial Dynamics to represent the complex phenomena resulting from time delays. Here a 10 per cent increase in consumer demand causes major disturbances in inventory and production systems. (Forrester Reference Forrester1961, 24, Figure 2-2). ©1961, Pegasus Communications <www.pegasuscom.com>

One might automatically be inclined to object to the simplicity of this model. It is natural to suggest that in any sensible company the factory and the warehouse should be alerted to the fact that consumer demand from retailers had only increased by 10 per cent rather than wait for misleading information to be passed through the system in the form of orders. Alternatively, in situations less amenable to direct communication of observations and intentions, one might implement less impulsive inventory replenishment policies by allowing warehouse or factory inventories to absorb the increase until the long-term trend was discernable. The prompting of such objections was at the very core of the model-building process. Assuming that the company was so sensible, the model builder would, of course, be obligated to alter the equations in the model governing product and order flows to reflect better the way the sensible system worked, and then, if satisfied, test how that system would react to other phenomena, such as random fluctuations of demand on the order of 10 per cent, or demand that changes by season, or how the factory adjusts in light of the fact that it takes time to hire and train additional workers to increase capacity more than 10 per cent.
In Industrial Dynamics, model builders were not expected simply to take simulation results at face value, but to meditate on them and interrogate them to discover what attributes of the model made it behave the way that it did. The process was necessarily iterative: intermediate models had to be studied and tested for plausibility before one could move on to scenarios wherein one would be less familiar with expected results. Such intermediate models, Forrester noted, should be tested not only for their behavior in the face of slight changes, but also for their robustness under relatively extreme conditions to test certain boundaries that might not come into play in less strenuous scenarios (Forrester Reference Forrester1961, 59 and 119–120). For instance, if a sudden and substantial, even unrealistic, increase in factory orders caused the factory to approach its production limit, one might suddenly realize it was important to include that limit in the model as well as associated difficulties of running a factory at full capacity.
Once model builders were confident that they had converged upon a sufficiently faithful representation of business structure and decision-making processes, they then set out to alter the model to understand the impacts different kinds of changes in structures and policies would have on system behavior. As with model building, model interpretation was an art that conformed to no “objective” standards. Rather, one might evaluate how stable a model seemed to be under various conditions, and, if there were instabilities, to probe the model's functioning to understand why it produced that effect and to consider various methods of eliminating the instability effectively. The crucial point to keep in mind is that, despite insisting on a maximally faithful representation of a system and its behaviors, given the inherent unpredictability in any individual case arising from nonlinear relationships, random inputs, and so forth, Forrester did not expect model outputs to be measured against actual performance. It would usually not be possible to verify quantitatively whether any given simulation was in some sense correct (ibid., chap. 13). Rather, the aim was to use many different models to develop familiarity with unexpected types of long-term behavior that might potentially arise if changes were made to the system, and to make changes based on the insights derived with increased confidence that they would be effective. Managers would then be in a far better position to anticipate and prevent undesirable behaviors through sound planning, or, if undesirable phenomena did arise, it would be easier to recognize the problem for what it was and take informed steps to deal with it. In his book, Forrester repeatedly used the example of seasonal fluctuations in business that could actually be traced back not to the weather, but to the company's structure and policies. Managers who had studied system behavior could recognize and deal with the causes of the fluctuations, whereas managers who associated that behavior with the changing of the seasons might start making certain decisions at certain times of year and thereby create real seasonal phenomena that reinforced their own perceptions (ibid., 229, 338 and appendix N).
Ultimately, the act of model building was only constrained by model builders’ adherence to their personal familiarity with the ontology of an industry: the model was supposed to represent how the industrial system would actually be managed. The flows incorporated into the model could, in principle, be witnessed firsthand – no abstract quantities, such as those used in many economic models, would need to be included (ibid., 57–59 and chap. 10).Footnote 28 In so doing, model builders were expected not only to incorporate explicit company policies, but their own understanding of how the organization functioned in day-to-day practice to make a model approximate system behavior. This injunction included considering the consequences of lower level managerial actions taken in response to local perceptions that did not benefit from the overarching view of the organization enjoyed by those occupying its higher echelons.Footnote 29 Industrial Dynamics was not a means of direct control. Because much of the object was to devolve control onto lower echelons freeing up higher echelons for more creative tasks, it was more a means of understanding the implications of control devolution, and of developing company policies and structure appropriately.
Forrester wrote that in deciding what to include in a model, “the perception and judgment of the investigator are taxed,” that “skill and practice in working with dynamic behavior of systems are important,” and that one should “have courage” to include quantitatively those elements essential to a verbal description of industrial phenomena (ibid., 60–61). Here is where Paul Edwards’ “strikingly cavalier attitude” comes in. By experimenting with quantitative representations of even non-quantifiable system elements, the act of model making was meant to teach the builder – the manager or the student of management – about the manner in which even difficult-to-quantify elements affected the quantifiable elements of the system. Even in cases where decisions were made based on imprecise perceptions, the consequences of this imprecision would be measured against various potential precise states of reality, which would inevitably be the case whether managers relied upon their unaided judgment or used a simulation. The ability of the model to test the sensitivity of a system to imperfect decisions made in the face of various kinds of external realities that might never even be perceived in real life was also among the advantages of digital computer modeling.
Forrester, the economic analysts, and the optimizers
Forrester viewed the ability to manipulate a simulated reality in fine detail through the use of digital computers as a crucial advance over prior pedagogical technologies and, particularly, analytical methods that required only pen and paper. For the first time, one could analyze the simultaneous interaction of the numerous variables that determined how business functions interacted in feedback loops to create time-dependent phenomena. These variables could play off each other in unexpected ways and at unexpected times because of the business organization's overall nonlinear nature.
Notoriously, nonlinearity had plagued prior analytical efforts to track the erratic behavior of complex phenomena that defied exact mathematical analysis, even some as deceptively simple as the three-body problem in gravitation. (In the second part of our series we will see how even digital computers were found incapable of predicting the long-term behavior of some very simple systems.) Forrester understood that this potential for erratic behavior does not mean that such systems cannot be fruitfully analyzed and better controlled with the aid of digital computer simulations. Yet, we do well to remember that Forrester's analysis by digital computation did not represent the first technical attempt to grapple with the managerial problems of complicated industrial systems. Analysis had flourished using ordinary mathematical methods for well over a decade prior to the publication of Industrial Dynamics. Although Forrester claimed prior craft was primitive and doomed to obsolescence, it is still worthwhile for us to examine the relationship between his program and other pre-digital attempts to grapple with similar issues – namely, business cycle economics and mathematical theories of optimization – in order to understand better why the pedagogical intent of his project is so important epistemologically.
Since the interwar period, the delays that Forrester saw as playing a crucial role in understanding the long-term consequences of business practices had been suspected by certain economists (who referred to them as time lags) of playing a crucial role in the perpetuation of cyclic economic phenomena. Unlike Forrester, however, these economists were not so much interested in understanding how specific structural and policy changes were linked to this behavior as they were in understanding the core nature of business cycles. They sought to combine mathematical analysis and knowledge of economic activity to determine, for instance, whether business cycles were naturally self-sustaining or tended to damp out over time, and, in this latter case, whether they had been sustained in reality through discrete shocks or a constant driving force.
Just before World War II, for instance, the Oxford economist Roy Harrod (Reference Harrod1939) called for a new “dynamic” theory in economics capable of dealing effectively with problems of constant growth. He posited that unless business invested at a very certain “warranted” rate of growth (a curve that came to be known as the “knife's edge”), economic forces would exacerbate any deviation. Implying that the inevitable result of such unwarranted and amplified deviation would ultimately be a severe turnabout in economic fortunes, Harrod was quite happy to point out the relevance of his theory to economists interested in problems of phenomena related to time lags, particularly business-cycle analysts. Meanwhile, both before and after the war, Harvard economist Lloyd Metzler (Reference Metzler1941, Reference Metzler1946, and Reference Metzler1947) published on the factors affecting the development and length of inventory cycles. Richard Goodwin (Reference Goodwin1946, Reference Goodwin1951a, and Reference Goodwin and Hansen1951b), another Harvard economist, was interested in developing a theory of “nonlinear accelerators” that he supposed drove economic activity.Footnote 30
Goodwin also joined a postwar trend linking a traditional discipline with servomechanism theory, a trend that famously found a focus in MIT mathematician Norbert Wiener's 1948 work Cybernetics. Goodwin used servo theory to argue how an economy could waver back and forth across a moving point of economic equilibrium just as servo-directed guns were prone to “hunt” back and forth across a moving target. While the quality of a servomechanism was measured by its ability to track steadily a target's most likely future location, Goodwin conceded that actual policy matters were too complex for automated control: system complexity strained any obvious translations into policy practice. He gave credit to the Keynesian countercyclical program for refusing to dissect cyclical behavior, and for relying on detailed research to craft specific policy proposals. Here he drew on the servomechanism analogy to incorporate policy experts into the economic system, noting that the “Council of Advisers is an ‘error-detecting device’ and reports on the deviation between desired course and actual course. The Congress amplifies this signal into some large-scale input of the creation or destruction of purchasing power.” In an economy dominated by nonlinear forces, few generalizations about possible policy prescriptions could be made, and Goodwin preferred to limit his descriptions to how the economy worked, and to leave the steering to those experts with their hands already on the wheel (Reference Goodwin and Hansen1951b, 465–466). The former servo engineer Forrester, as we have seen, saw himself as in the business of training just this kind of expert.Footnote 31
Around this same time, optimization theorists spearheaded a separate trend in mathematical research. Initially, these theorists published largely in Econometrica, but, increasingly, their methods became more closely identified with the newly institutionalized fields of OR and management science. The determination of optimal inventory and production control policies swiftly became one of their most central concerns (and it remains a thriving object of theoretical inquiry today). The literature that inventory control theorists produced primarily concentrated on using the statistical expectation of demand to balance the costs of the storage of goods (as well as spoilage and obsolescence) against the anticipated penalties associated with possible inventory depletion. It would be too great a digression to discuss this literature here in detail,Footnote 32 so we will concentrate instead on a different approach quite relevant to our present concerns that was first developed by Herbert Simon at the Carnegie Institute of Technology in his paper “On the application of servomechanism theory in the study of production control” (Reference Simon1952) – some years before his own remarkable contributions to digital computer modeling outside of the forecasting tradition.Footnote 33
Simon, like some of the business cycle economists mentioned above, saw the potential in servomechanism theory for modeling inventory behavior. But, unlike most of these individuals, he actually wanted to employ the mathematics of servomechanisms in a prescriptive rather than in a descriptive manner.Footnote 34 He felt that the Laplace transformations that formed the core of servo theory could be used to design explicit decision rules for businesses that would determine inventory replenishment practices. While most decision rules from optimization theories advocated the determination of set points below which inventory should be restocked to a predetermined level given a stochastic demand distribution (the so-called “two bin” or “S, s” model),Footnote 35 Simon hoped to find a decision rule that would more intelligently respond to varying demand trends, acting as a “low-pass filter” (ibid., 263) to absorb short-term fluctuations, and only allow long-term fluctuations to be passed along to production units. The emphasis here was on the creative process of design. There was no naturally logical way to deduce an equation that would have the desired impact on the behavior of another equation, such as one representing factory output; one had to be constructed from basic assumptions.
The crux of equation design typically involves the choice of an input equation that, in some sense, adequately describes the behavior of a crucial system element. There are several such behavioral equations, such as the Poisson distribution or the step function, that are commonly used for such purposes. Such inputs appear in Forrester's models as well.Footnote 36 Without following Simon's argument step-by-step, in the simplest model given in the 1952 paper, a system with no production lag, he set up a feedback equation describing an inventory replenishment system and manipulated it using a Laplace transform so that, “by selecting [a decision rule] K 2 so that the characteristic function has large roots we guarantee rapid damping of θ 0 [actual inventory of finished goods] for sinusoidal loads,” “load” meaning consumer demand. Thus the decision rule was found to require certain “properties” in order “to assure a small or vanishing steady-state inventory excesses and deficiencies for various loads.” He noted, “among the operators that have been examined and found to possess satisfactory properties is K 2 = a/p + b, with a and b large positive constants.” This result was in the transformed domain (with variable p). Inversely transforming the equation back into the time domain, Simon derived a simple decision function that concluded, “the rate of production should be increased or decreased by an amount proportional to the deficiency or excess of inventory plus an amount proportional to the rate at which inventory is decreasing. . . . The relation b 2 > 4a should be preserved if oscillation is to be avoided.” We would like to emphasize here not the result, but simply the fact that Simon was trying to design equation elements that would ensure the system of equations he had laid out would always exhibit certain kinds of behaviors given certain kinds of expected inputs. Provided the equation system described the real inventory-production system reasonably well, decisions made according to the abstract rule would result in beneficial effects on the real system (ibid., 257–258).Footnote 37 For Simon, equation (i.e., localized policy) design was the central creative act of technical policymaking.
Jay Forrester was openly dissatisfied with both economic and OR and management science models of time delayed nonlinear phenomena. He viewed the former as so simple as to be nearly meaningless, working “backwards” to impute causal mechanisms based on only coarse observations of the nonlinear behaviors of enormously complex systems. Optimization models, by his reckoning, were also too simple, oftentimes existing only to prove their own logical coherence, and, at any rate, pertaining to only one isolated policy within a much larger terrain of interrelated policies (Forrester Reference Forrester1961, 3–4, 8–9, and 53–55).
If we took Forrester's criticisms at face value and declared his technique an obvious improvement, we would share his assumption that increasingly sophisticated tools making more expansive and faithful representations of the world always provided more useful and legitimate results. Similarly, we could then turn swiftly to Part II of our series to show how the wave of ambition accumulating on the back of digital computation was doomed to crash on the shoals of chaos theory. However, such is not the motivation behind the organization of the series. We are showing that different computational styles can develop without sharing key assumptions, and yet each can still make legitimate claims if those claims are evaluated in the proper context. If we followed either Forrester's view, or the common criticism that even digital computers cannot capture the slippery complexity of the real world, it would mask the fact that both analytical and digital simulation traditions have continually yielded important insights over the past half-century. While each approach certainly has its advantages and disadvantages, we wish to explore why their creators considered them legitimate and beneficial. So we return to the context of their work.
Recall that Forrester's program was developed for the new School of Industrial Management at MIT in the 1950s, even as OR failed to become an integral part of SIM. Both the OR advocate Philip Morse and Forrester agreed at that time that OR was an approach geared to the service of management. Industrial Dynamics, meanwhile, was designed as a methodology geared toward the initial and ongoing education of managers themselves.Footnote 38 This distinction has one crucial consequence. Specialists at the service of managers were supposed to choose, in conjunction with managers, specific problems to solve, but the techniques of OR and management science could play no part in this act of selection. The question of choosing a fertile problem was largely left to the experience of the manager, the ability of the specialists to select problems appropriate for their tools, and the intellectual creativity of their collaboration. Forrester, however, intended Industrial Dynamics to be used by managers to place their own expertise on firmer ground, and to help determine which problems were crucial to business operations and to sound out possible approaches to them that would not have a detrimental effect on system-wide business activities.
The problems chosen by managers and specialists for analytical study in optimization (and economics) were chosen because they were already suspected or known to be of some crucial significance in determining overall system behavior. The role of the subject could then be elucidated through a more thorough analysis conducted by a mathematical expert. As we have just seen, well before Forrester made his career turn to management, delays were a well-known cause of malignant down-the-line effects. Inventory was a popular topic for business cycle analysts and OR and management science practitioners precisely because it was already known to play a crucial role in causing – or guarding against – those effects. Operations researchers termed the choice of crucial problems (and criteria) for analysis “sub-optimization” (Hitch Reference Hitch1953).Footnote 39 While it is true that it was not possible to trace the cumulative effects through to production, and beyond, using the standard analytical toolkit, it was possible to isolate this function and to formulate policies that could exploit inventories to “uncouple” consumer demand from production, as one OR practitioner put it an article for the Harvard Business Review (Magee Reference Magee1956).Footnote 40
Such attempts could be mathematically quite rigorous, as in Simon's attempts to create an optimal decision rule that would act analogously to a low pass filter. Rigorous exploration of even simplified problems could refine managerial thinking about real problems, open up new approaches, and, ideally, indicate clear courses of action. As Simon noted in the conclusion to his paper, his results
could, at least in a qualitative sense, be reached intuitively. But even here, intuition has been aided by the frame of reference that servomechanism theory provides. Moreover, the more exact procedures permit statement of our results with a degree of precision that could not be attained without them. Even in this very early stage the theory permits actual numbers to be inserted for the construction of specific decision rules that would apply, with a considerable degree of realism, to actual situations. (Simon Reference Simon1952, 267)
On-the-ground OR practice could make use of advanced mathematical theories, or could simply distill their conclusions into insights informing simplified mathematical treatments, or even graphical means, of establishing inventory policies featuring precisely determined rules of action. These rules were at least a considered approach to a problem that was often dealt with by less effective and generally more haphazard and arbitrary means.Footnote 41
Sub-optimization, however, was very much a guiding principle or a watchword, and its existence was no guarantee that appropriate problems and criteria for optimization would be chosen. Industrial Dynamics can be seen, therefore, as something that was supposed to be better than sub-optimization. While still no guarantee of best practice, it could aid managers in feeling out how businesses (specifically, their own business) worked in order to select and develop approaches to crucial problems, which were often counterintuitive to practical experience. Inventory and production control was merely a demonstration of its power. Ultimately, Industrial Dynamics was supposed to give its users the means to explore the dynamical consequences of system structures in situations far more exotic and complex than such relatively well-understood areas as inventory, such as those arising in the interactions between the traditionally separate concerns of labor negotiations, production control, inventory control, and advertising. For Forrester, the creation of a package of policies was the central creative act of technical policy design. In this sense, Industrial Dynamics was not supposed to be so dependent on the state of the management “art,” to use Forrester's terminology, in order to select problems to which “science” could then be applied. It was explicitly intended to help managers and students of management organize the principles they already understood and push forward to find new ones. This was what Forrester understood to be the transformation of art into science.
Conclusion
Jay Forrester conceived of his modeling tools as a way to help individuals achieve a higher understanding of the behavior of complex systems that were subject to the policies that they themselves created. In the case of industrial systems, these individuals were clearly identified as managers who had access to detailed knowledge about how these systems functioned in real life. When Forrester shifted his attention to urban and global problems (Forrester Reference Forrester1969 and Reference Forrester1971), his models necessarily abandoned the close knowledge of the industrial system's relatively concrete ontological structure, which was readily accessible to experienced managers, and started to represent more amorphous correlations (for example, the relationship between population density and disease), which were not accessible in their entirety to anyone. Further, outside of the context of the School of Industrial Management, the original pedagogical focus of Industrial Dynamics was largely abandoned, leaving only a highly experimental use for his kind of simulation. System Dynamics models could say what the system in question might behave like, if the structure of the model corresponded reasonably well to a complete palette of relevant real-life correlations, but there was no way of evaluating the robustness of some of the most important correlations because the scope of this palette and the nature of the correlations it contained were not well understood.Footnote 42 Thus in these cases there was no way of retooling models based on the known realism of their behavior – only the plausibility of this behavior.
Such experimental tools could prove of real value in studying policy options, but they were never appropriate for the purpose to which they were put in the early 1970s when publicized by the Club of Rome, an elite international advocacy group.Footnote 43 Far from MIT these models were taken to represent forecasts of real catastrophes in the global environment and population. Surely it was true that the models could reveal possible mechanisms by which such catastrophes might occur so that those already in authority could make better decisions. Yet, they were all too easy to question as devices of public advocacy employed by those working outside existing authorities, because they could not offer specific policy recommendations on the basis of simulation results, and were simple to critique as forecasts. In order to understand Forrester's continued adherence to the program of System Dynamics to study such matters, it is important to appreciate his understanding of it as the learning tool for policymakers that he initially intended it to be, rather than as a producer of scientific facts for advocates wishing to claim intellectual authority over policymakers.Footnote 44 However, we will not venture to discuss the details of Forrester's work after Industrial Dynamics any further in this series.
In this paper we have concentrated primarily on the pedagogical intent and institutional context of Forrester's work, allowing the epistemological choices implied by the decision to use digital electronic tools versus the written tools of mathematical analysis to remain only partly explored. In part this concentration reflects the historiographical need to prioritize an explanation of the importance of the intended user for understanding the epistemology of Forrester's simulations. However, it also has to do with the fact that the technological story, which seems (at least initially) to have followed the usual metric of complexity of model, is simply not very exciting. But much of our motivation in preparing this series is to emphasize that the link between epistemology and material culture need not follow such linear stories of computational progress, which brings us to Part II.
In the early 1960s, not far from Forrester's perch at the School of Industrial Management, MIT meteorologist Edward Lorenz, using only an unruly digital computer, would inadvertently throw an epistemological spanner in the works of meteorological forecast modelers’ ambitions to predict distant future states of weather systems. Where Forrester merely sidestepped forecasting to concentrate on system behavior, Lorenz's work would help inspire a research program dedicated to understanding the ways in which forecasting can become a physical impossibility. What could make such forecasts impossible was a previously underappreciated phenomenon that arose even in a deceptively simple model of three interlocking differential equations. We will track this kind of model not only at MIT but also in the use of analog computers in the earliest days of the Dynamical Systems Collective at UC Santa Cruz in the 1970s and ‘80s, and show how complex and unpredictable behaviors arising from systems governed by very simple equations – not only the Lorenz model but also such familiar systems as a dripping faucet – became objects of interest in their own right. In Part II, we will throw into sharper focus just what sort of benefit is derived by the use of just what sort of machine when applied to specifically non-forecasting ends.
Despite the cultural differences between Jay Forrester and the Dynamical Systems Collective, both embraced only marginally different ways of learning through computational tinkering. Where Forrester stressed building robust systems by tinkering with the structure of complex digital models between discrete runs, the DSC stressed probing the nature of the sensitivities of certain model structures by tinkering with their parameters as they ran in real time on analog machines. Neither approach conformed to any clear epistemology featuring the suggestion and confirmation of hypotheses. Rather, both constituted new and related epistemological possibilities accompanying the development of new uses of simulation technologies that were geared toward ends other than forecasting.