

Introduction
Due to the obesity epidemic in reproductive-age women, a large percentage of newborns are developmentally exposed to an “over-nutrition” environment leading to generational programming of physiological and neurological systems and increasing susceptibility to an obesogenic diet.Reference Flegal, Kruszon-Moran, Carroll, Fryar and Ogden1 Such links between maternal nutrition and health began with the “Thrifty Gene” hypothesis, which postulates that a poor or improper nutritional environment during in utero or neonatal development predisposes children to adult onset diseases such as type II diabetes and obesity.Reference Barker, Bull, Osmond and Simmonds2
Maternal obesity or maternal high-fat diet (HFD) alters offspring energy homeostasis leading to an increase in the incidence of adult obesity and insulin resistance, especially on an obesogenic diet.Reference Howie, Sloboda, Kamal and Vickers3–Reference Samuelsson, Matthews, Jansen, Taylor and Poston6 Although the molecular mechanisms underlying the effects of maternal obesity or HFD remain unclear, epigenetic modification of hypothalamic genes, disruption in the melanocortin-paraventricular neurocircuitry, and an increase in neuroinflammation have emerged as mediators of pathogenesis.Reference Vogt, Paeger and Hess7–Reference Bilbo and Tsang11 For example, maternal HFD hypermethylates promoters to the Pomc gene in female offspring, which potentially reduces expression leading to increased food intake and reduced energy expenditure.Reference Marco, Kisliouk, Tabachnik, Meiri and Weller12 A maternal HFD rich in n-6 polyunsaturated fatty acids (PUFA) increases hypothalamic expression of both ERα and ERβ and alters alcohol consumption, aggression, and depressive-like behaviors.Reference Cabanes, De Assis, Gustafsson and Hilakivi-Clarke13,Reference Raygada, Cho and Hilakivi-Clarke14 The data suggest that maternal HFD impacts the neuroendocrine signaling of estrogens during development which alters homeostasis and behavior in offspring.
ERα signals through nuclear-initiated and membrane-initiated mechanisms to control gene expression, signal transduction, and cellular processes. In the nucleus, ERα can bind directly to DNA through the EREs (ERE-dependent) or through protein–protein interactions with other transcription factors (ERE-independent).Reference Hammes and Levin15 To modulate cell physiology and control gene expression, ERα activates signaling cascades (MAPK, PLC, PI3K),Reference Qiu, Bosch and Tobias16–Reference Ronnekleiv, Malyala and Kelly21 which is also considered ERE-independent. We recently demonstrated that activation of ERE-independent signaling in ovariectomized female mice reduces the effects of adult HFD on energy and glucose homeostasis.Reference Yasrebi, Rivera, Krumm, Yang and Roepke22 These transgenic mice express a mutated ERα that does not bind to ERE but retains other nuclear-initiated (protein–protein interactions, hormone response element binding) and membrane-initiated (activation of signal transduction pathways) ERα signaling. These ERα knockin/knockout (KIKO) are referred to in this manuscript using the KIKO abbreviation, which was first described by the laboratory that generated the model.Reference Hewitt, O’Brien, Jameson, Kissling and Korach23 Because ERE-independent mechanisms are involved in the development and control of metabolism, a potential mechanism for the disruption in energy homeostasis in total KO females is the loss of ERE-independent ERα signaling during neurogenesisReference Couse and Korach24–Reference Semaan and Kauffman26 and the proliferation and differentiation of neural stem cells.Reference Brannvall27
Previously, we reported that the loss of total ERα signaling blocks the influence of maternal HFD on energy and glucose homeostasis in females fed a normal chow diet.Reference Roepke, Yasrebi and Villalobos28 We also found evidence that restoring ERE-independent ERα signaling partially restores susceptibility to maternal HFD. In a concurrent study, we fed HFD to a subset of female offspring, wild-type (WT), KO, and KIKO, for 20 weeks (age 5–25 weeks). Female offspring were bred from WT/KO dams fed a control breeder diet or HFD prior to mating with all male pups culled during lactation. All adult female offspring experienced the same battery of physiological tests (body composition, metabolic and activity assessment, and glucose (GTT) and insulin tolerance test (ITT)). Terminal plasma was analyzed for peptide hormones and inflammatory cytokines. Arcuate (ARC) and liver tissue was collected for assessment of gene expression. Our objective was to assess if loss of ERE-dependent or ERE-independent ERα signaling during development alters the effect of maternal HFD on female mice fed an obesogenic diet. Our results suggest that the loss of ERE-dependent ERα signaling during development increases sensitivity to adult HFD after exposure to a maternal HFD.
Materials and methods
Animals
All animal treatments were in accordance with institutional guidelines based on the National Institutes of Health standards and were performed with the Institutional Animal Care and Use Committee (IACUC) approval at Rutgers University. Female WT (WT C57BL/6J), ERα KO (KO), and ERα KIKO (KIKO) transgenic mice (provided by Dr. Ken Korach, National Institute of Environmental Health Sciences)Reference Hewitt, Kissling and Fieselman29,Reference Hewitt, Li and Grimm30 were selectively bred in-house and maintained under controlled temperature (23°C) and photoperiod conditions (12/12 h light/dark cycle) with food and water ad libitum. WT/KO males and females were mated to produce ERα KO females. Nonclassical ERα knock-in males (WT/KI) and WT/KO females were crossed to generate KIKO females. WT females were generated from both colonies and used with their KIKO and KO littermates. At weaning, females were tagged and ear-clipped for genotype determination by polymerase chain reaction (PCR) of extracted DNA using previously published protocols.Reference Hewitt, Kissling and Fieselman29,Reference Hewitt, Li and Grimm30
Maternal HFD experimental design
Similar to our earlier report,Reference Roepke, Yasrebi and Villalobos28 we modeled our experiment after a previous study that compared the effects of two maternal diets: a standard chow diet and a semipurified HFD.Reference Sun, Purcell and Terrillion31 In this study, run concurrently with the previous report, WT/KO (n = 12/maternal diet) dams were fed either a standard breeder chow diet (Con, 25% fat kCal, 3.83 kcal/g, Lab Diet 5015; Lab Diet, St. Louis, MO, USA) or HFD (45% fat kCal, 4.73 kcal/g, D12451; Research Diets, New Brunswick, NJ, USA) for 4 weeks prior to breeding with an untreated WT/KO or WT/KI male. Pregnant dams were fed the same diet for the duration of gestation and lactation totaling 10 weeks. HFD-fed dams gained more weight than the Con-fed dams prior to breeding (data not shown) but were not metabolically characterized during gestation or lactation to reduce the impact of stress on developmental programmingReference Dunn, Morgan and Bale32 and neuronal ERα expression.Reference Pallarés, Baier and Adrover33 Male pups were culled on postnatal day (PND) 4 to reduce the influence of varying litter size on offspring energy homeostasis. The reduction in litter size also influenced the maternal overnutrition design. The average litter size was 7.9 ± 0.4 pups (n = 24) for Con-fed WT/KO dams and 8.5 ± 0.4 for HFD-fed WT/KO dams (n = 24). The average number of female pups per litter was 4.1 ± 0.3 for Con-fed WT/KO dams and 4.5 ± 0.3 for HFD-fed WT/KO dams. At PND 21, female pups from each litter were weaned onto standard chow (13% kCal fat, 3.48 kcal/g, Lab Diet 5V75; low phytoestrogen, <75 ppm) as the maternal control diet is specifically made to accommodate the high energetic needs of breeding females. At 5 weeks, all females genotyped as WT, KIKO, or KO were weighed and fed HFD (45% fat kCal, 4.73 kcal/g, D12451; Research Diets). Females were group-housed by genotype to reduce the stress of single housing per IACUC protocols.
Adult offspring experimental design
From 5 to 25 weeks of age, females were weighed weekly without monitoring the estrous cycle as KO and KIKO do not exhibit a normal estrous cycle.Reference Park, Zhao and Glidewell-Kenney34,Reference Jakacka, Ito and Martinson35 At the end of 25 weeks, body composition was measured using an EchoMRI 3-in-1 Body Composition Analyzer (Echo Medical Systems, Houston, TX, USA) followed by a 48 h run in a Comprehensive Lab Animal Monitoring System (CLAMS; Columbus Instruments, Columbus, OH, USA) to measure metabolic parameters and activity (X- and Z-plane). After CLAMS, a GTT was performed on each female following the standard protocols.Reference Roepke, Yasrebi and Villalobos28 Immediately after baseline, females were injected intraperitoneally (i.p.) with glucose (2.0-g/kg body weight) and individually housed in clean cages. After sufficient recovery (~3–4 days), an ITT was performed after a 5 h fast with an i.p. injection of insulin (0.75 units/kg). Blood samples were collected from the tail in individual cages at 15, 30, 60, 90, and 120-min postinjection for both the GTT and ITT. See Supplemental Fig. S1 for a graphical illustration of the maternal and adult experimental design.
Brain and body dissections
After sufficient recovery from ITT (~1 week), females were decapitated after sedation with ketamine (100 µl of 100 mg/ml, i.p.) at 1000 h. Trunk blood was collected in a K+ EDTA collection tube and analyzed for triglyceride levels using a CardioChek (Polymer Technology Systems, Indianapolis, IN, USA). The protease inhibitor, 4-(2-aminoethyl) benzenesulfonyl fluoride hydrochloride (1 mg/ml; Sigma-Aldrich, St. Louis, MO, USA), was added to each tube for peptide hormone and inflammatory cytokine analysis. Samples were maintained on ice until centrifugation at 3000 rpm for 15 min at 4°C and stored at –80°C until analysis. Insulin, leptin, interleukin 6 (IL-6), monocyte chemoattractant protein 1 (MCP-1), and tumor necrosis factor α (TNFα) were determined by multiplex assay (MMHMAG-44K; EMD Millipore, Billerica, MA, USA).
Abdominal cavity was dissected for liver tissue (secondary lobe), which was fixed in RNAlater (Life Technologies, Grand Island, NY, USA) and stored at –80°C. Liver RNA was extracted using a TRIzol® extraction (Life Technologies) coupled with Macherey-Nagel NucleoSpin® RNA extraction and DNase-1 kit (Bethlehem, PA, USA). The brain was immediately extracted from the skull, and the arcuate (ARC) nucleus was dissected and preserved in RNAlater (Life Technologies) and stored at –80°C as previously described.Reference Roepke, Yasrebi and Villalobos28 Total RNA was extracted and DNase I-treated using Ambion RNAqueous-Micro Kits (Life Technologies) per the manufacturer’s protocol. Liver and ARC RNA quantity and quality were determined using a NanoDrop ND-2000 spectrophotometer (ThermoFisher, Waltham, MA, USA) and an Agilent 2100 Bioanalyzer and RNA Nano Chips (Agilent Technologies, Santa Clara, CA, USA). Only samples with RNA Integrity Number >7 were used.
Analysis of gene expression used standard protocols for quantitative real-time PCR (qPCR) as previously described.Reference Mamounis, Yang, Yasrebi and Roepke36 Briefly, complementary DNA (cDNA) was synthesized using a standard Superscript III reverse transcriptase (Life Technologies) protocol: 5 min at 25°C, 60 min at 50 °C, and 15 min at 70°C. All primers were designed to span exon–exon junctions and synthesized by Life Technologies, using Clone Manager 5 software (Sci Ed Software, Cary, NC, USA). See Supplemental Table S1 for a listing of all the primer sequences. Primers for Esr1 were designed between exons 1 and 2, which is not deleted in the Ex3a ERα KO. Quantitative real-time PCR amplification followed standard protocols for PowerSYBR Green (Life Technologies) or Sso Advanced SYBR Green (BioRad, Hercules, CA, USA) master mixes on CFX-Connect Real-time PCR instrument (BioRad). All efficiencies were between 90% and 110%. The relative mRNA expression was calculated using the ΔΔCT method utilizing a calibrator of diluted (1:20) cDNA from liver or basal hypothalamus of an untreated male. The geometric mean of the reference genes Actb, Hprt, and Gapdh was used to calculate δCq values. Quantification values were generated only from samples showing a single product at the expected melting point. All gene expression data were expressed as an n-fold difference.Reference Schmittgen and Livak37
Statistical analysis
Due to the occurrence of female WT, KIKO, and KO in each litter (~one WT and one transgenic female/litter), each female represents one litter and all data were analyzed as such. All multifactorial data (maternal diet, genotype, time) were analyzed using Statistica 7.1 software (StatSoft, Tulsa, OK, USA) and all two-factor (maternal diet, genotype) were analyzed using Prism 6 (GraphPad Software, La Jolla, CA, USA). All data were analyzed by the appropriate analysis of variance (ANOVA) followed by a post-hoc Newman–Keuls test. All gene expression data were normalized to the WT Con group for comparison across genotypes. All ANOVA statistics are presented in Supplemental Tables S3–S5. All data were expressed as mean ± standard error of the mean (SEM) and effects were considered significant at α ≤ 0.05.
Results
Body weight and body composition
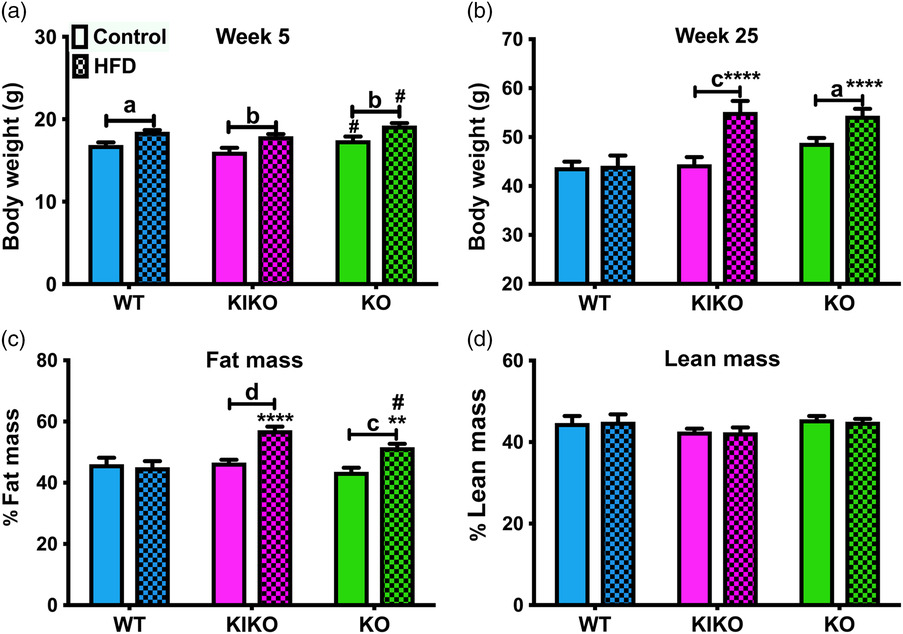
In our previous study, maternal HFD increased body weight in all genotypes at 5 weeks on a standard chow diet.Reference Roepke, Yasrebi and Villalobos28 Similarly, 5-week-old (peripubertal) females from HFD-fed dams of each genotype weighed more than their counterparts from control (Con)-fed dams (Fig. 1a, Con = maternal control diet; HFD = maternal HFD diet). WT from Con-fed dams (n = 11) weighed 16.9 ± 0.2 g, and WT from HFD-fed dams (n = 11) weighed 18.5 ± 0.2 g (P < 0.05). KIKO from Con-fed dams (n = 10) weighed 16.1 ± 0.5 g, and KIKO from HFD-fed dams (n = 9) weighed 17.9 ± 0.3 g (P < 0.01). KO from Con-fed dams (n = 11) weighed 17.4 ± 0.5 g, and KO from HFD-fed dams (n = 12) weighed 19.2 ± 0.3 g (P < 0.01). However, when fed HFD, the effect of maternal HFD on body weight was maintained in KIKO and KO females, while WT females from HFD-fed dams were not heavier than WT from Con-fed dams.
Body weight and body composition of adult females. (a) Body weights at week 5 in all genotypes from Control (Con)-fed and HFD-fed dams. (b) Body weights at week 25 in all genotypes after 20 weeks of HFD. (c) Percent body fat (fat mass/body mass) of female mice from all groups. (d) Percent lean mass (lean mass/body mass) of female mice from all groups. Control = maternal control diet and HFD = maternal HFD diet. Data were analyzed by two-way ANOVA with post-hoc Newman–Keuls test. Sample sizes were 9 to 12 per genotype per treatment and data are expressed as mean ± SEM. Capped lines denote comparison between maternal diets within genotypes. Asterisks (*) denote comparison to WT within the same diet group. The pound sign (#) denotes comparison of KIKO and KO within the diet group. (a/*/# = P < 0.05; b/**/## = P < 0.01; c/***/### = P < 0.001; d/****/#### = P < 0.0001).

In our initial study, WT and KIKO females from HFD-fed dams that were fed a standard chow diet were heavier than their counterparts from Con-fed dams.Reference Roepke, Yasrebi and Villalobos28 In the current study, we expected that adult HFD would have a greater effect on KO than WT and KIKO as we previously demonstrated.Reference Yasrebi, Rivera, Krumm, Yang and Roepke22 After 23 weeks on HFD (Fig. 1b), WT from Con-fed dams (n = 10) weighed 43.8 ± 1.1 g, and WT from HFD-fed dams (n = 11) weighed 44.1 ± 2.1 g. KIKO from Con-fed dams (n = 9) weighed 44.4 ± 1.5 g, and KIKO from HFD-fed dams (n = 9) weighed 55.1 ± 2.3 g (P < 0.001). KO from Con-fed dams (n = 10) weighed 48.8 ± 1.0 g, and KO from HFD-fed dams (n = 11) weighed 54.4 ± 1.4 g (P < 0.05). Contrary to our prediction, maternal HFD did not alter body weight in HFD-fed WT, yet it did magnify the effects of adult HFD in KIKO and KO on adult body weight. Consequently, KIKO and KO females from HFD-fed dams gained more body fat on the obesogenic adult diet than their WT counterparts (P < 0.0001, P < 0.01, respectively) and more fat than the KIKO and KO females from Con-fed dams (P < 0.0001, P < 0.001, respectively; Fig. 1c). There was no effect of maternal HFD on lean mass (Fig. 1d). Collectively, these data suggest that the loss of ERE-dependent signaling in KIKO and KO sensitizes females to the effects of maternal HFD on an obesogenic diet.
Metabolic parameters
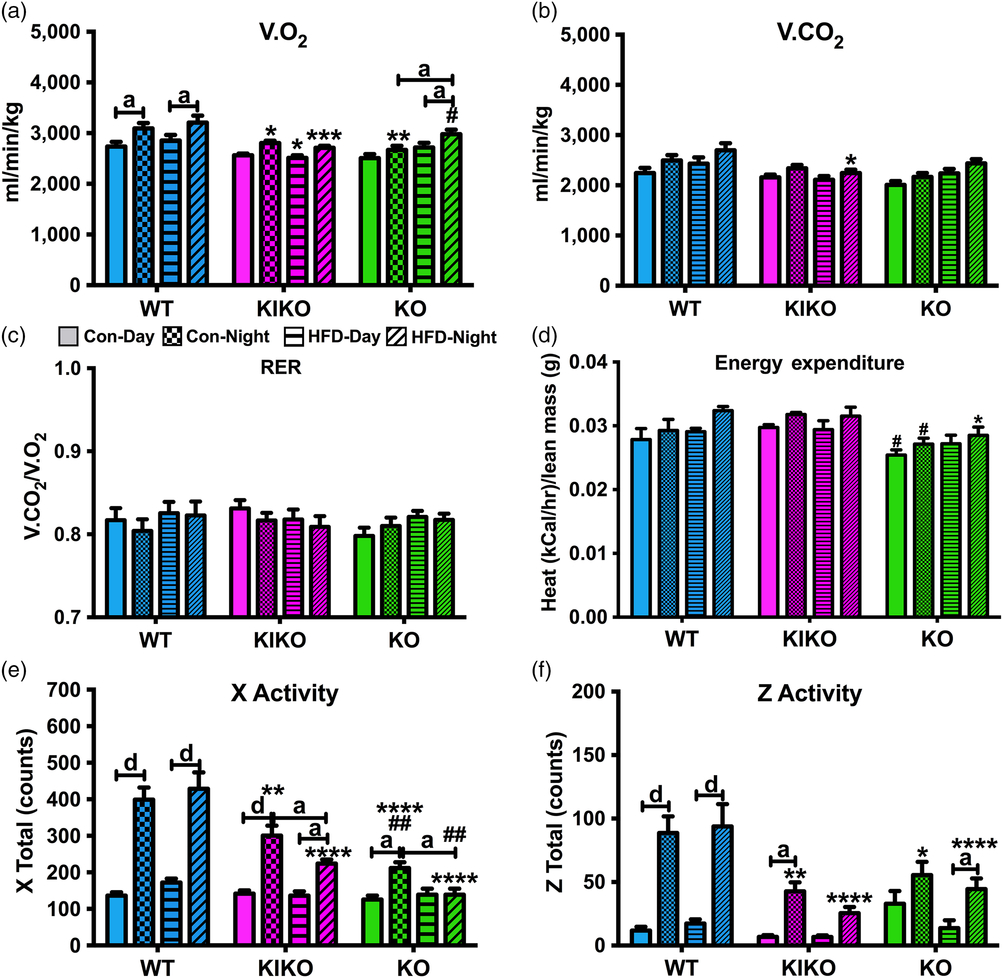
To determine the effects of maternal HFD on energy expenditure, substrate utilization, and activity, all females were transferred to CLAMS.Reference Lam and Ravussin38 In our previous study, we observed elevated V.O2 during the daytime after maternal HFD in WT and KO but not KIKO.Reference Roepke, Yasrebi and Villalobos28 As such, we expected to find lower V.O2 in the KIKO and KO females from HFD-fed dams as their body weights were higher than WT and KIKO and KO from Con-fed dams. Overall, V.O2 was affected by genotype, maternal diet, and time (Fig. 2a). V.O2 was elevated in the nighttime compared to daytime in WT from Con-fed dams (P < 0.05) and HFD-fed dams (P < 0.05), with no effect of maternal HFD. In KIKO, V.O2 was not elevated in the nighttime; however, V.O2 in KIKO was lower than in WT females (Con nighttime: P < 0.05; HFD nighttime: P < 0.001; HFD daytime: P < 0.05). In KO, nighttime V.O2 was higher than the daytime only in the HFD-fed dam group (P < 0.05) and was higher in the nighttime in the HFD-fed dam group compared to the Con-fed dam group (P < 0.05). Interestingly, nighttime V.O2 in KO from Con-fed dams was lower than WT, and nighttime V.O2 in KO from HFD-fed dams was higher than KIKO (P < 0.05). In summary, the lower oxygen consumption in KIKO and KO compared to WT is likely involved in the effects of maternal HFD on body weight gain.
Metabolic and activity parameters in females from all genotypes after 20 weeks of HFD determined using the CLAMS. (a) V.O2 (ml/min/kg); (b) V.CO2 (ml/min/kg); (c) RER (V.CO2 /V.O2); (d) Energy expenditure (kCal/hr/lean mass (g)); (e) X-plane activity (counts); and (f) Z-plane activity (counts). Data were analyzed by a multifactorial ANOVA (genotype, maternal diet, time) with post-hoc Newman–Keuls test. Con = Maternal Control Diet and HFD = Maternal HFD. See Fig. 1 for information on treatment categories, sample sizes, and statistical comparisons (a/*/# = P < 0.05; b/**/## = P < 0.01; c/***/### = P < 0.001; d/****/#### = P < 0.0001).

V.CO2 was affected by genotype, maternal HFD, and time (Fig. 2b); however, there were few pairwise differences (WT nighttime V.CO2 > KIKO nighttime V.CO2 (P < 0.05)), mostly likely due to the overall suppressive effect of an adult HFD on nighttime V.CO2. Respiratory exchange ratio (RER) was not affected by genotype, maternal diet, or time, as the adult HFD was the main driver in suppressing substrate utilization (Fig. 2c). Because body weight can influence metabolism, RER was analyzed by an analysis of covariance (ANCOVA) with body weight as a covariate and plotted as a function of body weight (Supplemental Fig. S2a). Overall, neither genotype nor maternal HFD affected the relationship of body weight and RER.
While we expected to observe lower heat production (energy expenditure; normalized to lean body mass) in both KIKO and KO compared to WT, energy expenditure was only lower in KO from HFD-fed dams during the nighttime compared to WT groups (P < 0.05) and energy expenditure was lower in KO from Con-fed dams compared to KIKO females (P < 0.05). Overall, energy expenditure was affected by genotype, maternal diet, and time (Fig. 2d). A suppression of heat production indicates lower metabolic rates, thus maternal HFD suppressed metabolic rates in KO females only during the nighttime in comparison to WT. We also analyzed daytime and nighttime heat by an ANCOVA with body weight as a covariate (Supplemental Fig. S2b and c). As expected, maternal HFD affected the relationship of body weight and energy expenditure during the day (P < 0.01) and night (P < 0.001). These data, in total, indicate that metabolic rates may partially underlie greater susceptibility of KIKO and KO to maternal HFD.
We expected to find genotypic differences in activity with KIKO and KO moving less than WT, as was previously observed.Reference Roepke, Yasrebi and Villalobos28,Reference Mamounis, Yang, Yasrebi and Roepke36 In the current study, both X-plane and Z-plane activities were affected by genotype, time, and the interactions between genotype and time, while only X-plane was affected by an interaction of genotype and maternal diet (Fig. 2e, 2f). X-plane activity was higher in the nighttime than the daytime in WT and KIKO females, regardless of maternal diet. However, KO females from HFD-fed dams did not exhibit higher activity in the nighttime compared to daytime and were less active during the nighttime than both their WT and KIKO counterparts, regardless of maternal diet. KIKO were also less active than WT during the nighttime regardless of maternal diet. Maternal HFD reduced nighttime activity in both KIKO (P < 0.05) and KO (P < 0.05) females. Z-plane activity was higher in the nighttime than the daytime in WT females, and again, KIKO and KO were less active during the nighttime compared to WT, regardless of maternal diet. These data collectively suggest that the loss of ERE-dependent signaling in KIKO and KO females sensitizes the locomotor behavior in offspring to adult and maternal HFD.
Glucose and insulin tolerance
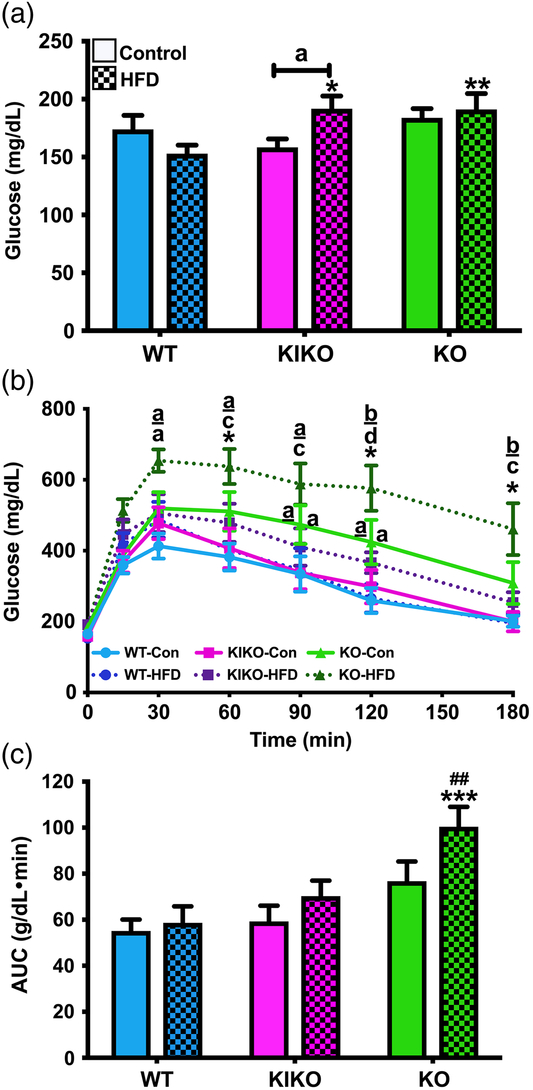
In our previous study, we observed strong genotypic effects on glucose tolerance in chow-fed females regardless of maternal diet.Reference Roepke, Yasrebi and Villalobos28 KO females from both Con-fed and HFD-fed exhibited slower glucose clearance than WT or KIKO females. In HFD-fed female offspring, we expected to find similar effects on glucose tolerance. Fasting glucose levels, an indicator of a diabetic-like state, were affected by an interaction of genotype and maternal diet (Fig. 3a). For example, KIKO and KO females from HFD-fed dams exhibited elevated glucose levels compared to WT from HFD-fed dams (P < 0.05; P < 0.01, respectively). Unlike in our first study,Reference Roepke, Yasrebi and Villalobos28 KIKO females from HFD-fed dams exhibited elevated fasting glucose compared to KIKO from Con-fed dams (P < 0.05). There was no effect of maternal HFD on terminal blood triglycerides (non-fasted) (data not shown). Glucose clearance was slower in KO from Con-fed dams compared to WT and KIKO females at 90 and 120 min (Fig. 3b) and in KO from HFD-fed dams compared to WT and KIKO females at 30, 60, 90, 120, and 180 min. Furthermore, KO females from HFD-fed dams exhibited slower glucose clearance than KO from Con-fed dams at 50, 120, and 180 min. Integral analysis of the area under the curve (AUC) illustrates the influence of genotype and maternal diet on glucose clearance (Fig. 3c). KO from HFD-fed dams exhibited slower glucose clearance compared to WT (P < 0.001) and KIKO (P < 0.01).
Fasting glucose levels and GTT in adult females from all genotypes after 20 weeks of HFD. (a) Fasting glucose levels. (b) GTT from all genotypes and maternal diets. (c) AUC analysis for all genotypes and maternal diets. (a, c) Data were analyzed by a two-way ANOVA with post-hoc Newman–Keuls test. (b) Data were analyzed by repeated-measures, multifactorial ANOVA with post-hoc Newman–Keuls test. Con = Maternal Control Diet and HFD = Maternal HFD. See Fig. 1 for information on treatment categories and sample sizes. Letters denote comparison between WT and KO within the HFD-fed dam group and underlined letters denote comparison between KIKO and KO within the HFD-fed dam group. Asterisks denote comparison within genotype across maternal diets (a/*/# = P < 0.05; b/**/## = P < 0.01; c/***/### = P < 0.001; d/****/#### = P < 0.0001).

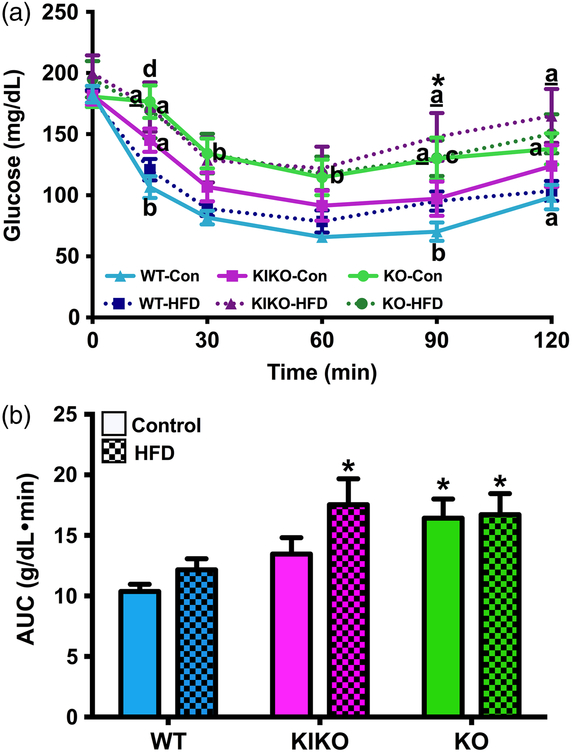
In our previous study, there was no effect of maternal HFD or genotype on insulin tolerance.Reference Roepke, Yasrebi and Villalobos28 As such, we expected to find no effects of maternal HFD in this study as all females were fed a HFD, which is known to reduce insulin tolerance.Reference Yasrebi, Rivera, Krumm, Yang and Roepke22,Reference Handgraaf, Riant and Fabre39 Unexpectedly, insulin-induced glucose clearance was altered by maternal HFD as well as genotype, time, and an interacton of genotype and time (Fig. 4a). Specifically, KIKO females from HFD-fed dams exhibited insulin intolerance compared to their counterpart from Con-fed dams, as indicated at 90 min (P < 0.05). WT and KO, although exhibiting different glucose clearance profiles, were not altered by maternal HFD, as observed in integral analysis of the AUC (Fig. 4b). Indeed, KO from both Con-fed and HFD-fed dams exhibited less glucose clearance than WT (P < 0.05, both) as did KIKO from HFD-fed dams (P < 0.05). These data suggest that the loss of ERE-dependent signaling during criticial development windows (perinatal) potentiates the impact of maternal HFD on insulin tolerance and glucose clearance during diet-induced obesity (DIO).
ITT in adult females from all genotypes after 20 weeks of HFD. (a) ITT from all genotypes and maternal diets. (b) AUC analysis for all genotypes and maternal diets. Con = Maternal Control Diet and HFD = Maternal HFD. (a) Data were analyzed by repeated-measures, multifactorial ANOVA with post-hoc Newman–Keuls test. (b) Data were analyzed by a two-way ANOVA with post-hoc Newman–Keuls test. See Fig. 1 for information on treatment categories and sample sizes. Letters denote comparison between WT and KO within the HFD-fed dam group, and underlined letters denote comparison between KIKO and KO within the HFD-fed dam group. Asterisks denote comparison within genotype across maternal diets (a/* = P < 0.05; b/** = P < 0.01; c/*** = P < 0.001; d/**** = P < 0.0001).

Hormones and inflammatory cytokines
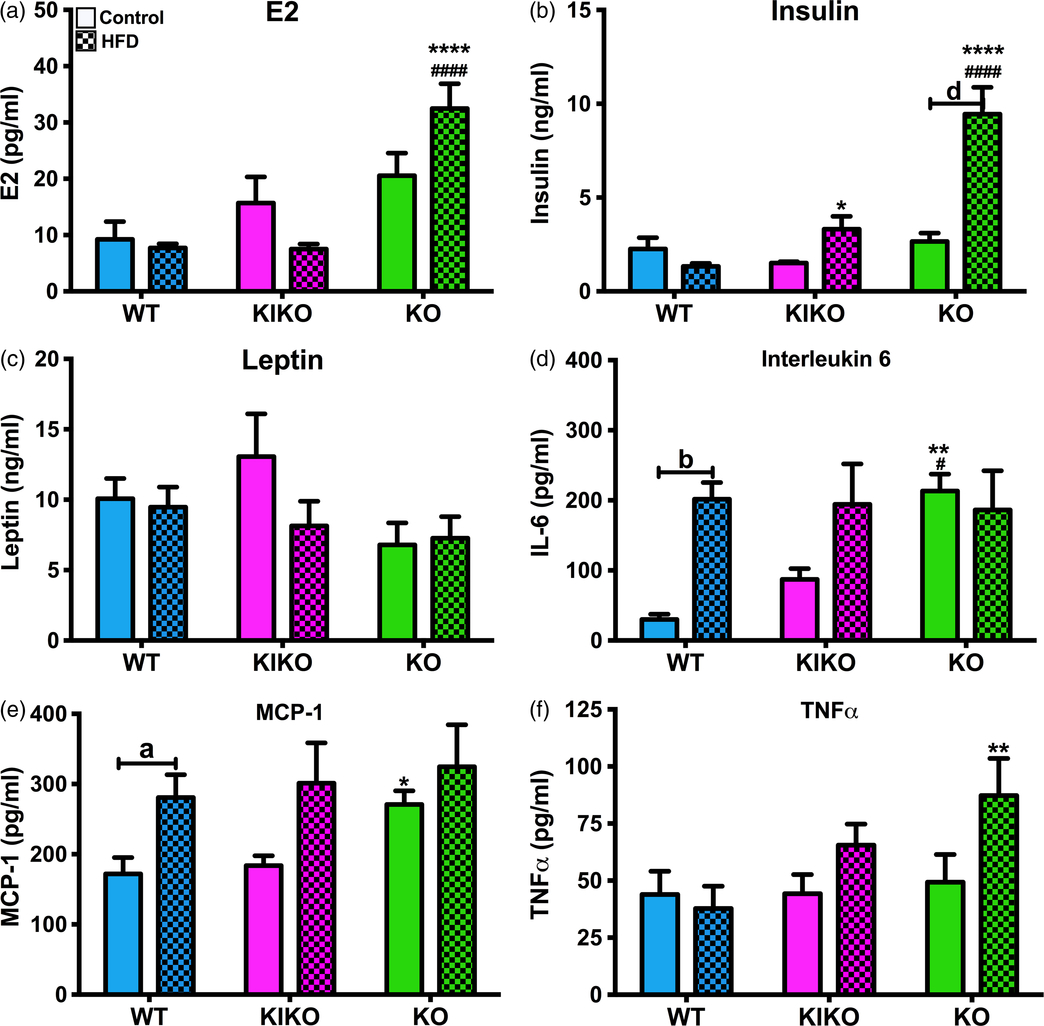
Next, we determined if maternal HFD alters the production of E2, peptide hormones, and inflammatory cytokines, as we previously reported.Reference Roepke, Yasrebi and Villalobos28 We expected that E2 would be elevated in KO. Indeed, E2 levels in KO from HFD-fed dams were elevated compared to their WT and KIKO counterparts (Fig. 5a). In our previous publication, maternal HFD augmented insulin in KO and leptin in WT females.Reference Roepke, Yasrebi and Villalobos28 In this study, maternal HFD augmented plasma insulin levels in KO females, which expressed ~4 times the plasma insulin as KO from Con-fed dams (P < 0.0001; Fig. 5b). Furthermore, insulin levels in KIKO and KO from HFD-fed dams were elevated compared to their WT counterparts (P < 0.05, P < 0.0001, respectively), suggesting that ERE-independent signaling is partially protective against the effects of maternal HFD on insulin production. Maternal HFD had no effect on plasma leptin as the main driver of leptin production is the increase in adiposity due to the adult HFD (Fig. 5c). All leptin levels were higher than in the chow-fed females from our previous study.Reference Roepke, Yasrebi and Villalobos28
Hormones and inflammatory cytokines from all genotypes after 20 weeks of HFD. (a) Plasma levels of 17β-estradiol (pg/ml). (b) Plasma levels of insulin (ng/ml). (c) Plasma levels of leptin (ng/ml). (d) Plasma levels of IL-6 (pg/ml). (e) Plasma levels of MCP-1 (pg/ml). (f) Plasma levels of TNFα (pg/ml). Con = Maternal Control Diet and HFD = Maternal HFD. Data were analyzed by a two-way ANOVA with post-hoc Newman–Keuls test. See Fig. 1 for information on treatment categories, sample sizes, and statistical comparisons (a/*/# = P < 0.05; b/**/## = P < 0.01; c/***/### = P < 0.001; d/****/#### = P < 0.0001).

In our previous study, we observed increases in inflammatory cytokines IL-6 and MCP-1 due to maternal HFD in WT females.Reference Roepke, Yasrebi and Villalobos28 As expected, similar effects were observed in this study in WT females. Plasma IL-6 levels were primarily affected by maternal diet and an interaction of genotype and maternal diet (Fig. 5d). Plasma IL-6 levels were higher in WT females from HFD-fed dams than from Con-fed dams (P < 0.01), with KIKO exhibiting a similar pattern. Plasma IL-6 levels in KO from Con-fed dams were also higher than WT (P < 0.01) and KIKO (P < .05) groups. Plasma MCP-1 expression was affected by maternal HFD (Fig. 5e). WT from HFD-fed dams and KO from Con-fed dams expressed more MCP-1 compared to their WT Con-fed counterparts (P < 0.05, both). Plasma TNFα levels were not affected by either genotype or maternal HFD (Fig. 5f), although levels were elevated in KO from HFD-fed dams compared to WT counterparts.
Arcuate gene expression
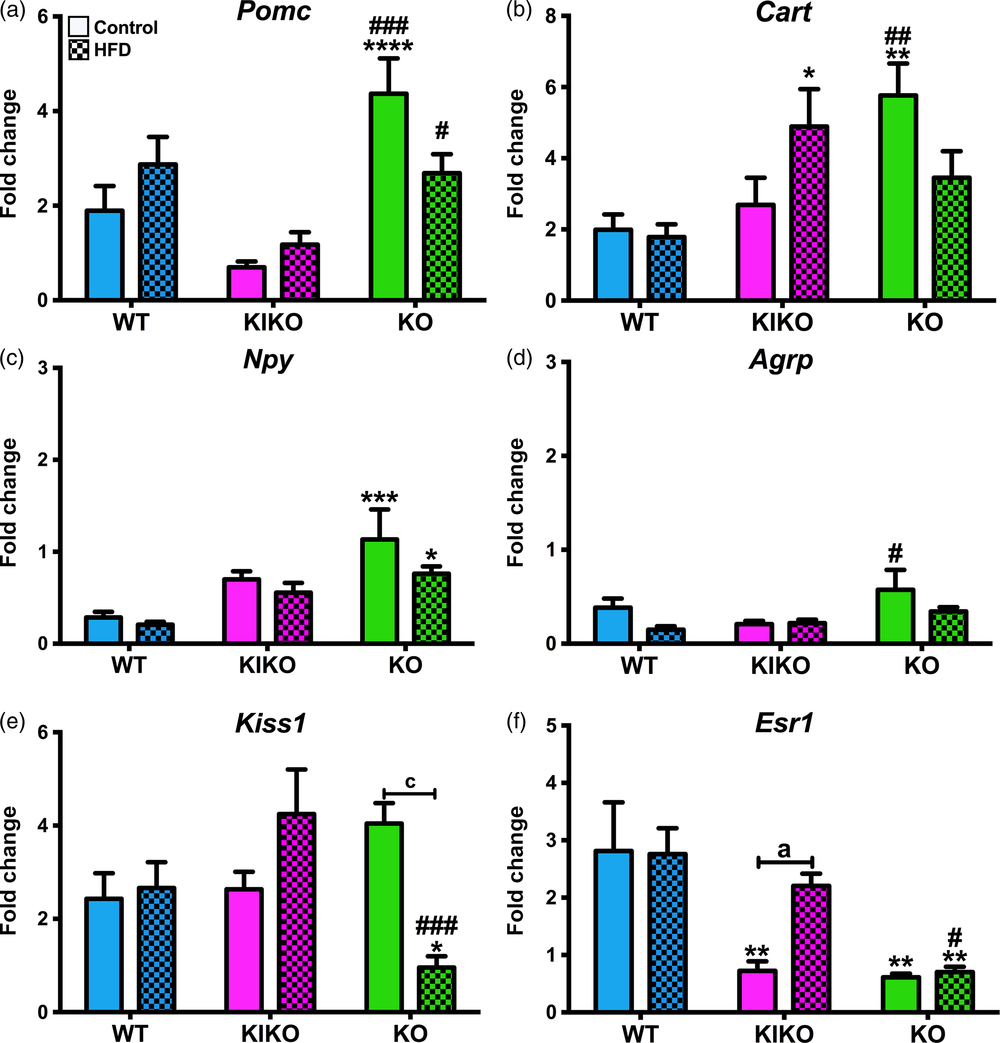
As ARC neuropeptides and hormone receptors are regulated by adult and maternal HFD,Reference Yasrebi, Rivera, Krumm, Yang and Roepke22,Reference Roepke, Yasrebi and Villalobos28,Reference Coll, Farooqi and O’Rahilly40 we analyzed their expression in each treatment group. As we previously demonstrated,Reference Roepke, Yasrebi and Villalobos28 expression in KO females is particularly sensitive to maternal HFD. Unexpectedly, maternal HFD had no effect on the expression of any arcuate neuropeptides although there were effects of genotype and an interaction of genotype and maternal diet. These results are most likely due to the influence of adult HFD on arcuate neuropeptide expression. Pomc expression was elevated in KO females compared to WT and KIKO from Con-fed and HFD-fed dams (Fig. 6a). Cart expression was higher in KIKO from HFD-fed and KO from Con-fed dams compared to their respective WT counterparts (Fig. 6b). Expression of the orexigenic neuropeptide, Npy, in KO females from both maternal diets was higher than in their WT counterparts (Fig. 6c). Agrp expression was also elevated in KO females from Con-fed dams compared to their WT counterparts (Fig. 6d). Expression of Kiss1, a gene that has dual roles in reproduction and energy homeostasis,Reference Nestor, Qiu and Padilla41,Reference Padilla, Qiu and Nestor42 was suppressed by maternal HFD in KO (P < 0.001; Fig. 6e). Kiss1 expression in KO from HFD-fed dams was lower than both WT and KIKO (P < 0.05, P < 0.001, respectively). Expression of the ERα gene, Esr1, was dependent only on genotype (Fig. 6f). Esr1 expression was augmented by maternal HFD in KIKO females (P < 0.05). Maternal HFD augmented arcuate expression of the insulin receptor (Insr) in WT (P < 0.05), which was not found in KIKO or KO (Supplemental Table S2). Arcuate expression of the leptin receptor (Lepr) was augmented by maternal HFD in KIKO (P < 0.001) and was differentially expressed between the genotypes from HFD-fed dams (Supplemental Table S2). In comparison to our previous study,Reference Roepke, Yasrebi and Villalobos28 these data suggest that adult HFD diminishes the impact of maternal HFD on arcuate gene expression, regardless of genotype.
Arcuate gene expression in all genotypes after 20 weeks of HFD. (a) Pomc; (b) Cart; (c) Npy; (d) Agrp; (e) Kiss1; and (f) Esr1 (ERα) expression normalized to WT from Control-fed dams. Con = Maternal Control Diet and HFD = Maternal HFD. Data were analyzed by a two-way ANOVA with post-hoc Newman–Keuls test within each genotype. See Fig. 1 for information on treatment categories, sample sizes, and statistical comparisons (a/*/# = P < 0.05; b/**/## = P < 0.01; c/***/### = P < 0.001; d/****/#### = P < 0.0001).

Liver gene expression
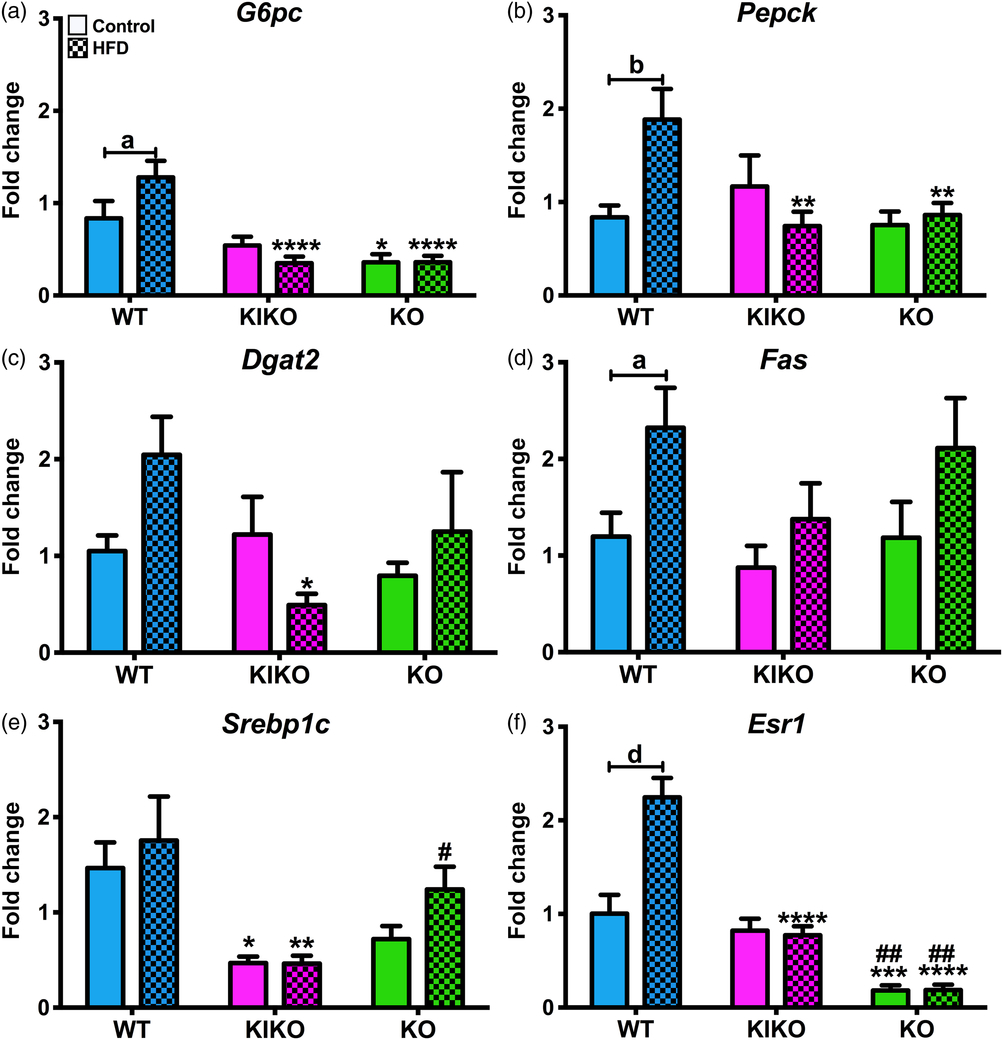
In previous study, we observed increases in liver expression of genes involved in glucose and fatty acid homeostasis due to maternal HFD only in WT.Reference Roepke, Yasrebi and Villalobos28 Similar patterns were expected in this current study as maternal HFD is known to alter these genes, regardless of adult diet.Reference Attig, Vige and Gabory43–Reference Ashino, Saito and Souza45 Indeed, glucose-6-phosphatase (G6pc) expression, which controls hepatic glucose production,Reference von Wilamowitz-Moellendorff, Hunter and Garcia-Rocha46 was elevated by maternal HFD in WT females (P < 0.05; Fig. 7a), leading to differential expression between WT, KIKO (P < 0.0001), and KO (P < 0.0001) from HFD-fed dams. Phosphoenolpyruvate carboxykinase (Pepck), which is essential for gluconeogenesis,Reference von Wilamowitz-Moellendorff, Hunter and Garcia-Rocha46 was differentially expressed between the genotypes and augmented by maternal HFD in WT (P < 0.01; Fig. 7b), again leading to differential expression between WT and KIKO (P < 0.01) and KO (P < 0.01) from HFD-fed dams. Diacylglycerol O-acyltransferase 2 (Dgat2), which is an essential enzyme in the production of triglycerides,Reference Zammit47 was not affected by genotype or maternal HFD (Fig. 7c), although KIKO females from HFD-fed dams expressed less Dgat2 than their WT counterparts (P < 0.05). Fatty acid synthase (Fas), which controls fatty acid production,Reference Leonhardt and Langhans48 was augmented by maternal HFD in WT (P < 0.05; Fig. 7d). Sterol regulatory element-binding protein 1 (Srebp1), a regulator of liver transcription for glucose, fatty acid, and lipid production,Reference Strable and Ntambi49 was not altered by maternal HFD but was differentially expressed between WT and KIKO, regardless of maternal diet (P < 0.05, P < 0.01, respectively; Fig. 7e). Esr1 expression was elevated by maternal HFD in WT females (P < 0.0001, Fig. 7f), leading to differential expression between WT and KIKO from HFD-fed dams (P < 0.0001). Maternal HFD did not alter liver Insr or Lepr expression in any genotype nor was there any genotypic differences (Supplemental Table S2), although there were differences in Lepr expression between WT from HFD-fed dams and their KIKO and KO counterparts (P < 0.05 for both). These data suggest that the expression and activity of ERα is directly impacted by maternal HFD in the liver, which may influence expression of other homeostatic liver genes.
Liver gene expression in all genotypes after 20 weeks of HFD. (a) G6pc; (b) Pepck; (c) Dgat2; (d) Fas; (e) Srebp1; and (f) Esr1 (ERα) expression normalized to WT from Control-fed dams. Con = Maternal Control Diet and HFD = Maternal HFD. Data were analyzed by a two-way ANOVA with post-hoc Newman–Keuls test within each genotype. See Fig. 1 for information on treatment categories, sample sizes, and statistical comparisons (a/*/# = P < 0.05; b/**/## = P < 0.01; c/***/### = P < 0.001; d/****/#### = P < 0.0001).

Discussion
The impact of maternal HFD or maternal obesity on offspring energy homeostasis is a potential factor in the ongoing obesity epidemic. In humans, the occurrence or risk of obesity in children or adults born to obese or overweight mothers increases with each generation.Reference Flegal, Carroll, Kit and Ogden50–Reference Sharp, Salas and Monnereau53 Transgenerational studies in rodents also suggested that a pro-obesity developmental programming occurs in offspring from obese dams or dams fed HFD.Reference Giraudo, Della-Fera and Proctor5,Reference Dunn and Bale54,Reference Massiera, Barbry and Guesnet55 However, few studies have examined the influence of sex steroids or their receptors on maternal programming. We previously demonstrated that the loss of ERα partially blocks the effects of maternal HFD on body weight and adiposity in adult female offspring.Reference Roepke, Yasrebi and Villalobos28 While the previous study focused on females fed a standard chow diet, we ran a concurrent study wherein adult female offspring were fed HFD for 20 weeks after weaning and genotype identification. Unlike the first study, we found that both KIKO and KO females from HFD-fed dams were heavier than their KIKO and KO from Con-fed dams after 20 weeks of HFD, while the WT females were not affected by maternal HFD. The increase in body weight was due, in part, by an increase in adiposity in KIKO and KO. This suggests that the influence of maternal HFD sensitizes KIKO and KO females to an obesogenic diet, or the loss of ERE-dependent, ERα signaling potentiates, instead of reduces, the influences of maternal HFD in an obesogenic environment.
One major caveat to this study is major differences in constituents between the two maternal diets. While we based our study on published reports,Reference Sun, Purcell and Terrillion31 it became apparent to us that the relative low content of phytoestrogens in the semipurified HFD compared to the standard chow breeder diet may influence our data. As discussed in our previous report on this study,Reference Roepke, Yasrebi and Villalobos28 KIKO and KO females are especially sensitive to diets low in phytoestrogens as described in an unpublished study by Flowers and colleagues (2014).Reference Flowers, Sanek and Levine56 The control maternal diet used in our study contains soy and an unknown concentration of phytoestrogens. In a 2007 study, phytoestrogens were measured at ~120 μg/g (ppt) chow (ppt) in the same diet,Reference Jensen and Ritskes-Hoitinga57 which is higher than the phytoestrogens in the HFD used in our study (Research Diets, personal communication). Likewise, the lack of phytoestrogens in both maternal and adult diet produced heavier male and female offspring at PND90 through greater adiposity and consequently higher serum leptin levels.Reference Ruhlen, Howdeshell and Mao58 In comparison with the current study using HFD with low phytoestrogens, maternal HFD did increase body fat in KIKO and KO but not WT female offspring with no effect on plasma leptin levels.
Estrogens control adipose deposition in adults by reducing lipid deposition primarily through ERα.Reference Shi, Seeley and Clegg59 Because of the increase in adiposity in the KIKO and KO females due to the interactions of maternal and adult HFD, the role of ERα in controlling adipogenesis during the developmental programming is of relevance. During development, ERα controls adipogenesis and lipogenesis also through ERα.Reference Cooke and Naaz60 Indeed, neonatal estrogen treatment in rodents reduces adiposity in male adults.Reference Goyal, Braden and Williams61 In our study, the increase in fat mass between KIKO and KO due to the interactions of adult and maternal HFD supports this role of ERα and suggests that ERE-dependent signaling is critical. This increase in adiposity was not associated with an increase in plasma leptin in KIKO and KO females. Additionally, E2 also utilizes another membrane-associated ER, GPER1, to control adiposity during DIO,Reference Wang, Luo and Moore62 which may be involved in the influence of maternal HFD on adiposity. Furthermore, maternal HFD increased adiposity in KIKO and KO without a similar increase in leptin production. These data suggest that the loss of ERE-dependent ERα augments the influence of maternal HFD on adipogenesis on an obesogenic diet, but interferes with adipokine production. Because estrogens control leptin production, in part, through ERα in females,Reference Shi, Seeley and Clegg59 the loss of ERE-dependent ERα signaling in the KIKO and KO females may interfere with the link between adiposity and leptin production, regardless of maternal HFD.
The increase in body weight in KIKO and KO females could also be due to suppression of metabolic rates and activity. In our previous study, maternal HFD altered metabolism and activity in a genotype-specific manner.Reference Roepke, Yasrebi and Villalobos28 In our current study, the main effects on metabolism were due to genotype and adult HFD with only a modest influence of maternal HFD. It is well known that adult HFD and obesity produce drastic changes to metabolism in females and that activation of ERα can ameliorate these HFD-induced metabolic changes.Reference Yasrebi, Rivera, Krumm, Yang and Roepke22,Reference Handgraaf, Riant and Fabre39,Reference Riant, Waget and Cogo63 However, these HFD-induced metabolic changes overwhelm any influence in maternal HFD as we previously reported.Reference Roepke, Yasrebi and Villalobos28 While a decrease in metabolic rates may not be directly involved in the increase in body weight and adiposity, a distinct genotypic difference in activity, both X- and Z-plane, certainly plays a role. Both KIKO and KO were less active during the nighttime than their WT counterparts, regardless of maternal diet. Furthermore, maternal HFD further reduced nighttime activity in KIKO and KO females, which contributes to body weight gain on an adult HFD. This suggests that the loss of ERE-dependent signaling during development reduced adult activity, which is another HFD-sensitizing mechanism. Deletion of ERα in selected hypothalamic neurons also produces less active female mice who respond to HFD in a similar manner as the KIKO and KO.Reference Xu, Nedungadi and Zhu64 Finally, our data are supported by studies demonstrating that maternal HFD reduces voluntary activity in HFD-fed female mice.Reference Johnson, Javurek and Painter65
Activation of ERE-independent ERα signaling in the liver is a primary pathway for the control of glucose production and insulin sensitivity by E2.Reference Yasrebi, Rivera, Krumm, Yang and Roepke22 Here, fasting glucose levels were elevated in KIKO females from HFD-fed dams compared to their counterparts from Con-fed dams. This suggests that the maintenance of glucose levels is disrupted by maternal HFD in females lacking ERE-dependent, ERα signaling, and that ERE-independent signaling is sufficient to restore normal glucose homeostasis when maternal diet or energy status is normalized. As expected, glucose clearance in KO females was delayed compared to WT and KIKO females from Con-fed dams. Consequently, the influence of maternal HFD was magnified in KO further reducing glucose clearance. These data support our previous data from adult HFD-fed females that ERE-independent signaling restores glucose clearance and protects against the influence of maternal HFD.Reference Yasrebi, Rivera, Krumm, Yang and Roepke22 This is due to the restoration of membrane-initiated ERα mechanisms in KIKO mice that regulate glucose transporter type 4 expression and insulin-induced trafficking to the membrane in skeletal muscle.Reference Jelenik and Roden66–Reference Barros and Gustafsson68
Conversely, ERE-independent signaling was not protective against the influence of maternal HFD on insulin tolerance. While KO females, regardless of maternal treatment, exhibited impaired insulin-induced glucose clearance, maternal HFD produced KIKO females that exhibited KO-like insulin tolerance. Likewise, maternal HFD increased plasma insulin in both KIKO and KO compared to WT with a five-fold increase in insulin in KO from HFD-fed dams, indicating that maternal HFD does induce hyperinsulinemia, a biomarker for type II diabetes, without ERα signaling and is more sensitive to adult HFD. While the majority of these interactions of ERα signaling, glucose, and insulin are in peripheral organs, we cannot ignore a central role of ERα signaling in controlling hepatic glucose production and insulin sensitivity.Reference Yonezawa, Wada and Matsumoto69,Reference Liu, Bisschop and Eggels70
Surprisingly, we did not find any effect of maternal HFD on any genes involved in glucose production (G6pc and Pepck) in the liver from KIKO or KO females. Rather, maternal HFD increased liver expression of G6pc and Pepck in WT females only. This elevation in expression of these gluconeogenic enzymes suggests that hepatic glucose production is elevated in WT from HFD-fed dams, which would require hyperinsulinemic–euglycemic clamp measurements, but the production is offset in the periphery by a fully functional set of signaling molecules controlling glucose clearance into skeletal muscle. Another gene found to be augmented by maternal HFD only in WT females was Fas. This suggests that the effects of maternal HFD on lipid metabolism in the liver are dependent on ERE-dependent ERα signaling, although lipid deposition was not determined in any of the groups. Future studies will evaluate maternal HFD effects on liver metabolism of fatty acids, glucose, and triglycerides. Regardless, it is apparent that the loss of ERE-dependent signaling alters the response of the liver to maternal HFD.
As with liver genes, maternal HFD increased inflammatory cytokines in WT females with a similar pattern found in KIKO females although not significant. The loss of ERE-dependent signaling eliminates that effect due to elevated inflammation in KO females, regardless of maternal diet. Low-grade, elevated inflammation is due to increased production of inflammatory cytokines by adipose tissue in obese animals and contributes to the developmental programming of maternal HFD.Reference Sanders, Kim, Glendining and Jasoni9,Reference Rother, Kuschewski and Alcazar71,Reference Grayson, Levasseur and Williams72 Thus, the response to maternal HFD in WT includes an increase in cytokine production and may be a result of excess adiposity in the HFD-fed adult females that is apparently lost in females that lack ERE-dependent ERα signaling despite increased adiposity.
While food intake or meal patterns were not measured, we did determine the ARC melanocortin neuropeptide gene profile from all groups. Many studies have shown that ARC neuropeptides are not altered by maternal HFD or obesity,Reference Giraudo, Della-Fera and Proctor5,Reference Vogt, Paeger and Hess7,Reference Gorski, Dunn-Meynell and Levin73 while other studies have demonstrated a stimulatory or suppressive effect of maternal HFD on Npy and Pomc expression.Reference Page, Malik, Ripple and Anday74–Reference Rajia, Chen and Morris76 We observed an elevation in the expression of anorexigenic neuropeptides, Pomc and Cart, in KO females that was not significantly altered by maternal HFD. Surprisingly, KO females also exhibited elevated Npy expression. This profile suggests that KO eat less than the WT or KIKO, which supports our previous data from ovariectomized adult females.Reference Mamounis, Yang, Yasrebi and Roepke36 The neuropeptide profile also suggests that food intake is not the underlying cause in the increased adiposity in KIKO and KO females from HFD-fed dams. One ARC neuropeptide not directly involved in feeding that was altered by maternal HFD was the Kiss1 gene in KO females, suggesting that kisspeptin neurons may be influenced by maternal HFD without the protection of ERα.
In our previous maternal HFD study, we observed a two- to three-fold increase in Esr1 expression in the ARC in WT and KIKO due to maternal HFD.Reference Roepke, Yasrebi and Villalobos28 These findings were supported by other work reporting an increase in hypothalamic ERα (and ERβ) protein expression in female offspring from dams fed a HFD enriched with high levels of n-6 PUFA.Reference Cabanes, De Assis, Gustafsson and Hilakivi-Clarke13 Here, maternal HFD increased ARC Esr1 expression in KIKO only, yet increased liver Esr1 expression in WT only. Collectively, these studies demonstrate that adult ERα expression is consistently influenced by maternal HFD, which may impact energy homeostasis, reproduction, and a range of hypothalamic and liver functions modulated by estrogens and ERα.
In conclusion, our current study suggests that both ERE-dependent and ERE-independent ERα signaling during development impact the influence of maternal HFD on offspring energy and glucose homeostasis. The loss of ERE-dependent signaling sensitizes female mice to an obesogenic diet through an increase in adiposity and a decrease in activity and insulin sensitivity. The effects are presumably both central and peripheral in origin, although further investigation is required. One potential mechanism is the convergence of epigenetic regulation of ERα by maternal HFD and the loss of ERα-induced epigenetic modifications during development interfering with maternal HFD. However, these data would indicate that adult diet is also relevant and may override the effects of maternal HFD. Regardless, maternal HFD differentially impacts females depending upon the availability of ERE-dependent and -independent ERα signaling.
Supplementary material
For supplementary material for this article, please visit https://doi.org/10.1017/S2040174419000515
Acknowledgements
The authors must thank Dr. Sara Campbell for the use of the EMD Millipore MAGPIX® Multiplex® System, Dr. Judith Storch for the use of the CLAMS and the EchoMRI 3-in-1 Body Composition Analyzer, and the many undergraduate students who assisted in genotyping and weighing the mice.
Author Contributions
TAR contributed to conceptualization and to methodology; TAR and AV contributed to formal analysis; AY, AV, EAK, JAY, KJM, and TAR contributed to investigation; TAR contributed to writing, review, and editing and contributed to funding acquisition and supervised the research.
Financial Support
This research was supported by funds from USDA-NIFA NJ06107 and from National Institutes of Health R00DK083457, R00DK083457-S1, and P30ES005022.
Conflicts of Interest
The authors have nothing to disclose.
Ethical standards
The authors assert that all procedures contributing to this work comply with the ethical standards of the relevant national guides on the care and use of laboratory animals Mus musculus and has been approved by the institutional committee at Rutgers University.