


1. Introduction
Life insurance companies (LICs) are an integral part of modern economies and their financial systems. As financial intermediaries, they pool significant amounts of capital obtained by collecting premiums from their policyholders, and invest this capital to support the payments dictated by the policy terms. Because of the industry’s size and pervasiveness, major financial crises have the potential to cause widespread economic distress. To mitigate this negative impact, LICs are required by various government agencies to create, enact, and follow prudent internal financial risk management policies. One such policy involves the allocation of assets, a form of diversification whereby assets are grouped by general types (e.g. stocks and bonds). The portion of the total attributed to each asset type is determined by a risk-return rubric and meets the percentage guidelines set forth by the appropriate insurance regulatory agencies.
The purpose of this paper is (1) to examine the ways in which LICs allocate their assets, and (2) to determine if these allocations have been optimal, using a performance criterion measured in terms of asset return per unit of risk. We use US LIC data to create a “typical firm” with respect to the composition of its assets, and employ the concept of downside risk in an asset pricing model context augmented by extreme value statistics and analyses. We pay special attention to equity investments because of the increasing importance of this asset to the life insurance industry’s overall asset mix, and of the constraints placed on owning this asset by various regulatory bodies, which may result in various compliance costs.
Modern risk measurement used to construct investment portfolios is typically based on the Markowitz (Reference Markowitz1952) choice of variance (or standard deviation) to be the appropriate risk metric. This risk measure is the basis of the well-known Mean-Variance Capital Asset Pricing Model (CAPM). The CAPM was developed and refined by Sharpe (Reference Sharpe1964), Lintner (Reference Lintner1965), and Mossin (Reference Mossin1966), and is the theoretical basis of the Sharpe Ratio (Sharpe, Reference Sharpe1966, Reference Sharpe1994), a widely used investment performance measure that relates mean return in excess of a risk-free rate to the standard deviation of returns.
Work by Roy (Reference Roy1952), later extended initially by Markowitz (Reference Markowitz1959) and then by Hogan & Warren (Reference Hogan and Warren1974), Bawa & Lindenberg (Reference Bawa and Lindenberg1977), Harlow & Rao (Reference Harlow and Rao1989), and others, however, provides an alternative way of thinking about risk in a portfolio contextFootnote 1 . In their perspective, risk is the potential for disaster or catastrophe as evinced by the most negative deviations from expected returns. The approach is often referred to as “safety-first”, in the sense that an investor seeks to maximise return while minimising the chance that ruinous outcomes occur. This risk is often referred to as downside or (left) tail risk, because the left tail of a probability distribution of returns is where the undesirable outcomes reside. Satchell (Reference Satchell2001) points out that defining risk in this way leads to a class of asset pricing models sometimes referred to as LPMCAPM, i.e., Lower Partial-Moment Capital Asset Pricing Model.
Although Roy’s (Reference Roy1952) work has received much less attention than the original Markowitz (Reference Markowitz1952) approach, his downside risk framework is potentially more relevant to the LIC’s asset allocation decision because, as noted by Bailey (Reference Bailey1862) over 150 years ago, of the company’s commitment to meet its periodic contractual obligations to its policyholders. We incorporate this downside risk focus using the Sortino Ratio (Sortino, Reference Sortino2001), which, as shown by Satchell (Reference Satchell2001), theoretically supports the LPMCAPM. This ratio uses portfolio returns in excess of a target rate (sometimes referred to as the desired or minimum acceptable rate) as the numerator and the square root of the second lower-partial moment of these returns as defined by the target rate as the denominator. Portfolio returns are the sum of weighted individual asset returns, with the weights determined by the asset’s value contribution to the portfolio. The second lower partial moment (SLPM) of these returns is calculated by using conditional bivariate copulas, which, collectively, are referred to as a vine copula. The optimal portfolio is the one with the largest Sortino Ratio valueFootnote 2 .
Underlying these CAPM-based performance measures is the assumption that all assets in the portfolio are able to be traded at the discretion of the investor. As pointed out by Heaton & Lucas (Reference Heaton and Lucas2000), Klos & Weber (Reference Kloss and Weber2006), and Palia et al. (Reference Palia, Qi and Wu2014), among others, this is not always the case. The risk associated with these “non-tradeable” assets is typically referred to as background risk. LICs face background risk in the sense that a portion of their assets are under the control of their policyholders (see section 2 for details). We address this issue by calculating the optimal allocation of the entire portfolio, treating the policyholder portion (separate account) as predetermined, and defining the portion of the total portfolio that is under the control of the company (general account) as the residual.
Our empirical results show that the canonical vine (C-vine) structure effectively models the multivariate dependency of bivariate copulas, with the preponderance of the bivariate copulas being Student-t. Moreover, corporate bonds drive the vine dependency structure, which is not surprising since corporate bonds are by far the largest investment class overall. Nevertheless, although equities are the second largest class overall, the optimal percentage of the assets under the direct control of the company is small, which is consistent with the actual equity allocations during our study period but much lower than the maximum percentage dictated by relevant regulations or suggested by the National Association of Insurance Commissioners (NAIC)Footnote 3 .
2. Institutional Background and Risk Environment
The products sold by modern LICs can be broadly classified into life insurance and annuities. These two products provide the policyholder with different benefits. A life insurance policy requires the purchaser to pay periodic payments (premiums) through her life, and, in turn, her estate receives a payment (benefit) at the time of her death. In contrast, an annuity contract requires the purchaser to make an upfront payment in return for receiving periodic payments until her death, or a period determined at the time of the purchase. Thus, from the perspective of the issuing LIC, the risks associated with these two types of products tend to counteract each other. The risk associated with life insurance is that the covered person dies sooner than expected, resulting in fewer premiums collected for an earlier death benefit payment. In contrast, the risk associated with annuities is that the covered person lives longer than expected, requiring additional annuity payouts be made from the same initial premium.
Managing this historical risk tradeoff has been further complicated by the emergence of variable life insurance and variable annuity products. A key feature of a variable policy is the additional investment control granted by the LIC to its policyholders, who can invest their premiums in a menu of investment options. If the investments linked to their policies perform well, then policyholders benefit by having richer death benefits or annuity payouts. A confounding risk management issue arises when the LIC offers downside protection on their variable products. This protection creates a potential liability to the company if variable product values become insufficient to meet the promised benefits. Moreover, variable product policyholders tend to invest heavily in riskier portions of the asset menu (e.g. equities) provided to them. Thus, the LIC must make risk management decisions based not only on the risk exposures that it creates but also on those exposures created by the policyholders themselves.
From an accounting perspective, the assets of the LIC are placed into either the “general” account or the “separate” account, depending on the nature of the contractual obligations they support. The general account assets support the LIC’s payouts for the fixed-payment products and other obligations. The separate account assets support the payouts on products associated with policyholder investment risk, such as variable life insurance and variable annuities. Because the policyholders of the variable products are given the ability to allocate their premiums among several investment choices, the asset allocation of the separate account reflects the aggregate investment choices of the policyholders, whereas the asset allocation of the general account reflects the LIC’s investment decisions and is exposed to the background risk produced by the policyholders’ allocations.
In Table 1 we provide the industry asset allocations for the general and separate accounts for select years starting with 1994 and ending in 2013. According to American Council of Life Insurers (ACLI) (2014), total investible assets in 2013 amounted to $6.15 trillion, with the two largest contributors being bonds (48.8%) and stocks (32.6%). In addition, of the total invested amount, the general and separate accounts accounted for $3.8 and $2.35 trillion, respectively. Thus, 61.8% of the total investible assets were in direct control of the LICs. The asset allocations within the general and separate accounts, however, were dramatically different.
Aggregate life insurance company (LIC) balance sheet investment composition.
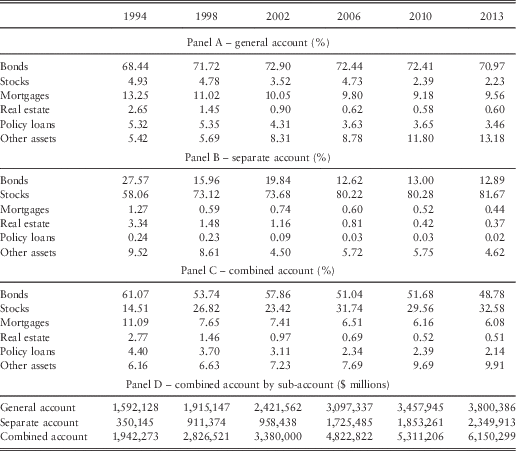
Note 1: The table shows the aggregate (combined account) balance sheet asset distribution of the US LIC’s broken down into the general account (assets directly under the control of the company) and the separate account (assets for which policyholders direct investment through certain insurance and annuity policies) for 1994, 1998, 2002, 2006, 2010, and 2013. Other Assets includes short-term investments, cash and cash equivalents, derivatives securities, and accounting assets such as premiums owed and interest earned but not yet received.
Note 2: The data are from ACLI (2005, 2007, 2009, 2011, 2013, 2014).
For example, of the total general account assets, nearly 71.0% was invested in long-term bonds (including mortgage-backed securities), an allocation that remained fairly steady over this 20-year period. Other notable asset classes include direct mortgage investments, which received about 10%, and stocks, which received only a 2.2% allocation. The stock allocation steadily declined since 1994 when it was nearly 5%. Moreover, the allocation to the other assets category increased markedly from less than 6% of the general account before 2002 to over 13% in 2013. This doubling reflects increased allocations to cash and short-term investments, derivative assets (typically used for risk hedging strategies), and non-invested assets (e.g. premiums owed and interest earned but not yet received).
In contrast to the general account, only 12.9% of the separate account assets were invested in long-term bonds in 2013, but 81.7% is invested in stocks. These allocations are markedly different than those in 1994, when the allocation associated with long-term bonds was more than double (27.6%) its 2013 allocation, and stocks received an allocation less than 60%.
Although this upward trend may be partially attributed to the downside protection offered by the LICs on many of the separate account policies, the difference in the magnitude of equity holdings between the general and separate accounts does not appear to be a result of regulatory constraints placed on the general account. In this regard, Henebry & Diamond (Reference Henebry and Diamond1998) point out that, depending on the state, the maximum portion of the general account allocated to stock ranges from 10% to 100%. Moreover, in both versions of its Investment of Insurers Model Act, NAIC (1996, 2001) suggest that stock holdings not exceed 20% of the investment portfolio.
There are at least three possible reasons why these regulatory standards do not appear to be binding. First, as Hart pointed out a half a century ago, individuals may invest in risky portfolios but they expect their standard insurance policies “… to be safe beyond question” (Reference Hart1965: 360). Thus, LICs may be simply accommodating their policyholders’ wishes. Second, in constructing their investment portfolio, the companies must also consider the risk-based capital rule that states that a company’s equity capital cannot be less than an amount prescribed by a stated formula. As discussed by Weinsier et al. (Reference Weinsier, Cataldo, Hill and Ross2002), this covariance type formula contains capital requirement factors for various types of assets. For example, the factor for stocks is 0.30 for every dollar invested, while for high grade corporate bonds the factor is 0.003. Thus, the LIC may be considering the cost of capital compliance. Finally, the seemingly low equity allocation in the general account may be the result of the LIC jointly assessing the investment risks in the general and separate accounts and constructing an investment portfolio to reflect its desired risk and reward tradeoff. It is to this issue that we now turn.
3. Measuring Life Insurer Market Performance
3.1. The Sortino Ratio
To measure the performance of the LIC asset allocation decision from a “downside risk” perspective, we use the Sortino RatioFootnote
4
. This ratio expresses the average returns (
 $$\overline{R} $$
) in excess of a target rate (R
target) per unit of downside risk (measured by the SLPM), which is also determined by the target rate. Thus, it rewards returns obtained in excess of the target rate, penalises downside volatility, and ignores upside volatility. More formally, we express the Sortino Ratio as:
 $${\rm Sortino\ Ratio}\, {\equals}\, {{\left( {\overline{R} \, {\minus}\, R_{{{\rm target}}} } \right)} \over {\left( {SLPM} \right)^{{{1 \over 2}}} }}$$
where
 $$SLPM\, {\equals}\, {1 \over T}\mathop \sum\limits_{i\, {\equals}\, 1}^T \left( {R_{{{\rm target}}} \, {\minus} \, R_{i} } \right)^{2} ,{\rm }\forall {\rm }R_{i} \leq R_{{{\rm target}}} $$
and T is the number of observations in the left tail as defined by R target Footnote 5 . SLPM measures the variability in expected shortfall, i.e., the expectation that R i is less than or equal to R target, and is associated with variance and skewness aversion.
3.2. Estimating SLPM
Three basic steps are needed to calculate SLPM: (1) estimate the extreme value distribution for each of the LIC’s asset classes, (2) combine these individual distributions to create a single multivariate distribution system, and (3) use the multivariate system to simulate a distribution of returns that empirically defines the left tail of the asset portfolio returns.
3.2.1. Univariate extreme value modelling
A generalised Pareto distribution (GPD) is often used to model the tail returns of an asset (see, e.g. Longin, Reference Longin2005; Carmona, Reference Carmona2014; Booth & Broussard, Reference Booth and Broussard2016). Tail returns are those returns below some set threshold. The threshold, also referred to as location (λ), is one of the three GPD parameters. The other parameters are scale (σ) and tail shape (τ). The threshold and shape parameters have (−∞, ∞) as their range, while the scale parameter value is non-negative. To calculate SLPM, however, R target must be less than or equal to the threshold value. The cumulative distribution function, F(R), of the GPD given return R is typically expressed as:
 $$F\left( R \right)\, {\equals}\, 1{\minus}\left[ {1{\plus}\tau \left( {{{R\, {\minus}\, \lambda } \over \sigma }} \right)} \right]^{{\, {\minus}\, {1 \over \tau }}} $$
with its corresponding probability distribution function f(R) being
 $$f\left( R \right)\, {\equals}\, {1 \over \sigma }\left[ {1{\plus}\tau \left( {{{R\, {\minus}\, \lambda } \over \sigma }} \right)} \right]^{{\, {\minus}\, \left( {{1 \over \tau }{\plus}1} \right)}} $$
3.2.2. Multivariate extreme value modelling
To model the joint probability distribution of the LIC’s multiple asset investment portfolio, we rely on Sklar’s (Reference Sklar1959) observation that if there are d random variables R 1, … , R d that have continuous cumulative distribution functions F 1, … , F d and a joint cumulative distribution function F, there exists a unique copula C such that F(R 1, … , R d )=C(F(R 1), … , F(R d )). C is a distribution function on [0, 1] d with uniform marginal distributions that permits the distribution functions of R 1, … , R d to be the functional inputs. Thus, theoretically, copulas can be used to estimate the joint probability distribution of returns for d asset classes.
Unfortunately, most of the currently known copula functions involve pairs of random variables. This poses a challenge for a joint analysis of three or more random variables. Nevertheless, work by Joe (Reference Joe1996), Bedford & Cooke (Reference Bedford and Cooke2001, Reference Bedford and Cooke2002), and Kurowicka & Cooke (Reference Kurowicka and Cooke2006), and outlined in Brechmann & Schepsmeier (Reference Brechmann and Schepsmeier2013), suggests an effective approach to skirt this limitation. These authors propose using vine copulas, which decompose a multivariate copula into a series of conditional bivariate pairs.
We base our approach on similar copula-based portfolio modelling work done by others including Brechmann & Czado (Reference Brechmann and Czado2013), Allen et al. (Reference Allen, McAleer and Singh2014), and Carmona (Reference Carmona2014). Using the Rsafd package available in R, we first estimate a two-tailed GPD model for each of the LIC asset classes in order to model their marginal distributions. A two-tailed GPD model is initially used because we employ the vine copula framework to model joint dependence between asset classes across their full distribution. We focus on the left tail at a later stage when we calculate the Sortino Ratio of prospective risky portfolios. The copula data are formed by taking the cumulative distribution function, F(R i ), for each return R in asset class i based on i’s GPD marginal distribution.
Next, we choose a conditioning path for the vine copula based on the dependence structure of assets. This approach permits selection of an appropriate bivariate copula function for each “twist” or “node” of the vine. The structure selection criteria proposed in Czado (Reference Czado2010) and Czado et al. (Reference Czado, Schepsmeier and Min2012) is used. The structure selection depends not only on the joint dependence of various bivariate pairs of the individual asset classes but also on the underlying structure of the vine copula.
There are two popular vine copulas – the canonical vine (C-vine) and drawable vine (D-vine). Graphic examples of the two vine structures are provided in Brechmann & Schepsmeier (Reference Brechmann and Schepsmeier2013: 5, fig. 1). The C-vine copula is structured so that each level of the vine (called a tree) has a single-root variable and all pairs are built on this root. In this copula, the root variable for each tree is the variable that has the greatest joint dependence across the other variables, conditioned on the earlier roots. In contrast, the D-vine copula is designed so that no single variable drives the joint dependence throughout the vine or in each tree. Instead, the aim is to determine the variable order that will maximise the joint dependence of the first tree. The later trees are naturally built based on the order of the first tree. For robustness purposes, we estimate the C-vine and D-vine copulas (using the CDVine package provided in R) and compare the results of both structures.
3.2.3. Simulating multivariate tree returns
After estimating a vine copula, we simulate returns for a typical LIC’s investable assets that reflect the joint dependence modelled in the vine copula and the GPD marginal distributions. The simulation algorithms of Aas et al. (Reference Aas, Czado, Frigessi and Bakken2009) generate samples of uniform [0, 1] data for each asset class that reflect the joint dependencies modeled by the vine copula by using their conditional distribution functions. We then treat the uniform [0, 1] data as Cumulative Distribution Function (CDF) probabilities from the corresponding asset class’s univariate GPD distribution. By applying a GPD quantile function to these simulated CDF probabilities, we produce a simulated series of returns for each asset class. To build portfolios of these returns, we use historical industry asset allocation weights as a starting point. We then vary the weights within reasonable economic limits to create our set of feasible portfolios. To compare risk-reduction tradeoffs for the simulated feasible portfolios, we estimate the Sortino Ratio for each portfolio for each set of weights.
4. Data
The historical asset allocation weights for the US life insurance industry come from the ACLI (2005, 2007, 2009, 2011, 2013, 2014), which provides the weights for 1994–2013. ACLI (2014) classifies the assets held by LICs into the following categories: US government bonds, non-US government bonds, corporate bonds, mortgage-backed bonds, common stocks, preferred stocks, farm mortgages, residential mortgages, commercial mortgages, real estate, policy loans, short-term investments, cash and cash equivalents, derivatives, other invested assets, and non-invested assets. The last two categories include assets such as premiums and investment income owed the company, but not yet received.
Detailed price data for each of the above accounts are not available on a company or industry basis. Thus, for each asset category we need a proxy variable. Suitable proxy daily data are available for US government bonds, non-US government bonds, corporate bonds, mortgage-backed bonds, common stocks, residential mortgages, commercial mortgages, short-term investments, and cash and cash equivalents. As of 2013, these assets account for nearly 84.6% of the general account, 96.5% of the separate account, and 89.2% of the combined assets of both accounts. Proxies and their sources for each of the asset classes are listed in Table 2.
Definitions, sources, and descriptive statistics of daily return data.

Note 1: Column headings correspond to an individual asset class. The point estimates for skewness and excess kurtosis are augmented with t-statistics based on the null hypothesis of zero skewness and excess kurtosis. The Ljung-Box and Lagrange Multiplier statistics are based on the null hypothesis of no linear dependence and GARCH effects, respectively. The statistics correspond to daily observations beginning 2 January 1998 through 31 October 2014.
Note 2: Asset class designations, names, return proxies, and data sources are: Trbd, US Treasury Bonds (US Treasury Composite Index); Fnbd, Non-US Treasury Bonds (Global Government Excluding the US Composite Index); Corp, Corporate Bonds (US Corporate Composite Index); Vwst, Common Stocks (CRSP Value-Weighted Index (with distributions)); Rmbs, Residential Mortgages and Mortgage Backed Bonds (US Mortgage Backed Securities Index); Cmbs, Commercial Mortgages (US Fixed Rate CMBS Index); Trbd3, Cash and Cash equivalents (US 3-Month Treasury Bill Index); Trbd6, Short-Term Investments (US 6-Month Treasury Bill Index). Except for Vwst, which is created and provided by the Center for Research in Security Prices (CRSP), all indexes are constructed by Bank of America/Merrill Lynch and extracted from Bloomberg. Cmbs has 4,234 observations over the common date range (rather than 4,236 observations as with the other variables) due to missing observations for 2 days during this time period.
For all proxies, daily log prices are calculated based on index values, and then log returns are calculated by taking first differences of the log prices. Descriptive statistics of these proxies are also given in Table 2. The table includes statistics for each listed proxy for a common date range available to all variables, i.e., 2 January 1998 to 31 October 2014Footnote 6 . The mean daily return, minimum daily return, and maximum daily return statistics are in percentage terms. Except for Trbd6 significant skewness is exhibited. Positive skewness is associated with Fnbd, Rmbs, and Trbd3, but Trbd, Corp, Vwst, and Cmbs are negatively skewed. As indicated by their significant excess kurtosis, all asset classes are “heavy-tailed.” GARCH effects also are exhibited.
5. Copula Analysis
To model the joint distribution of the asset classes, we first model the marginal distribution of each asset using a two-tailed GPD model. We balance tail size and parameter estimation by selecting various tail sizes ranging between 1% and 12% of the observations and select “best-fit” estimations via examining Q-Q plotsFootnote 7 . Table 3 contains the estimated parameters of the two-tailed GPD marginal distributions for the individual asset classes. Again, it is apparent that equities contain a significant amount of tail risk for life insurers. As a class, they are heavy-tailed and exhibit high volatility estimates. Fixed income assets, on the other hand, vary with respect to tail thickness and volatility, but corporate bonds are characterised by non-existent tail and low volatility estimates. These marginal distributions are then transformed into cumulative distribution functions to produce the information needed to construct the vine copulas.
Generalised Pareto distribution (GPD) marginal distribution estimation for vine copulas.

Note: The table contains the GPD parameter estimates for each includible asset class. For each asset class, the lower tail threshold is based on the observation value corresponding to the observation number in the range between 1% and 12% of available variable data. The upper tail threshold is set equal to the lower tail threshold value but with the opposite sign. The threshold is denoted by λ, the tail shape by τ, and the scale by σ. The subscript on each parameter indicates whether the estimate is for the lower (l) or upper (u) tail. Cmbs has 4,234 observations over the common date range (rather than 4,236 observations as with the other variables) due to missing observations for 2 days during this time period. This common date range is used for the copula analysis.
For a C-vine copula, we must select the root variable for each tree of the vine. We accomplish this using the absolute values of the Kendall’s tau estimates of the dependence between each pair of variables in the tree. Corporate bonds are chosen to be the root variable of the first tree because this asset class has a higher sum of the Kendall’s tau estimates than any other asset class. These dependencies, now conditional on corporate bond returns, are calculated anew among the remaining seven asset classes for the second tree in the vine. Again, the asset class with the highest aggregate joint dependency is chosen to be the root variable for the second tree. This process repeats itself until the root variables for all of the trees are chosen. The order of these root variables is Corp, Trbd6, Rmbs, Trbd, Cmbs, Fnbd, and Trbd3 and Vwst sharing equally in the final tree.
For a D-vine copula, we again make use of the Kendall’s tau estimates. However, the basic structure of the vine is different, and we seek the order that produces the maximum aggregate joint dependence. Instead of having each non-root variable paired with the root variable, each variable is paired with only the variable immediately preceding and following it in the order. With eight asset classes, we have 8!, or 40,320, possible orders for the first tree. Setting up all of the possible ordering schemes and using the Kendall’s τ estimates for each pair allows us to find the order with the highest aggregate joint dependence. As before, we use the absolute value of each estimate when taking the sum across all of the pairs in the ordering scheme. This produces an optimal D-vine copula order of Trbd3, Trbd6, Fnbd, Cmbs, Rmbs, Corp, Trbd, and Vwst.
After choosing an appropriate vine copula structure, we select the appropriate copula function for each bivariate pair in the vine and estimate the corresponding parameters of the chosen bivariate copula. The copula selection and estimation results for the C-vine and D-vine copulas are presented in Tables 4 and 5, respectively. Each table shows the asset return pairs for each tree, the relevant conditioning returns, and the name of the selected distribution. Both vines contain seven trees and 28 variable pairs. Of the 28 C-vine (D-vine) copula pairs 60.7% (57.1%) are labelled Student-t (T), 17.9% (25.0%) are independent (I), and 7.1% (7.1%) are Frank (F). The remaining four C-vine copula pairs are classified as Gaussian (N), Survival Gumble (SG), Survival Joe (SJ), or Joe-Frank two-parameter Archimedean (BB8) copulas. The remaining three D-vine copulas are the Joe-Frank two-parameter Archimedean (BB8), Rotated Joe-Frank two-factor Archimedean (RBB8), and the Survival Joe-Frank two factor Archimedean (SBB7) copulas.
C-vine copula selection and estimation.

Note: The table contains the copula selection and parameter estimates for each bivariate pair in the C-vine copula of a life insurance company’s includible asset classes. Variable 1 contains the root variable for each respective tree in the vine. Conditioning set contains the root variables from earlier trees that are now conditioned on when estimating the current tree. The entries in Copula indicate the copula function chosen where “I” denotes the independence copula, “N” denotes the Gaussian copula, “T” denotes the Student-t copula, “F” denotes the Frank copula, “BB8” denotes the Joe-Frank two-parameter Archimedean copula, “SG” denotes the survival version of the Gumbel copula, and “SJ” denotes the survival version of the Joe copula. For the Gaussian and Student-t copulas, Parameter 1 is a dependence parameter ρ∈(−1, 1). For the Student-t copula, Parameter 2 is a degrees of freedom parameter ν>2. For the one-parameter Archimedean copulas, Parameter 1 is θ≥1 (for Gumbel),
 $\theta \in{\Bbb R}$
\{0} (for Frank), or θ>1 (for Joe). For the two-parameter Archimedean copulas, the dependence is governed by two parameters, which are θ≥1 and δ∈(0, 1] for the BB8 copula.
D-vine copula selection and estimation.

Note: The table contains the copula selection and parameter estimates for each bivariate pair in the D-vine copula of a life insurance company’s includible asset classes. The entries in Copula indicate the copula function chosen where “I” denotes the independence copula, “T” denotes the Student-t copula, “F” denotes the Frank copula, “BB8” denotes the Joe-Frank two-parameter Archimedean copula, “SBB7” denotes the survival version of the Joe-Clayton two-parameter Archimedean copula, and “RBB8” denotes the 270° rotated version of the BB8 copula. For the Student-t copula, Parameter 1 is a dependence parameter ρ∈(−1, 1) and Parameter 2 is a degrees of freedom parameter ν>2. For the Frank one-parameter Archimedean copula, Parameter 1 is
 $\theta \in{\Bbb R}$
\{0}. For the two-parameter Archimedean copulas, the dependence is governed by two parameters, which are θ≥1 and δ>0 for the SBB7 copula and θ≥1 and δ∈(0, 1] for the BB8 copula. The 270° rotated versions of the Archimedean copulas allow for negative dependence and have parameter spaces with the opposite sign, i.e., θ≤−1 and δ∈[−1, 0) for the RBB8 copula.
To address the question of whether the C-vine or D-vine structure model better fits the underlying data, we use the likelihood ratio-based tests proposed by Vuong (Reference Vuong1989) and Clarke (Reference Clarke2007) and summarised by Brechmann & Schepsmeier (Reference Brechmann and Schepsmeier2013). Both of these are based on ratios of the competing vine copula densities and reject the null hypothesis that the two densities are similar if the ratios are sufficiently large. Table 6, Panel A contains the calculated values of the test statistics and p-values for both tests. The Vuong test suggests that the null hypothesis of statistical indistinguishability cannot be rejected. In contrast, the Clarke test supports the supposition that the C-vine model is a better fit. After correcting for the number of parameters using the Akaike and Schwarz procedures, both tests provide the same qualitative conclusions.
Vuong and Clarke tests comparing three vine copula models.

Note: The table contains the test statistics and p-values for the Vuong (Reference Vuong1989) and Clarke (Reference Clarke2007) tests on the statistical indistinguishability of our estimated C-vine and D-vine copula models. Both tests are based on the log-likelihood ratios of the competing vine copula densities c
1 (for C-vine) and c
2 (for D-vine) and reject the null hypothesis of indistinguishability if the ratios are sufficiently large across our data set. To do so, we calculate the log difference
 $m_{i} \, {\equals}\, \log \left( {c_{1} \left( {u_{{i,1}} ,u_{{i,2}} \mid \hat{\theta }_{1} } \right)} \right)\, {\minus}\, \log \left( {c_{2} \left( {u_{{i,1}} ,u_{{i,2}} \mid\hat{\theta }_{2} } \right)} \right)$
for observations u
i,j
and estimated parameters
 $\hat{\theta }_{j} $
, i=1, … , N and j=1, 2. The test statistic for the Vuong test is the standardised sum of m
i
, which is asymptotically standard normal. For the Clarke test, the test statistic is the sum of m
i
, given that m
i
is strictly positive, which is asymptotically binomial.
Because of the large percentage of Student-t copula pairs, we redo the C-vine analysis modelling all copula pairs as a Student-t distribution. The results of this estimation are given in Table 7. Two of the copula pairs are designated as Gaussian and not Student-t. This is because when the Student-t degrees of freedom are reasonably large, a Gaussian distribution is a good proxy for it and the overall vine calculation is simplified by making this substitution. As shown in Table 6, Panel B, the uncorrected and Akaike corrected Vuong tests indicate that the notion that the Student-t C-vine model is a better fit than the original C-vine model cannot be rejected. However, the uncorrected and corrected Clarke and the Schwarz corrected Vuong tests indicate that the null hypotheses that both C-vine versions explain the data equally well cannot be rejected. Thus, we continue our analysis using both the C-vine pairing results, which are displayed in Tables 4 and 7.
Student-t C-Vine copula selection and estimation.

Note: The table contains the copula selection and parameter estimates for each bivariate pair in the C-vine copula of a life insurance company’s includible asset classes. Variable 1 contains the root variable for each respective tree in the vine. Conditioning set contains the root variables from earlier trees that are now conditioned on when estimating the current tree. The entries in Copula indicate the copula function chosen where “T” denotes the Student-t copula and “N” denotes the Gaussian copula. For both copulas, Parameter 1 is a dependence parameter ρ∈(−1, 1). For the Student-t copula, Parameter 2 is a degrees of freedom parameter ν>2.
6. General Account Optimal and Actual Equity Allocations
For each of the C-vine constructs, we empirically assess the efficacy of the typical LIC’s equity allocation policies by creating stylised asset portfolios for 1994, 1998, 2002, 2006, 2010, and 2013, each of which reflects the industry balance sheet for the reference year. For each of these years we use the Sortino Ratio to determine the portfolio that provides the best performance. We then compare the equity allocation of these top-performing portfolios to appropriate benchmarks.
To arrive at these comparisons, several steps must be taken. First, using the GPD and the two C-vine copula estimates, we simulate 10,000 daily returns for each asset class. Second, we determine a feasible set of combined (general and separate) account weights for each of the years. The general account weights are choice variables for the LIC. In contrast, the separate account weights are predetermined because they reflect investment decisions made directly by policyholders. As explained in section 4, because we lack data for assets such as policy loans and other assets, the weights used in the analysis are slightly different than those derived directly from the various ACLI Fact Books. After excluding those missing asset classes, we normalise the weights for the remaining asset classes so that they sum to one. For our data period, the includible asset classes always account for at least 85% of the general account assets. Third, we construct 26 portfolios where the general account equity allocation ranges from 0% to 5% in 20 basis point intervals. This range reflects the actual weights that have been chosen by LICs and does not violate any of the asset allocation regulatory constraints. Fourth, for each portfolio formed, we calculate the Sortino Ratio for that portfolio’s left tail containing 248 observations, which is 5.85% of the total number of simulated returns and approximately equal to the midpoint of the tail sizes considered. The optimal combined account equity allocation for each year is determined by that year’s maximum Sortino Ratio value. Finally, we repeat this protocol 100 times and calculate the mean and standard deviation of optimal equity allocations.
The optimal allocation results are displayed in Table 8. Panel A presents the two sets of mean C-vine optimal general account equity allocations. For both sets, we calculate the optimal general account equity allocation using the optimal allocation of the combined account, the equity allocation in the separate account, and the total values of the general and combined accounts. The last three variables are predetermined so that a change in a combined account allocation is fully reflected in the general account allocation. Panels B and C contain similar information for the separate and combined accounts, respectively.
Optimal and actual equity allocations.

Note 1: The table contains life insurance company general, separate, and combined account equity allocations of the includible asset classes for selected years. The vine optimal equity allocations are derived from the optimal allocations of the combined account, the equity allocation in the separate account, and the total values of the general and combined accounts. The C-vine entries are the means and standard deviations of simulations. For comparison, the corresponding, the hyperplane analysis, and actual industry allocation values are provided. Note that the actual allocations may be somewhat different from those presented in Table 1 because this table excludes asset classes for which suitable proxy data sources were not available (see section 4).
As shown in Panel A, the C-vine equity allocation for the general account ranges from 0.65% to 1.32%, with a mean of 1.08%, and the corresponding Student-t C-vine range is 0.27% to 1.43%, with a mean of 0.85%. Neither range exhibits a discernable time trend. The mean difference in the means of the two optimal allocation measures is 0.23%. If the 1994 value is omitted, the mean difference declines to 0.08%, which is smaller than the 20 basis point measurement interval, and there is no significant difference in yearly means. For 1998 through 2013, the t-test for difference in means p-value ranges from 0.176 to 0.831. For 1994, however, the p-value is less than 10−7, which indicates that after the Bonferroni correction, the hypothesis that as a group the mean differences are equal is rejected at any reasonable level of significance. This rejection is confirmed by the MANOVA Pillai test (p-value is 6.93×10⁻¹⁰).
As demonstrated above, the calculated vine equity allocation values assume that asset returns are unknown but that their stochastic processes are measurable. Thus, it is instructive to compare these allocation values to those calculated when the relevant asset returns are known. To determine the optimal equity allocation under this scenario, we follow Booth & Broussard (Reference Booth and Broussard2016) and use the returns for all the assets under consideration to construct numerous portfolios using various portfolio weights. This creates a risk-return hyperplane, which condenses to an equity allocation versus portfolio return plane. We fit a GPD to the left tail of each prospective portfolio’s return distribution and use the GPD to calculate the Sortino Ratio for each portfolio. As before, we declare the portfolio with the highest Sortino Ratio value to be optimal. We report the corresponding optimum equity allocation for the six sample years in Panels A and C. The mean equity allocation is 3.23% and ranges from 1.40% to 4.60%. These hyperplane percentages are noticeably higher than the vine results, but, similar to the vine equity allocation, there is no discernable time pattern.
It is also meaningful to compare all of the calculated equity allocation values to the insurance industry actual allocation values. The actual mean value is 3.40%, but in contrast to the other allocation measures, the actual allocation decreased from 5.04% in 1994 to 2.37% in 2013, with noticeable decreases occurring following major stock market declines (Panel A). It is noteworthy that during the same time period, the separate account equity allocation increased from 66.64% to 84.81%, nearly 18 percentage points, with the allocation being relatively constant from 1998 onward (Panel B). This substantial shift in equity allocation is reflected in the annual combined account allocation data (Panel C).
7. Concluding Remarks
In this study, we use uni- and multivariate extreme value statistical methods to model and measure the downside market risk contained in a typical LIC investment portfolio. Our purpose is to provide insights into their historical optimal asset allocation choices. These companies are particularly prone to this type risk of because of the guarantees they provide on their products. Our theoretical underpinning is the LPMCAPM, which ensures that the allocation choices reflect the safety-first objective. We also incorporate the notion of background risk since the allocation decisions are jointly determined by the LIC and its policyholdersFootnote 8 .
Our analyses provide two key economic results. First, we confirm that equity is a major LIC investment class. Nevertheless, in the years covered by the study, we find that the industry’s allocation to equities in the general account decreased, which mirrors the corresponding increase of equities in the separate account. This decrease is especially noteworthy because of the ability to manage equity risks through strategies other than asset allocation (e.g. hedging). Second, the extreme value performance results indicate that general account equity allocation should be less than 2% when the corresponding separate account allocation is around 80%. In the last year of our sample, 2013, the average industry allocation was close to this statistical recommendation, but was far smaller than the maximum mandated by state laws and the limit suggested by NAIC. Taken together the last two results indicate that, as a whole, the life insurance industry is acting as if safety first is an important objective.
Overall, our results suggest that the life insurance industry has recognised the risk implications of their policyholders’ move to variable life insurance and annuity products and in response, have gradually adjusted their general account asset allocations to better weather the difficulties caused by potential extreme decreases in the value of their equity investments. Nevertheless, they also indicate that the industry’s ability to use the general account in this manner is constrained on the downside. This constraint is immutable and may require the industry to create new types of risk management strategies, or consider limiting or modifying separate account product offerings if its overall equity investments continue to grow. More generally, our study highlights the potential complications of making optimal asset allocation decisions for investors that have their risk exposure partially determined by the asset allocation decisions of others.
Acknowledgements
The authors thank the participants at the Concluding International “RARE” Conference on Risk Analysis, Ruin theory & Extremes (La Baule, France), the seminar participants at University of Turku (Finland) and University of Vaasa (Finland), and an anonymous referee of this journal for helpful comments on earlier versions of this paper. J. P. B. was Fulbright Distinguished Chair in Business and Economics – Hanken when this work was completed. J. P. Broussard acknowledges the generous support from Hanken and Fulbright Finland. Opinions expressed herein are the author’s only and do not necessarily represent the views or opinions of Jackson National Life Insurance Company.



