

Introduction
Brachymystax lenok is a rare fish in China belonging to the Salmonidae family. They are widely distributed in the Wusulijiang River, the Yalujiang River, the Songhua River and the Nen River in the northeast of China (Li, Reference Li1984; Dong et al., Reference Dong, Liu and Zhang1997; Xu, Reference Xu2006). In recent years, as a result of an increase in demand, over-exploitation of fish stocks, environmental pollution and the introduction of alien species, B. lenok has been in danger of extinction (Wang, Reference Wang1998; Mou et al., Reference Mou, Liu and Xu2006). In 1998, B. lenok was included in the China Red Data Book of Endangered Animals, which aims to raise awareness regarding the protection of endangered species (Wang, Reference Wang1998). To protect B. lenok populations, many scholars have carried out studies on their physiological and biochemical characteristics and taxonomy (Dong et al., Reference Dong, Liu and Zhang1997; Liu et al., Reference Liu, Cao and Zhang2000; Xia et al., Reference Xia, Sheng and Chen2006; Ma et al., Reference Ma and Jiang2007). At present, the aim is to understand the genetic diversity of wild resources and research technology for their artificial reproduction (Song et al., Reference Song, Song, Yue and Zheng2006).
When the pressure of the environment in which a species lives surpasses the limits of its plasticity, wild species must have a certain amount of genetic diversity available in order to survive, and only by protecting the genetic diversity of a species will it be possible to change its status as an endangered species (Hedrick et al., Reference Hedrick, Dowling, Minckley, Tibbets, Demarais and Marsh2000). It is therefore essential to provide long-term protection for a species by understanding the genetic diversity of the species (Hamrick et al., Reference Hamrick, Godt, Murawski, Loveless, Falk and Holsinger1991). Amplified fragment length polymorphism (AFLP) technology is able to provide a large amount of genetic diversity information with accuracy (Keiper and McConchie, Reference Keiper and McConchie2000).
In this study, AFLP technology was used to analyse the genetic diversity of wild B. lenok from the Mudanjiang River (MD), the Yalujiang River (YL) and the Wusulijiang River (WSL), in order to explore the relationships of the genetic diversities of B. lenok populations from different rivers, at the molecular level. The research results will be helpful in establishing germplasm standards, artificial selection processes and healthy cultivation methods. They will also provide the basic information for the construction of a genetic linkage map and means for the molecular markers-assisted selection of B. lenok.
Materials and methods
Sample collection
The Lenok populations of the MD, YL and WSL rivers were collected from the Bohai coldwater fish experimental station of Heilongjiang River Fishery Research Institute at the Chinese Academy of Fishery Science. Twenty-four fin tissues were stored in anhydrous ethanol immediately after collection from every group in a random manner.
DNA extraction
Total DNA was extracted from ~30 mg fin tissues from three populations using proteinase-K digestion and the phenol–chloroform–isoamyl alcohol method, with slight modifications (Sambrook and Russell, Reference Sambrook and Russell2002). DNA concentration was measured with an ultraviolet (UV) spectrophotometer, and the quality of extracted DNA was assessed using 1.0% agarose gel electrophoresis with GoldView® (SBS, Beijing, China).
AFLP reactions
AFLP analysis was performed as described by Zabeau and Vos (Reference Zabeau and Vos1993), with some modifications. Fingerprint patterns were visualized on a 5% non-denaturing polyacrylamide gel using the silver staining method. DNA templates for AFLP reactions were generated by restriction digestion and ligation.
Initially, ~100 ng genetic DNA was digested for 4 h at 37°C with 5 U of EcoR I (with the restriction sites G/AATTC; Promega, USA) in a 10 μl reaction system with 1 μl 10× H buffer and 0.1 μl bovine serum albumin (BSA; 10 ng/μl). It was then digested for another 4 h at 68°C with 5U of Tru9 I (with the restriction sites T/TAA; Promega, USA) in 7.4 μl distilled water, 2 μl 10× F buffer and 0.15 μl BSA (10 ng/μl). Digested DNA fragments were dissolved in 10 μl 0.1× Tris EDTA buffer (TE) separately, then extracted using the phenol–chloroform–isoamyl alcohol method, ethanol precipitation and dried at room temperature.
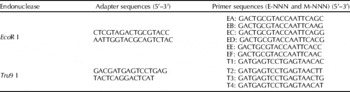
The preparation of ligated adapters was carried out by mixing 5 pmol/μl of EcoR I and 50 pmol/μl of Tru9 I adapters (Table 1), denaturing for 10 min at 95°C, chilling to 10°C for 4 h, then the formation of the final double-stranded adapters. The digested DNA fragments were then ligated with EcoR I and Tru9 I adapters in a 20 μl reaction mixture containing 5 μl DNA fragments, 1 μl Tru9 I adapter, 1 μl EcoR I adapter and 0.1 U T4 DNA ligase (MBI, USA) at 22°C for 4 h.
Sequences of adapters and primers for AFLP analysis

Pre-amplification polymerase chain reactions (PCR) were carried out using a pair of primers containing single selective nucleotides (E+A: 5′-GAC TGC GTA CCA ATT C+A-3′; T+C: 5′-GAG AGT CCT GAG TAA+C-3′). Amplification was performed in a 25 μl reaction system containing 1 μl ligated product, 200 μM dNTPs, E+A primer and C+A primer (10 μM), each of 0.5 μM, 2.5 μl of 10× buffer and 1.5 U Taq DNA polymerase. The amplification protocol comprised one cycle of pre-denaturation for 4 min at 94°C, followed by 30 cycles of 30 s at 94°C, 30 s at 56°C and 2 min at 72°C, with a final extension of 10 min at 72°C.
After initial screening, 12 pairs of primers (Table 1) were selected randomly from 64 pairs of AFLP. EcoR I primers were designated with letters from A to I, and Tru9 I primers were designated with numbers from 1 to 8. Primer combinations were designated by letters and numbers with the EcoR I primer first (for example, the E-AGC/M-CAC primer combination was identified as A1).
According to Table 1, A1, B1, B3, C1, C3, D1, D4, E1, E4, F1, F2 and F3 were selected in this study. Amplification was performed using a 25 μl mixture containing 3 μl pre-amplification product, 200 μM dNTPs, E+A primer and C+A primer (10 μM), each of 0.5 μM, 2.5 μl of 10× buffer and 1.5 U Taq DNA polymerase. The amplification protocol was 2 min at 72°C, one cycle of pre-denaturation for 2 min at 94°C, followed by 13 cycles of 30 s at 94°C, 30 s at annealing temperature and 90 s at 72°C. The temperature was then reduced in intervals of 0.7°C from 64 to 55.9°C, followed by 25 cycles of 30 s at 94°C, 30 s at 56°C and 90 s at 72°C, and a final extension of 10 min at 72°C.
Electrophoresis and silver staining
The PCR products were mixed with 5 μl loading buffer and electrophoresis was carried out at 180 V for 16–20 h using a 10% non-denaturing polyacrylamide gel. The gel was then silver stained and the image scanned for data analysis.
Data analysis
The bands were scored for presence (1) or absence (0), and transformed into a 0/1 binary character matrix. Fragments that could not be scored unambiguously were excluded from the analysis. Gel-Pro Analyzer 4.5 software (GDS8000, Vilber Lourmat, France) was used to analyse the AFLP and calculate the total number of loci and polymorphic loci. The populations were assumed to be in Hardy–Weinberg equilibrium, and PopGene 3.2 software (Yeh and Boyle, Reference Yeh and Boyle1997) was used to calculate the observed number of alleles, the effective number of alleles, Nei's diversity index and Shannon indices. Based on the formula D=1−S, PHYLIP 3.6 (University of Washington) software was used to determine genetic distances with 1000 bootstrap analyses in our proof-of-concept trial and the genetic distance matrix constructed. The phylogenetic tree was then inferred with MEGA software (Tamura et al., Reference Tamura, Dudley, Nei and Kumar2007). The population structure, gene flow index N m, average inbreeding coefficient F st and its variation source (variation among and within populations) were evaluated with an analysis of molecular variance (AMOVA; Zhang and Ge, Reference Zhang and Ge2002).
The genetic diversity among the populations was calculated using the relation D st=H t−H s, and the coefficient of gene differentiation with G st=D st/H t, where H t is the total genetic diversity of the populations and H s is the genetic diversity within the populations.
Results
AFLP polymorphism
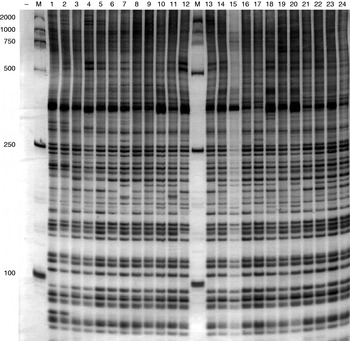
The percentage of polymorphic loci was very high across the populations. With 12 pairs of selective amplification primers, 559 loci including 541 polymorphism loci were obtained from three populations. The percentage of polymorphism reached 96.78%. There were some differences between primers, with an average of 47 amplification loci. A1 (E-AGC/T-CAC; primer combination EcoR I and Tru9 I) had the fewest loci (36), and B1 (E-AAG/T-CAC) had the most (57 loci). The amplification fragments were mainly distributed between 100 bp and 600 bp. It can be seen from Fig. 1 that the selected primers had good amplification and polymorphism.
Polyacrylamide gel electrophoresis (PAGE) data for primer D4. Lanes: 1–24, samples; M, DNA marker DL2000.

The percentages of polymorphic loci presented some differences. The population with the lowest value of polymorphism (33.39%) was the WSL population, with values of 67.80% in the MD population and 55.81% in the YL population.
Genetic structure and genetic diversity of populations
The results were gathered using the 0/1 matrix of the PopGene 3.2 software. It can be seen from Table 2 that the significant test of genetic diversity index H was 0.3040 (P>0.05), showing that there were no differences among the three populations in terms of genetic diversity.
The genetic structure of the Mudanjiang (MD), Yalujiang (YL) and Wusulijiang (WSL) river populations

The average observed number of alleles, effective number of alleles, Nei's gene diversity and Shannon index had the same trends: MD>YL>WSL; Shannon index>Nei's gene diversity index.
The genetic variation of the different sources was analysed using Nei's molecular genetics evolution method. The results showed that the total genetic diversity (H t) was 0.3512±0.0208, and the genetic diversity within populations (H s) was 0.2137±0.0152. The genetic diversity (D st) among the populations was 0.1375 and the coefficient of gene differentiation (G st) was 0.3914. Most variance was observed to occur within populations (60.85%), whereas the variance among populations was only 39.15%. The gene flow index N m was 0.7776, suggesting some gene flow within the three populations.
Genetic similarity and genetic distance
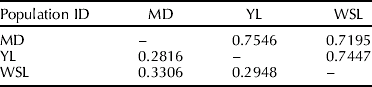
The genetic similarity within the three populations was 0.7396±0.0181 and the genetic distance was 0.3023±0.0254. It can be seen from Table 3 that the average genetic distance between the MD and YL populations (0.7546) was the highest, followed by the distance between the YL and WSL populations (0.7447). The average genetic distance between the MD and WSL populations (0.7195) was the lowest. The highest and the lowest genetic distances were 0.3306 (between the MD and WSL populations) and 0.2816 (between the MD and YL populations), respectively.
Genetic comparability and distance among the three populations from the Mudanjiang (MD), Yalujiang (YL) and Wusulijiang (WSL) rivers
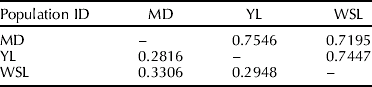
Nei's genetic identity is above the diagonal and genetic distance is below.
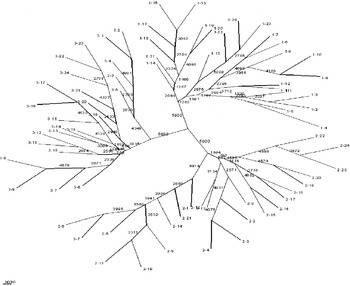
Using the UPGMA method, the populations' phylogenetic tree was constructed with MEGA software (Fig. 2). It can be seen from Fig. 2 that the MD, WSL and YL populations had their own bifurcations, and there was significant sub-bifurcation in the MD and WSL populations.
Individuals clustering of MD(1-), YL(2-) and WSL(3-) by UPGMA method according to their genetic distances.

Analysis of molecular variance
The source of genetic diversity within the three populations was analysed using AMOVA (Zhang and Ge, Reference Zhang and Ge2002). It can be seen from Table 4 that most variance was observed to occur among populations (55.16%), whereas variance within populations was only 44.84%. The expected heterozygosity (P<0.05) was 0.3512±0.1428. The average gene diversity was 0.2381±0.1180.
AMOVA analysis of the Mudanjiang (MD), Yalujiang (YL) and Wusulijiang (WSL) river populations

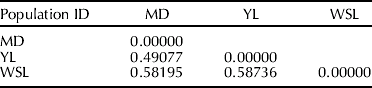
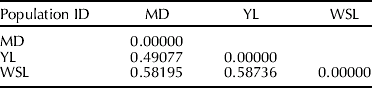
The average fixation index (F st) within the three populations was 0.55159 (Table 5). The largest F st was 0.58736 (between the YL and WSL populations) and the smallest 0.49077 (between the YL and MD populations).
Population pairwise F st indices
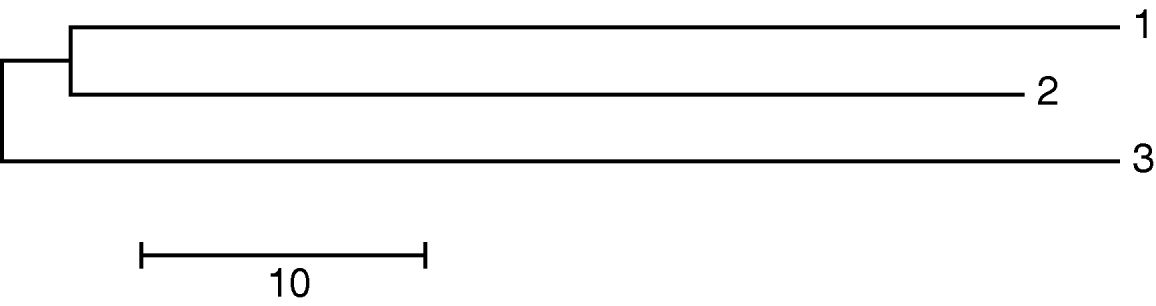
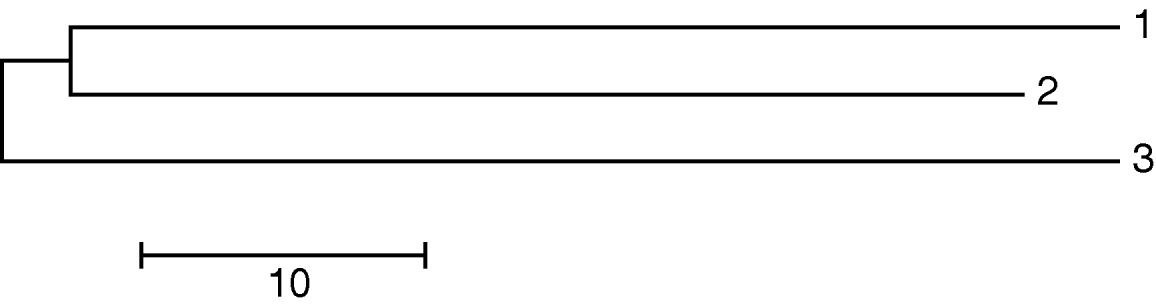
Divergence times allowing for unequal population sizes (τ) (Gaggiotti and Excoffier, Reference Gaggiotti and Excoffier2000) were the lowest between the MD and YL populations (70.4518) and highest between the YL and WSL populations (75.3312). This indicates that the MD and WSL populations diferentiated earlier than the MD and YL populations (Fig. 3).
Divergence times allowing for three unequal population sizes. (1, MD; 2, YL; 3, WSL.)
Discussion
Genetic diversities
Molecular markers are useful tools in the assessment of genetic diversity. In this paper, the genetic diversities of 72 individuals from three wild populations of the MD, YL and WSL rivers were analysed by the percentage of polymorphic loci, genetic comparability and distance, average Shannon information index and AMOVA analysis using AFLP markers. The results show that the percentage of polymorphic loci of the three populations was 96.78% and that the percentages for the MD, YL and WSL populations were 67.80%, 55.81% and 37.39%, respectively. Genetic comparability among the three populations was moderate polymorphic. This demonstrates that genetic diversity is also high, as well as stable to some extent, in the three populations. The expected heterozygosity of the population was 0.35123±0.14275 (P<0.05), in accordance with the Hardy–Weinberg principle. At present, the effect of human activities on genetic diversity is very severe, so it is necessary to take action in order to conserve the genetic quality of the populations.
Consanguinity comparison among the three populations
Thorp (Reference Thorp1982) has indicated that the genetic comparability (GC) of different species is between 0.2 and 0.8 (D s=0.2–0.8), in the same family and genus it is 0.1–0.5 (D s=0.5–0.9), and in the same population it is 0.8–0.97 (D s=0.03–0.2). In this study, the GC of the three populations was between 0.7195 and 0.7546 (D s=0.2816–0.3306), which was lower than that of the same population, whereas D s was higher than that of the same population. The results suggest that the genetic diversity of these three populations is quite high. However, this may be a result of the manner of classification of blunt-snouted and sharp-snouted Lenok. It has been reported that there is a significant difference in the genetic diversity and genetic relationship of B. lenok and B. tumensis, which is related to their morphological differences. In this study, samples were collected from different river basins with no classification into blunt-snouted and sharp-snouted Lenok individuals. This may be a factor in finding lower genetic comparability and requires further study.
Population structure and gene flow
Genetic distances among populations were calculated using Nei's genetic method (Nei, Reference Nei1987). This showed that the genetic diversity among populations (H s) was higher than that within populations (D st). This result indicates that genetic variation existed mainly within populations, in accordance with the results from AMOVA (the genetic variation within populations (55.16%) was higher than that among populations (44.84%)). The genetic distance and differentiation time presented the same trend within the three populations.
Wright (Reference Wright1978) considered that there is some gene flow when N m>1; if N m>4 it is a random unit, and if N m is far smaller than 1 the population would be differentiated strongly. In this study, the N m of the three populations was 0.7776, which indicates gene flow among them. However, the relative isolation of habitats leads to a certain degree of genetic differentiation (G st of 0.3914).
Genetic distance and divergence times of the three populations presented the same trends. The genetic distance and divergence between the MD and WSL populations was the highest, and those of the MD and YL populations the lowest.
Protection of genetic diversities
This study indicates that the three populations had moderate genetic diversities enabling the further evolution of Lenok. The Lenok will therefore be endangered due to the lower genetic diversities among the different populations. The genetic diversity of the three populations was sufficiently high as to ensure its protection. However, with dwindling numbers and the gradual promotion of artificial breeding, a large number of inbred phenomena will become apparent. It is important, therefore, to protect genetic diversity in good time (Li et al. Reference Li, Gu and Zhou2003).
It is important that centres can be established to raise purebred Lenok to protect the genetic diversity of the population and allow selection of a high-heterozygosity population to avoid a genetic bottleneck effect from inbreeding, by using molecular technology.
Acknowledgements
This work was funded by the National Science & Technology Pillar Program (no. 2006BAD03B08-3) and basic scientific research operation costs from Hei Long-jiang Province (no. 2008HSYZX-YZ-03). We would like to thank Bo Ren and Yuan-yuan Wang for their help in sample collection, and Guang-xiang Tong and You-yi Kuang for their helpful advice and enthusiastic support of the study.