Introduction
The development of motor abilities/function reflects the relationship of a living being with its environment, which begins early in almost all species. It is well known that this development of motor function is closely related to the locomotor system, which undergoes pronounced changes throughout the early lifespan, and notably the skeletal muscles show exceptional adaptability.
In rats, most of the functional properties of skeletal muscles differentiated during the first 21 days of life (Ho et al., Reference Ho, Heusner and Van Huss1983; Punkt et al., Reference Punkt, Krug, Huse and Punkt1998). At this weaning age, almost all functional elements of the locomotor system are ready to allow an independent locomotion when the rat pups leave the nest. During these first 3 weeks of life, numerous complex changes in histochemical, biochemical and metabolic properties take place (Eken and Gundersen, Reference Eken and Gundersen1988). Fibre-type differentiation is one useful example of this complex period. As a matter of fact, soleus muscle shows gradual fast-to-slow fibre differentiation and extensor digitorum longus (EDL) muscle a type IIA-to-IIB differentiation (Smith et al., Reference Smith, Green, Thomson and Sharratt1988; Umezu et al., Reference Umezu, Hachisuka, Ueda, Yoshizuka, Ogata and Fujimoto1992). Then at weaning age, skeletal muscles of rats have a well-defined pattern of fibre type, which are in agreement with their functional profile, e.g. an increase in type I fibres for the postural soleus muscle. Nevertheless, skeletal muscles are still submitted to some maturation process until adulthood (Ishihara and Taguchi, Reference Ishihara and Taguchi1991; Punkt et al., Reference Punkt, Naupert and Asmussen2004). During this post-weaning growth and maturation phase (week 4 to 16), the muscles continue to grow and mature until the animal reaches sexual maturity (Kovanen, Reference Kovanen1989), in order to establish the final fibre-type profile. Indeed, fibre-type differentiation does not take place to the same extent in the slow soleus muscle and the fast EDL muscle. For the soleus muscle, numerous authors reported a further increase in slow-twitch fibres to the detriment of fast-twitch fibres (Ishihara and Taguchi, Reference Ishihara and Taguchi1991; Konishi et al., Reference Konishi, Iwamoto, Ohara and Shimada2000; Punkt et al., Reference Punkt, Naupert and Asmussen2004), whereas for the fast EDL muscle the fibre-type profile is already established (Smith et al., Reference Smith, Green, Thomson and Sharratt1988; Sugiura et al., Reference Sugiura, Matoba, Miyata, Kawai and Murakami1992; Yamaguchi et al., Reference Yamaguchi, Horio, Sakuma and Katsuta1993; Punkt et al., Reference Punkt, Naupert and Asmussen2004).
This differentiation in fibre type profile is also accompanied by changes in the contractile properties of skeletal muscles. The fact that fibre type distribution and contractile properties are closely related has been object of numerous studies (for review see Close, Reference Close1972). To characterize the contractile properties, twitch kinetics and maximal shortening velocity (Vmax) are useful parameters. It has been reported (Close, Reference Close1972) that when a muscle contains predominantly fast-twitch fibres (e.g. EDL), its twitch kinetics are shorter and Vmax is higher, compared to a slow-twitch muscle (e.g. soleus). Moreover, adaptations in contractile properties were reported in adult muscles using overuse or disuse experiments (Eken and Gundersen, Reference Eken and Gundersen1988; Almeida-Silveira et al., Reference Almeida-Silveira, Perot, Pousson and Goubel1994; Canon and Goubel, Reference Canon and Goubel1995) and these alterations were related to a shift in isomyosin or fibre type distribution (Diffee et al., Reference Diffee, Caiozzo, Herrick and Baldwin1991; Canon and Goubel, Reference Canon and Goubel1995). To our knowledge, data in the literature about changes in contractile properties during growth (i.e. between weaning and adult age) are scarce. Moreover, skeletal muscles are characterized not only by its contractile properties but also by its elastic properties. Thus, a possible site of adaptation is the so-called series elastic component (SEC), which is composed of an active fraction (cross-bridges) and a passive fraction (tendon) (Huxley and Simmons, Reference Huxley and Simmons1971). Studies in adult rats, using training or disuse methods, reported modifications in SEC stiffness, which was associated with a fibre-type transition phenomenon (Pousson et al., Reference Pousson, Perot and Goubel1991; Almeida-Silveira et al., Reference Almeida-Silveira, Perot, Pousson and Goubel1994; Canon and Goubel, Reference Canon and Goubel1995). However, the literature indicated no reported data in SEC stiffness of soleus and EDL muscle during growth and maturation.
Therefore, the aim of the present study was to characterize changes in contractile and elastic properties during the post-weaning period for two muscles that are opposite in terms of fibre-type distribution, the soleus muscle and the EDL muscle. In addition, during this period, there was an increase both in muscle cross-sectional area and in muscle length. So, probable changes in the muscle architecture may occur and thus influence some mechanical properties (Ettema and Huijing, Reference Ettema and Huijing1990; Huijing et al., Reference Huijing, Nieberg, van der Veen and Ettema1994). This latter aspect will be taken into account to discuss the results.
Material and methods
Animal care and muscle sampling
Sixteen 25-day-old and fourteen 90-day-old male Wistar rats were used in this study. 25-day-old rats showed a freely moving capacity; at 90 days, they reached sexual maturation, and so are young adults. The animals were maintained at a room temperature of 23 ± 2°C, and a 12/12 h light–dark cycle. The Ethics, Hygiene and Safety Committee of the University of Compiègne approved the experimental protocols used in the present study. The rats were anaesthetized with an intraperitoneal injection of sodium pentobarbital (30 mg/kg). The soleus and EDL muscles were carefully excised from the hindlimb and placed in a dissection chamber containing a Ringer solution (composition in mM: NaCl, 115; NaHCO3, 28; CaCl2, 2.5, MgSO4, 3.1; KCl, 3.5; KH2PO4, 1.2; glucose, 11.1) maintained at 25°C and oxygenated with a gas mixture of 95% O2 and 5% CO2, which resulted in a pH of 7.3. Muscles were used either for mechanical experiment or for histochemical analysis.
Experimental set-up
Immediately after dissection, the muscle was mounted horizontally in the chamber with its proximal end fixed to a force transducer. Its distal end was linked to the moving part of a servo-controlled ergometer described in detail elsewhere (Lensel-Corbeil and Goubel, Reference Lensel-Corbeil and Goubel1989). Care was taken to minimize the length of free tendon. Muscles were adjusted to an optimal length (L 0) defined as the length at which maximum twitch tension (Pt) was elicited. Tetanic stimuli of optimal frequency were delivered via two parallel silver electrodes located on either side of the muscle. Pulses were supramaximal, 0.5 ms in duration and of alternate polarity in order to avoid electrolysis. The movement of the ergometer was triggered when the tetanic tension (P 0) was fully developed. Each muscle was then submitted to a series of dual controlled releases after it reached the tetanic plateau (800 ms and 400 ms after initiation of the stimulation for soleus and EDL muscles, respectively). First, a controlled fast release (ΔL) at maximum velocity (30 cm/s) was performed in order to release the SEC. The minimal tension P obtained at the end of this fast release was then measured. Immediately after this fast release, the muscle was shortened at a constant velocity (V) adjusted to obtain a plateau in tension with minimum transients. A 5 min resting period was observed between two tetanii to avoid muscle fatigue.
In order to test SEC stiffness, tension/extension curves were constructed by plotting the normalized shortening (ΔL/L 0 × 10−2) against the normalized tension (P/P 0) from 10 to 15 releases of different amplitudes. The data were fitted to a third-order polynomial function and the muscle stiffness was evaluated by computing the compliance (ΔL/ΔP) at P 0 and 0.2 P 0 and the maximal extension (ΔLmax), i.e. the maximal release required to obtain zero tension.
According to Hill’s equation [(P + a) (V + b) = (P 0 + a)b], a linearization of force/velocity curves was performed by plotting for each isovelocity shortening (V) the normalized steady tension (P/P 0) against the ratio (P 0 − P)/VP 0. The data were then fitted to a linear regression adjustment and the maximal shortening velocity (Vmax) was computed using regression analysis.
Both tetanic and twitch tension (P 0 and Pt, respectively) were measured for each muscle and normalized to muscle weight (MW). The twitch kinetics were analysed by the measurements of contraction time (CT) and half relaxation time (HRT).
A fatigue test was performed using a procedure similar to that described by Burke et al. (Reference Burke, Levine, Tsairis and Zajac1973). Briefly, pulses (frequency: 40 Hz; duration: 330 ms) were delivered once per second for 2 min. Resistance to fatigue was quantified by measuring tension production every 5 s. The endurance index (expressed as a percentage) was calculated as the tension produced every 30 s divided by the tension produced during the first second.
Histochemical analysis
Muscles were excised and frozen in liquid nitrogen until they were examined. Serial cross-sections (10 μm) were cut with a cryostat maintained at −20°C and were stained for calcium-activated myofibrillar ATPase (mATPase) after preincubation at various pH levels. Muscle fibres were classified on the basis of differences in staining intensity for mATPase after alkaline (pH 10.3) or acid (pH 4.3 and 4.6) preincubation (Brooke and Kaiser, Reference Brooke and Kaiser1970). Since a detailed histochemical analysis was beyond the scope of the present paper, muscle fibres were classified into three major types (I, IIA and IIB) and intermediate fibre type (Int) (Pierobon-Bormioli et al., Reference Pierobon-Bormioli, Sartore, Libera, Vitadello and Schiaffino1981). Histochemical analysis was performed using the QWin Leica® image analysis system. The muscle fibre type composition was determined by counting approximately 1000 fibres in fields equally distributed over the sample.
Statistical analysis
All data shown are presented as mean ± s.e. All statistical analyses were performed using a computer program (Statgraphics plus 5.0). A two-way ANOVA was performed to evaluate the influence of age or muscle type. If an overall significant P value was obtained, a Fisher’s post hoc analysis was used to isolate the significantly different means. All comparisons were performed at P < 0.05.
Results
Body and muscle weights
The weight of the 90-day-old rats was roughly four times higher than that of the 25-day-old rats (95.2 ± 2.4 g in 25-day-old rats compared to 460.1 ± 14.6 g in 90-day-old rats, P < 0.05). This body weight increase was accompanied by an increase in both soleus (63.3 ± 1.5 mg v. 232.1 ± 7.1 mg, P < 0.05) and EDL muscles wet weight (50.9 ± 1.6 mg v. 240.9 ± 6.9 mg, P < 0.05).
Force and twitch characteristics
As shown in Table 1, both twitch and tetanic tension of soleus and EDL muscle were significantly higher in 90-day-old rats compared to 25-day-old animals. When tetanic tension was normalized with respect to muscle mass, results indicated an increase in relative tension only for EDL muscle. When a comparison was made between soleus and EDL muscles for the same age, data showed a higher value in twitch tension, in tetanic absolute tension and in the relative tetanic tension in EDL muscle.
Twitch (Pt) and tetanic (P 0) tension, relative tetanic tension (P 0/MW) and contraction time and half relaxation time in soleus and EDL muscles of 25- and 90-day-old rats

EDL = extensor digitorum longus; CT = contraction time; HRT = half relaxation time.
Values are means ± s.e. (number of observations).
aSignificant effect of age at P < 0.05.
bSignificant difference between soleus and EDL muscles for the same age at P < 0.05.
For the soleus muscle, both CT and HRT were significantly increased in 90-day-old rats in comparison with the 25-day-old rats, whereas these values were not different for EDL muscle.
Maximal shortening velocity
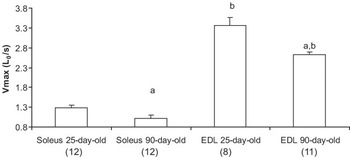
Vmax of both soleus and EDL muscles decreased significantly with age (Figure 1). For these two muscles, growth resulted in a 20% and 22% decrease in maximal shortening velocity in soleus and EDL muscles, respectively. On the other hand, EDL muscle showed a significantly maximal shortening velocity than soleus muscle in both age groups. In effect, whatever the age, Vmax in EDL muscle was approximately 2.5 fold higher than in soleus muscle for the same age.
Maximal shortening velocity (Vmax) obtained for soleus and extensor digitorum longus (EDL) muscles in 25- and 90-day-old rats (number of observations in parentheses). aSignificant effect of age at P < 0.05. bSignificant difference between soleus and EDL muscles for the same age at P < 0.05.

Series elastic properties
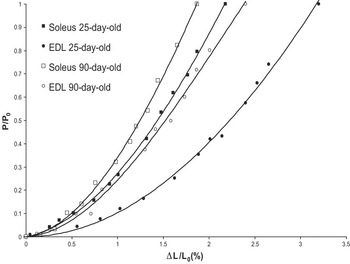
As shown in Figure 2, the tension/extension curves established for both soleus and EDL muscles present the classical non-linear shape, showing an increase in stiffness when tension rises. Moreover, soleus and EDL muscles in 90-day-old rats were found to be significantly stiffer than those of the 25-day-old rats. Indeed, the growth-induced increase in SEC stiffness was confirmed by the calculation of the normalized compliance at 0.2P 0 and by the fact that the maximal extension was smaller in the 90-day-old muscles than in the 25-day-old muscles (Table 2). Furthermore, whatever the age, EDL muscle was found to be less stiff than soleus muscle.
Typical tension–extension curves obtained for soleus and extensor digitorum longus (EDL) muscles in 25- and 90-day-old rats. As normalized tension, P/P 0. As normalized extension, ΔL/L 0.

Tension/extension properties of soleus and EDL muscles of 25- and 90-day-old rats

EDL = extensor digitorum longus; L 0 = optimal length; P 0 = maximal tetanic tension.
Values are means ± s.e. (number of observations).
aSignificant effect of age at P < 0.05.
bSignificant difference between soleus and EDL muscles for the same age at P < 0.05.
Fatigue characteristics
As shown in Table 3, there was no age effect in the endurance index for EDL muscle, whereas, for soleus muscle, the endurance index was higher after the 30th second in the 90-day-old rats compared to the data obtained in the 25-day-old rats. Moreover, important differences between soleus and EDL muscles can be observed. Indeed, EDL muscle was globally more fatigable than soleus muscle, and this difference in the endurance index was particularly pronounced after the first minute (Table 3).
Endurance index (expressed as a percentage; tension produced at 30, 60, 90 and 120 s divided by the tension produced during the first second) at 30, 60, 90 and 120 s for soleus and EDL in 25- and 90-day-old rats

Values are means ± s.e. (number of observations).
aSignificant effect of age at P < 0.05.
bSignificant difference between soleus and extensor digitorum longus (EDL) muscles for the same age at P < 0.05.
Histochemistry
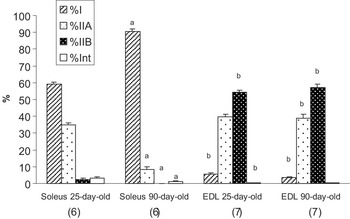
As shown in Figure 3, there was a fast-to-slow fibre-type transition in soleus muscle during growth. As a matter of fact, the percentage of type I fibres increased by about 50%, essentially to the detriment of type IIA fibres. On the other hand, for EDL muscle, there was no difference in fibre-type distribution between 25- and 90-day-old rats.
Percentage distribution of fibres in soleus and extensor digitorum longus (EDL) muscles (number of observations in parentheses). aSignificant effect of age at P < 0.05. bSignificant difference between soleus and EDL muscles for the same age at P < 0.05.

Discussion
As in most studies regarding age effects, the present results indicate a fast-to-slow fibre-type transition in soleus muscle, whereas no modification in fibre-type distribution was observed in EDL muscle (Smith et al., Reference Smith, Green, Thomson and Sharratt1988; Ishihara and Taguchi, Reference Ishihara and Taguchi1991; Sugiura et al., Reference Sugiura, Matoba, Miyata, Kawai and Murakami1992; Konishi et al., Reference Konishi, Iwamoto, Ohara and Shimada2000; Punkt et al., Reference Punkt, Naupert and Asmussen2004).
As expected, the growth-related increase in rat body weight was accompanied by an increase in soleus and EDL muscles weight. In the same sense, our results indicated increases in both twitch and tetanic tension in soleus and EDL muscles. Nevertheless, whereas relative tetanic tension was not modified in soleus muscle, 90-day-old EDL muscle developed a greater P 0/MW than 25-day-old EDL. Muscle tension development depends on the contractile material operating in parallel within the muscle and tension was generally normalized with respect to physiological cross-sectional area (PCSA), since PCSA and maximum force are proportional (Powell et al., Reference Powell, Roy, Kanim, Bello and Edgerton1984). PCSA, which represents the cross-sectional area of the muscle according to the perpendicular axis of fibres, is calculated by the following equation: MW/(L 0 * Lf/L 0 * 1.06) where Lf/L 0 is the ratio between fibre length and muscle length, and 1.06 is the density of skeletal muscle (Segal and Faulkner, Reference Segal and Faulkner1985). Nevertheless, between 25 and 90 days of age, muscles undergo important increases in both muscle weight and muscle length, and modification in muscle architecture, leading to a change in the Lf/L 0 ratio. An 18% reduction in Lf/L 0 was reported between 40 and 120 days of age for rat EDL muscle, which presents, at adult age, a pennation angle of 10° (Huijing et al., Reference Huijing, Nieberg, van der Veen and Ettema1994). For this pennate muscle, the smaller increase in Lf in comparison with L 0 can be due to an increase in the pennation angle with age. If this is the case, this phenomenon can explain the increase in relative tetanic tension in this muscle. On the contrary, for an almost parallel-fibered muscle like the soleus (Close, Reference Close1964), contributions of changes in muscle architecture can be considered negligible.
Furthermore, whatever the age, soleus muscle exhibited a smaller relative tetanic tension than EDL muscle. These differences in maximum tension between fast and slow muscles are well documented (Close, Reference Close1972). For example, a lower tension was developed per unit of cross-sectional area in slow fibres than in fast fibres (Bottinelli et al., Reference Bottinelli, Canepari, Reggiani and Stienen1994). In this view, the differences in tension observed between soleus and EDL muscles may be related to the difference in the principal fibre type present in these two muscles, i.e. slow fibre type in soleus muscle and fast fibre type in EDL muscle, even if extrinsic factors like muscle architecture influence tension production (Close, Reference Close1972).
Twitch CT as well as HRT were increased in 90-day-old soleus muscle, compared to 25-day-old ones, whereas no difference was seen in the EDL. It is generally assumed that these parameters reflect both the rate of cross-bridge cycling and the calcium kinetics for release and reuptake into the sarcoplasmic reticulum (Close, Reference Close1972) and, consequently, depend on fibre-type distribution in the muscle. In this way, the fast-to-slow fibre-type transition in soleus muscle as well as the unmodified fibre-type distribution in EDL muscle is in accordance with the results of twitch kinetics observed in this study. Moreover, the form of the isometric twitch depends on the mechanical properties of the SEC (Hill, Reference Hill1951; Stevens and Renaud, Reference Stevens and Renaud1985) and modifications of these elastic properties could modify the parameters derived from the twitch. As a matter of fact, since a growth-induced increase in SEC stiffness in soleus muscle was also found, this may shorten the twitch and hence take part in the reduction of the twitch kinetic parameters in this muscle. Differences in twitch kinetics reported in this study between fast EDL and slow soleus muscles were in accordance with the literature for adult rats (Hennig and Lomo, Reference Hennig and Lomo1987; Gundersen and Eken, Reference Gundersen and Eken1992) and were related to the different fibre-type distribution between these muscles.
Resistance to fatigue was more pronounced in adult soleus muscle in comparison to weaning age even though no difference was observed for EDL muscle. Moreover, for 25- and 90-day-old rats, soleus muscle presented a greater resistance to fatigue than EDL muscle. These differences in fatigability are in accordance with the histochemical profile of these muscles. As a matter of fact, it is generally assumed that type I fibres have a greater resistance to fatigue than type IIA fibres, this latter fibre type being less fatigable than type IIB fibres (Burke et al., Reference Burke, Levine, Tsairis and Zajac1973). In our study, it was noted that there was a large increase in type I fibre proportion with a concomitant drop of type IIA fibre in soleus muscle. This could explain the 20% increase in the endurance index from weaning to adult age.
Analysis of Vmax showed a decrease in this parameter in both soleus and EDL muscles during growth. Vmax is thought to be largely dependent on myosin ATPase but it is also a function of the pennation angle and the number of sarcomeres operating in series in the muscle. Since during growth, there was an important increase in muscle length, partly due to an increase in fibre length, and thus, in the number of sarcomeres in series, it seems interesting to estimate the shortening velocity in terms of unit amounts of contractile material operating in series. For this purpose, Vmax for one unit, i.e. for one sarcomere (in mm/s), was calculated from the number of sarcomeres in soleus and EDL fibres reported by Close (Reference Close1964). For soleus muscle, the calculation reveals a reduction in Vmax per one sarcomere during growth (0.008 ± 0.0005 mm/s v. 0.0064 ± 0.0005 mm/s in 25-day-old and 90-day-old rats, respectively, P < 0.05). This decrease in Vmax per sarcomere is of the same extent as the 20% decrease in Vmax, expressed in L 0/s. Firstly, this result confirms that the increase in muscle length was of the same extent as the increase in the number of sarcomeres in series (and consequently in fibre length) in this almost parallel-fibered muscle. Secondly, the decrease in Vmax observed for this muscle is actually a decrease in the shortening velocity at the unit level. This decrease in shortening velocity, in terms of both muscle length and sarcomere unit, is consistent with the fast-to-slow transition observed in this specific muscle. Indeed, correlation between Vmax and the percentage of fast myosin heavy chains have been reported at the fibre level (Reiser et al., Reference Reiser, Moss, Giulian and Greaser1985). On the other hand, these results indicate that, for the soleus muscle, modifications in muscle architecture with age are negligible. Nevertheless, for EDL muscle, calculation showed no modification in Vmax per one sarcomere between 25-day-old and 90-day-old rats (0.0239 ± 0.0016 v. 0.0218 ± 0.0008 mm/s, respectively; n.s.). The discrepancy in evolutions between Vmax in L 0/s and Vmax per sarcomere unit for this muscle confirms a lesser fibre length increase compared to the increase of muscle length as observed in other studies (Lodder et al., Reference Lodder, de Haan and Sargeant1994). More importantly, the non-significant modification of Vmax in terms of sarcomere unit is in agreement with the maintenance of fibre-type profile during growth in this muscle. Finally, it is important to note that if skeletal muscle presents a relatively small fibre length-to-muscle length ratio (between 0.34 and 0.41) (Lodder et al., Reference Lodder, de Haan and Sargeant1994), then the expression of Vmax in L 0/s is inappropriate for representing the paired changes in maximal shortening velocity and fibre-type profile when the muscle is submitted to important length changes, such as during growth.
The results of this study indicate an increase in SEC stiffness with age in both the soleus and EDL muscles. These changes could be attributed to the active part (i.e. cross-bridges) and/or the passive part (i.e. tendon) of the SEC. In the first case, methods using either hypoactivity or hyperactivity indicated that an increase in percentage of fast-twitch fibres in the rat soleus muscle was related to an increase in SEC compliance, even though contrary SEC mechanical changes were associated with a relative increase in slow-twitch fibre proportion (Goubel and Marini, Reference Goubel and Marini1987; Pousson et al., Reference Pousson, Perot and Goubel1991; Canon and Goubel, Reference Canon and Goubel1995). These studies suggest that slow-twitch fibres and fast-twitch fibres also differ according to their elastic properties. Moreover, it was reported that the slow-twitch motor unit of a cat’s peroneus longus had a greater dynamic stiffness than fast-twitch motor units (Petit et al., Reference Petit, Filippi, Emonet-Denand, Hunt and Laporte1990). Therefore, for soleus muscle, the growth-induced increase in SEC stiffness can be explained at least partly by the fast-to-slow fibre-type transition observed for this muscle. However, it is probable that the increase in soleus SEC stiffness is also due to an increase in stiffness of the passive structures of the SEC. Indeed, even if precautions were taken in order to minimize free tendon length, intramuscular tendon tissue occupies about one-third of the total soleus length. It was reported that collagen concentration in whole soleus muscle including tendons is twice in the young adult rat as compared to the 21-day-old rats (Alnaqeeb et al., Reference Alnaqeeb, Al Zaid and Goldspink1984). Thus, one can expect an increase in the passive part of SEC stiffness during growth. For EDL muscle, the growth-induced increase in SEC stiffness cannot be explained by a modification of the active part of this muscle component, since the present study showed no modification in the fibre-type profile. Therefore, the stiffness modifications observed for EDL muscle are probably due to adaptations of the passive structure of the SEC. Results of other studies showing a growth-induced increase in collagen concentration in whole EDL muscle are in agreement with this hypothesis (Alnaqeeb et al., Reference Alnaqeeb, Al Zaid and Goldspink1984). Lastly, possible changes in EDL muscle architecture with growth must be considered. As a matter of fact, for EDL muscle, a part of muscle compliance was due to muscle architecture, i.e. to the degree of pennation (Ettema and Huijing, Reference Ettema and Huijing1990).
In conclusion, results of the present study showed important modifications in mechanical properties of skeletal muscles due to growth. The observed increase in SEC stiffness in soleus muscle is partly due to changes in fibre-type proportion, whereas for EDL, this result is ascribable to changes in tendinous structure. Even when the decrease in Vmax observed in soleus muscle is in agreement with its fast-to-slow fibre-type transition, the same change is observed in EDL in spite of the lack of fibre-type distribution change. For such a pennate muscle, a discrepancy between histochemical profile and maximal shortening velocity can be removed provided that muscle architecture is taken into account when expressing muscle mechanical properties.
Acknowledgements
This work was supported by CAPES (grant CAPES-COFECUB no. 417/03) and Association Française contre les Myopathies – AFM. The authors are grateful to Mary Therese Vitlow for the English review of the manuscript.