I. INTRODUCTION
Dynamic correlation effects of strongly correlated electron systems pose a serious challenge to our theoretical understanding of the physical behavior of these materials. Strong renormalization of electronic bands and their spectral weight anomaly cannot be accounted for by the density functional theory (DFT). Along this line, rare-earth 4f and actinide 5f electron systems are particularly challenging due to their low-energy fermionic excitations with heavy electron mass. A popular model that accounts for this phenomenon is the Anderson model,Reference Anderson 1 where the interaction between localized f electron spins and itinerant conduction electrons (mainly stemming from d orbitals) leads to heavy mass and an interplay between Kondo physics, magnetism, and superconductivity.Reference Hewson 2 The resulting interaction pushes the system to the intermediate Coulomb-U region in which neither the purely itinerant mean field theory nor the strong-coupling Anderson lattice model holds exactly. This twilight zone of intermediate coupling gives rise to prototypical examples of strongly correlated electron systemsReference Si, Abrahams, Dai and Zhu 3 and provides a platform for the emergence and coexistence of multiple competing phases of matter. The observation of universal scaling of the spin fluctuation temperature T s versus superconducting transition temperature T c supports further this picture that the Pu-115 compounds lie in between the Ce-based 4f electron heavy fermion and d electron superconductors (cuprates and pnictides).Reference Curro, Caldwell, Bauer, Morales, Graf, Bang, Balatsky, Thompson and Sarrao 4
An advantage of the intermediate coupling method is that the diagrammatic perturbation theory of fluctuations can still be applied as long as the Hubbard (Coulomb) U ∼ D, where D is the noninteracting bandwidth.Reference Das, Markiewicz and Bansil 5 , Reference Das, Zhu and Graf 6 Here, one starts from the itinerant band picture of electrons where dynamic correlation effects are added perturbatively, giving rise to strong electronic structure renormalization. The fluctuation theory becomes exact in the weak coupling regime but is rather complicated to treat in the intermediate regime. Various approaches have been designed to deal with this regime.Reference Moriya 7 In this feature article, we present an overview of the intermediate Coulomb-U coupling model based on the self-consistent GW formalism of the self-energy within random phase approximation (RPA), and the obtained results will be compared directly with various spectroscopies. The material-specific ab initio band structure is used as input to the calculations, which plays a very important role in deriving quantitative agreement with experiments. Not only does it enable us to obtain a systematic description of the correlation spectrum but also helps us to study how the high-energy correlation spectrum evolves naturally into magnetic and superconducting ground states, which vary dramatically within the same 115 actinide family.Reference Moreno, Bauer, Sarrao, Hundley, Thompson and Fisk 8 – Reference Boulet, Colineau, Wastin, Rebizant, Javorský, Lander and Thompson 10
Uranium-based 115 compounds are often contrasted with the rich phase diagram of the isostructural Pu-115 compounds. PuCoGa5,Reference Sarrao, Morales, Thompson, Scott, Stewart, Wastin, Rebizant, Boulet, Colineau and Lander 11 PuRhGa5,Reference Wastin, Boulet, Rebizant, Colineau and Lander 12 and PuCoIn5 Reference Bauer, Altarawneh, Tobash, Gofryk, Ayala-Valenzuela, Mitchell, McDonald, Mielke, Ronning, Griveau, Colineau, Eloirdi, Caciuffo, Scott, Janka, Kauzlarich and Thompson 13 were discovered to be superconducting with characteristically varying transition temperature T c, whereas UTGa5 (T: Ni, Pd, Pt)Reference Grin, Rogl and Hiebl 14 , Reference Ikeda, Tokiwa, Okubo, Yamada, Matsuda, Inada, Settai, Yamamoto, Haga and Onuki 15 are antiferromagnets and UCoGa5 is a paramagnet,Reference Das, Zhu and Graf 6 yet not a typical Fermi liquid.Reference Das, Durakiewicz, Zhu, Joyce, Sarrao and Graf 16 Due to this diversity of ground states within the same family, it provides an excellent test bed for applying our approach. In future design of materials properties, one might even be able to correlate specific electronic “hot spots” in the spectral function with specific ground state properties for controlled functionality.
From the experimental side, the photoemission data reveal a strong spectral weight redistribution in the single-particle spectrum with a prominent peak-dip-hump structure around 0.5 eV in Pu-115Reference Joyce, Wills, Durakiewicz, Butterfield, Guziewicz, Sarrao, Morales, Arko and Eriksson 17 , Reference Joyce, Durakiewicz, Graham, Bauer, Moore, Mitchell, Kennison, Martin, Roy and Scuseria 18 and similarly in UCoGa5, UNiGa5, and UFeGa5.Reference Fujimori, Terai, Takeda, Okane, Saitoh, Muramatsu, Fujimori, Yamagami, Tokiwa, Ikeda, Matsuda, Haga, Yamamoto and Onuki 19 This feature was earlier assigned within a phenomenological picture of f electron duality as the separation between itinerant (peak) and incoherent (hump) states of the 5f electrons.Reference Pezzoli, Haule and Kotliar 20 , Reference Zhu, Tobash, Bauer, Ronning, Scott, Haule, Kotliar, Albers and Wills 21 We interpret these spectra in terms of the spin fluctuation properties creating a dip in the dressed quasiparticle excitations due to strong scattering in the particle–hole continuum. The lost spectral weight (dip) is partially distributed to the renormalized itinerant states at the Fermi level (peak) as well as to the strongly localized incoherent states at higher energy (hump). The coherent states at the Fermi level can still be characterized as Bloch waves, though renormalized, whereas the incoherent electrons appear localized in real space exhibiting the dispersionless hump feature.
The rest of this feature article is arranged in the following way. We start with a recapitulation of the existing models for actinides in Sec. II. A, and then, we summarize our intermediate coupling model in Sec. II. B. In Sec. III, ab initio band structure, without correlation, of Pu-115 and UCoGa5 family is discussed, followed by results for the momentum-resolved and momentum-integrated spin fluctuation spectrum, self-energy functional, and the corresponding dressed electronic structure. The calculations are compared with integrated photoemission spectroscopy (PES) and angular-resolved photoemission spectroscopy (ARPES) as well as with de Haas–van Alphen (dHvA) measurements in Sec. IV. The ubiquitous nature of these phenomena between actinide, high-temperature cuprate superconductors, and strontium ruthenate is also deduced in Sec. IV. C. In Sec. V, we discuss the implication of the results on the low-energy mass renormalization and unconventional superconductivity. Conclusions and related future directions are given in Sec. VI. Finally, we relate the calculated spin fluctuation coupling constant λ to the superconducting transition temperature (T c) as we move across the family, suggesting that spin fluctuations also play a crucial role in the pairing mechanism.
II. THEORETICAL METHODS
A. Various models of correlated electron systems
With the rapidly growing computer technology, the development of DFT (for a review see Ref. Reference Martin22) has led to significant progress in electronic structure theory during the past five decades. In principle, the theory is rigorous in describing the ground state properties of electronic systems.Reference Hohenberg and Kohn 23 In practice, the exchange–correlation functional, which is the most crucial component of the theory, is designed with approximations. Among them, the local density approximation (LDA)Reference Kohn and Sham 24 and generalized gradient approximation (GGA)Reference Perdew, Burke and Ernzerhof 25 have turned out to be quite successful in describing “good” metals and a few semiconductors. However, the LDA-based DFT theory fails badly for two important classes of materials, partially filled d electron-based transition metal oxides and f electron-based lanthanides and actinides. These classes of materials are broadly termed as strongly correlated electronic systems, in which Landau’s Fermi liquid description of dressed single particles often fails to characterize low-lying excitations. It is well known that the implemented correlation exchange functionals in the DFT underestimate strong correlation effects of electrons.
During the past two decades, significant progress has been made to overcome the inadequacy of the LDA and GGA methods for strongly correlated electron materials. A few correlated band approaches like LDA + U,Reference Anisimov, Aryasetiawan and Lichtenstein 26 hybrid density functional,Reference Perdew, Ernzerhof and Burke 27 and self-interaction corrected local spin density approximation have been proposed within the framework of DFT.Reference Perdew and Zunger 28 – Reference Szotek, Temmerman and Winter 30 To truly capture the dynamical effects, many-body techniques, which were mostly developed in the many-body model Hamiltonian community, have been developed to include materials specifics. Two of the most notable and currently popular many-body approaches are the first-principle GW approximationReference Aryasetiawan and Gunnarsson 31 , Reference Hedin 32 and the combination of the dynamical mean field theory (DMFT)Reference Metzner and Vollhardt 33 – Reference Georges, Kotliar, Krauth and Rozenberg 35 with the LDA.Reference Kotliar, Savrasov, Haule, Oudovenko, Parcollet and Marianetti 36 Within the GW method, the self-energy can be formally expanded in powers of the screened interaction W, as such starting from the itinerant limit. Originally limited to the electron gas, many applications to real materials like semiconductors and insulators have been reported.Reference Onida, Reining and Rubio 37 On the other side, within the LDA + DMFT method, the effects due to local Coulomb interaction U are treated nonperturbatively by mapping a quantum many-body lattice problem onto an effective impurity problem. Here the conduction electron bath is determined self-consistently.Reference Georges, Kotliar, Krauth and Rozenberg 35 In the single-site DMFT implementation, the self-energy on the correlated orbitals is assumed to be local, which captures quantum temporal fluctuations but not spatial fluctuations. In this sense, the LDA + DMFT methodReference Kotliar, Savrasov, Haule, Oudovenko, Parcollet and Marianetti 36 , Reference Held 38 is ideal for the description of systems sitting on the localization–delocalization border. The LDA + DMFT technique has been applied with remarkable success to transition metals, transition metal oxides, and some f electron materials. For references on this vast topic, see Refs. Reference Kotliar, Savrasov, Haule, Oudovenko, Parcollet and Marianetti36 and Reference Held38. More recently, various groups attacked the correlation problem of f electrons in URu2Si2,Reference Haule and Kotliar 39 CeIrIn5,Reference Shim, Haule and Kotliar 40 , Reference Choi, Min, Shim, Haule and Kotliar 41 and in the Pu-115 family.Reference Pezzoli, Haule and Kotliar 20 , Reference Zhu, Tobash, Bauer, Ronning, Scott, Haule, Kotliar, Albers and Wills 21 , Reference Pourovskii, Katsnelson and Lichtenstein 42 , Reference Shick, Rusz, Kolorenc, Oppeneer and Havela 43 However, most correlated electron systems of interest are in the intermediate coupling regime, where a classification in neither weak nor strong regime applies. Which of these methods ultimately gives a better description of dynamic correlation effects is a priori unknown and subject of ongoing research.
This review focuses on the intermediate Coulomb-U coupling model combined with electronic structure calculations of strongly correlated electron materials. We present the basic concepts and computational tools of the RPA-based GW method for calculating spin fluctuation dressed electronic states in the intermediate coupling regime and apply it to the intermetallic actinide families of Pu-115 and U-115. We anticipate that with the continuing development of many-body methods, the increasing computational power, and development of novel algorithms, researchers will get new tools for material modeling that can treat effectively the band renormalization and low excitation spectrum of strongly correlated electron materials as expressed in many actinides.
B. An intermediate Coulomb-U coupling model
In the intermediate Coulomb-U coupling model, we calculate material-specific properties affected by dynamic electron correlations. The input for the many-body self-energy calculations of electron correlations is based on first-principles electronic band structures, including spin–orbit coupling within the framework of DFT using the GGA.Reference Perdew, Burke and Ernzerhof 44 The spectral representation of the Green’s function is constructed as:
 $$G_{sp}^0 ({\bi{k}},i{\rm{\omega }}_n ) = \sum\nolimits_{\rm{\mu }}\,\, {{{\varphi_{\rm{\mu }}^s (\bi{k})\varphi_{\rm{\mu }}^{p*} \,(\bi{k})} \over {i{\rm{\omega }}_n - E_{\rm{\mu }} \,(\bi{k})}}} \quad.$$
Here,
 $\varphi_{\rm{\mu }}^i $
is the eigenstate for μth band E
μ projected on the ith orbital. The noninteracting susceptibility in the particle–hole channel is calculated by convoluting the Green’s function over the entire Brillouin zone (spin and charge bare susceptibility are the same in the paramagnetic ground state)Reference Takimoto, Hotta and Ueda
45
:
 $${\rm{\chi }}_{spqr}^0 ({\bi{q}},\Omega ) = - {T \over N}\sum\nolimits_{k,n} {G_{sp}^0 ({\bi{k}},i{\rm{\omega }}_n )G_{qr}^0 ({\bi{k}} + {\bi{q}},i{\rm{\omega }}_n + \Omega )} \quad.$$
Within the RPA, spin and charge channels become decoupled for transverse fluctuations (we ignore particle–particle as well as weaker charge fluctuation processes). In the spin channel, the collective many-body corrections of the spin fluctuation spectrum in RPA can be written in matrix representation:
 ${{\hat \chi}} = {{\hat \chi }}^0 [\hat 1 - \hat U_{\rm{s}} {{\hat \chi }}^0 ]^{ - 1} $
. The interaction matrix
 $\hat U_{\rm{s}} $
is defined in the same basis consisting of intraorbital U, intraorbital V, Hund’s coupling J, and pair scattering J′ terms.Reference Takimoto, Hotta and Ueda
45
–
Reference Das and Balatsky
48
In our definition, the interaction vertex is a tensor of dimension n
2 × n
2 (n is the number of bands) with U and V going to the diagonal terms, while J and J′ going to the off diagonals. In the present calculation, we neglect the orbital overlap of eigenstates, i.e., we assume
 $\phi^i_\mu = 1,$
when i = μ. Such an approximation simplifies the calculation and
 ${{\hat \chi }}^0 $
becomes a diagonal matrix with J = J′ = 0.
For calculation of the many-body self-energy in the GW approximation, G represents the Green’s function and W the interaction vertex. In this work, we are using a modified or “GW-like” version of the conventional GW approximation. First, we are performing only a “single-shot” self-energy calculation, i.e., we are not feeding back the renormalized Green’s function into the electronic structure calculation. Second, we are using a phenomenological on-site Coulomb-U in the spirit of the Anderson model of localized moments coupled to conduction electrons, instead of a self-consistent Coulomb potential. In this GW-like approximation, we denote the vertex by V, instead of W, and write the matrix element of the spin fluctuation interaction vertex in the fluctuation exchange approximation following Ref. Reference Bickers, Scalapino and White49:
 $$V_{pqrs} ({\bi{q}},\Omega ) = \left[ {{3 \over 2}\hat U_{\rm{s}} {{\hat \chi \Prime}}({\bi{q}},\Omega )\hat U_{\rm{s}} } \right]_{pqrs} \quad.$$
The Feynmann–Dyson equation for the imaginary part of the self-energy in a multiband system with N sites is:
 $${ \Sigma\nolimits_{pq}^{\prime\!\prime} {({\bi{k}},{\rm{\omega }})} & = \cr - {1 \over N}\sum _{rs} \sum _q \int_{ - \infty }^\infty {d\Omega \Gamma ({\bi{k}},{\bi{q}},{\rm{\omega }},\Omega )} \hat V_{pqrs} ({\bi{q}},\Omega )\left[ \matrix{ (n_{\rm{B}} (\Omega ) + f({\rm{\omega }} + \Omega ))A_{rs} ({\bi{k}} + {\bi{q}},{\rm{\omega }} + \Omega ) \hfill \cr + (n_{\rm{B}} (\Omega ) + 1 - f({\rm{\omega }} - \Omega ))A_{rs} ({\bi{k}} + {\bi{q}},{\rm{\omega }} - \Omega ) \hfill \cr} \right]\quad, \cr} $$
The quasiparticle spectral function is defined by Ars
(
k
, E) = −Im
 $G_{rs}^0 $
(
k
, E)/π. The quantities n
B and f are the Bose–Einstein and the Fermi–Dirac distribution functions, respectively. The vertex correction Γ will be assumed isotropic as discussed later. For a more accurate calculation, one needs to account for the anisotropy in
 $\hat V$
(
q
, Ω). In the present case, where the spin fluctuation spectrum is only weakly anisotropic (see Fig. 3), it is justified to replace the first term in Eq. (4) by a momentum-averaged spin fluctuation function interaction, i.e.,
 $\hat V({\rm{\Omega }}){\rm{}}_q = \left[ {{{a^3 } \over {(2{\rm{\pi }})^3 }}} \right]\int {d^3 q\hat V({\bi{q}},{\rm{\Omega }})} {\rm{}}$
. This is equivalent to dropping the
k
dependence of the self-energy, which greatly simplifies the numerical self-consistency loop. It then follows from Eq. (4) that at T= 0, the imaginary part of the self-energy reduces to:
 $$\Sigma\nolimits_{pq}^{\prime\!\prime} {({\rm{\omega }})} \approx - 2\sum\nolimits_{rs} {\int_0^{\rm{\omega }} {d\Omega \left\langle {V_{qprs} (\Omega )} \right\rangle _{\bi{q}} N_{rs} ({\rm{\omega }} - \Omega )} } \quad,$$
for ω > 0, where the density of states (DOS) is given by
 $N_{rs} (E) = \sum\nolimits_{\bi{k}} {A_{rs} ({\bi{k}},E)} $
. (For ω < 0, the only changes are: the upper limit of the integral in Eq. (5) is |ω| and the argument of Nrs
is Ω − |ω|.) We use Eq. (5) to compute the imaginary part of the self-energy from the first-principles band structure. The real part of the self-energy,
 $\Sigma \prime_{pq} ({\rm{\omega }})$
, is obtained by using the Kramers–Kronig relationship. Finally, the self-energy dressed quasiparticle spectrum is determined by Dyson’s equation:
 $$\hat G^{ - 1} ({\bi{k}},{\rm{\omega }}) = \hat G_0^{ - 1} ({\bi{k}},{\rm{\omega }}) - \left\langle {\hat \Sigma ({\bi{k}},{\rm{\omega }})} \right\rangle _k\quad .$$
Full self-consistency in the iterative process requires the bare Green’s function
 $\hat G_0 $
to be replaced with the self-energy dressed
 $\hat G$
of Eq. (6) in the expression of
 ${{\hat \chi }}^0 $
in Eq. (2) and in the spectral function A in Eq. (5). This procedure is numerically expensive, especially in multiband systems. Therefore, following the proposal of Markiewicz et al.,Reference Markiewicz, Sahrakorpi and Bansil
50
we adopt a modified self-consistency scheme, where we expand the real part of the self-energy
 $\Sigma\prime({\rm{\omega ) = (1}} - Z^{ - 1} ){\rm{\omega }}$
in the low-energy region [ω < 200 meV < U], where the imaginary part of the self-energy
 $\Sigma \Prime \sim 0$
. The resulting self-energy dressed quasiparticle dispersions
 $\bar E_n $
(
k
) = ZEn
(
k
) are used in Eqs. (1)–(6), which keep all the formalism unchanged with respect to the quasiparticle renormalization factor Z. Finally, in lowest order, Z introduces a vertex correction, which simplifies the complex vertex function to Γ(
k
,
q
, ω, Ω) ≈ Z−1 according to the Ward identity, relating the vertex function with the self-energy.Reference Ward
51
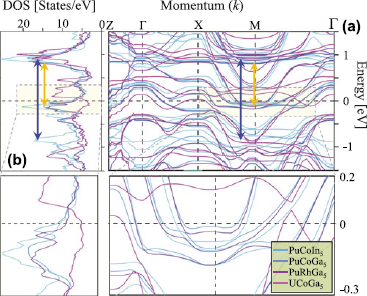
Our choice of the screened Coulomb term U satisfies the intermediate coupling approximation of U/D ∼ 1. As seen from the band structures in Fig. 1(a), the average bare bandwidth for all materials near the Fermi level is of order of 1 eV. Hence, we set U = 1 eV for all compounds, which is below the critical value of a magnetic instability, i.e., U
 ${\rm{\chi }}^0 $
(
q
, ω = 0) < 1 for all
q
. Note that our screened U for the spin fluctuation calculation is smaller than that used in LDA + U type calculations, where a larger value of U∼ 3 eV was introduced into the local orbital basis.Reference Pourovskii, Katsnelson and Lichtenstein
42
,
Reference Shick, Rusz, Kolorenc, Oppeneer and Havela
43
,
Reference Piekarz, Parlinski, Jochym, Olés, Sanchez and Rebizant
52
(a) First-principles GGA electronic band structure calculations for various Pu-115 and UCoGa5 actinides near E F.Reference Das, Zhu and Graf 6 (b) Corresponding DOS in the low-energy region of present interest. The double arrows mark the relevant particle–hole excitations. Insets: Low-energy regions of dispersion and DOS showing that all materials are related by a rigid shift of bands in this energy scale.

III. RESULTS
A. Ab initio electronic structure
First-principles calculations are carried out by using the full potential linearized augmented plane wave method as implemented in the WIEN2k code.Reference Blaha, Schwarz, Madsen, Kvasnicka and Luitz
53
The GGA implementationReference Perdew, Burke and Ernzerhof
25
was used for exchange–correlation functionals. The spin–orbit coupling was included in a second variational way, for which relativistic p
1/2 local orbitals were added into the basis set for the description of the 6p states of uranium or plutonium.Reference Kunes, Novák, Schmid, Blaha and Schwarz
54
For example, the energy spread to separate the localized valence states in UCoGa5 was −6 Ryd. The muffin tin radii were 2.5a
0 for U, 2.48a
0 for Co, and 2.2a
0 for Ga, where a
0 is the Bohr radius. The criterion for the number of plane waves was
 $R_{MT}^{{\rm{min}}} K^{\max } $
= 8 and the number of
k
-points was 40 × 40 × 25. The self-energy calculation below was performed with 40 bands to capture the ±10 eV energy window of relevance around the Fermi level.
Figure 1 presents the calculated GGA band structure in panel (a) and the corresponding noninteracting DOS in (b) for all four materials studied here. Zooming into the Fermi level region in the inset (Fig. 1), we notice that the low-energy band structure remains very much the same shape for all materials. It primarily shifts upward in energy when moving along the series PuCoIn5 → PuCoGa5 → PuRhGa5 → UCoGa5. To leading order, this behavior can very much be accounted for by a rigid band shift. The Pu-115 compounds show two sharp peaks in the DOS just below and above the Fermi energy (E F), which mainly originate from the 5f electrons of Pu atoms. This result is consistent with earlier calculations of the partial DOS in Refs. Reference Zhu, Tobash, Bauer, Ronning, Scott, Haule, Kotliar, Albers and Wills21 and Reference Ophale, Elgazzar, Koepernik and Oppeneer55, in which we find that the 3d (or 4d) and 4p (or 5p) electrons of the reservoir elements are not important in this energy scale. As the DOS at E F decreases in going to UCoGa5 (see magenta lines in Fig. 1), most of the 5f states move above E F, thus reducing the correlation strength to a large extent.
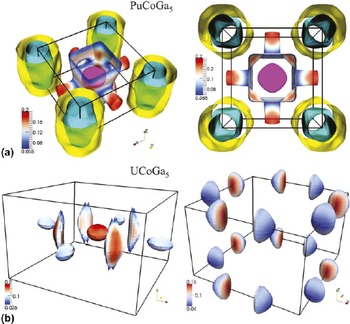
The Fermi surface (FS) topologies for two representative systems, namely of PuCoGa5 and UCoGa5, are shown in Fig. 2. Despite the above-mentioned overall similarities in the electronic dispersion, the fermiology between these materials is significantly different as one might expect in a material-specific study. The fermiology of the other Pu-115sReference Zhu, Tobash, Bauer, Ronning, Scott, Haule, Kotliar, Albers and Wills 21 are very much similar to PuCoGa5 and thus are not shown. As demonstrated for the band structure and DOS in Fig. 1, the FS for Pu-115 systems consists of two cylinder-shaped pieces at the corners of the BZ with lesser three dimensionality. The FS of UCoGa5 is dramatically smaller and highly dispersive along kz . In fact for the latter case, none of the FS pieces survive at all values of kz . These differences in FSs will be discussed in more details in Sec. V. A. We argue that it is responsible for the absence of superconductivity in UCoGa5. Finally, the results will be compared with dHvA oscillations in Sec. IV. E. We note that our GGA calculations agree with previous electronic structure calculations,Reference Ophale, Elgazzar, Koepernik and Oppeneer 55 , Reference Maehira, Hotta, Ueda and Hasegawa 56 except for the detailed shape of the tube-like or pillow-like FS pockets of UCoGa5, which are very sensitive to the location of E F within ∼13 meV (or ∼1 mRyd).
The GGA calculated FSs of PuCoGa5 and UCoGa5. The top panel (a) gives the same four FSs for PuCoGa5, plotted in angle view (left) and top view (right). The FSs for two different bands of UCoGa5 are separated, for clarity, into two figures in the bottom panel (b). The color coding (blue to red) reflects the Fermi speed (low to high) or the inverse of the DOS. The BZ boxes are centered at the Γ point.

B. Momentum and energy dependence of correlation function
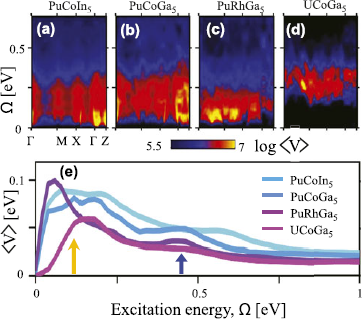
An advantage of the present framework is that, in principle, it can incorporate the momentum dependence of the correlation vertex and vertex correction function. We present the full momentum dependence of the computed spin fluctuation vertex,
 $\hat V$
(
q
, ω), in Fig. 3 plotted as a function of excitation energy along the high-symmetry momentum directions. We see that in some cases, the momentum dependence can be large, and the maximum intensity can shift along the qz
direction. Corresponding momentum-averaged values <V>
q
are fairly similar for all Pu-115 compounds but notably different for UCoGa5. The low-energy peak arises from transitions between the 5f states lying just below and above E
F (within the RPA, the peak shifts to lower energy), see gold arrow in Figs. 1(b) and 3(e). The high-energy hump comes mostly from the transition of the second peak in the DOS below E
F (hybridized d and p states also contributeReference Ophale, Elgazzar, Koepernik and Oppeneer
55
) to the 5f states above E
F as marked by the blue arrow in Figs. 1(b) and 3(e). For UCoGa5, most of the 5f states shift above E
F, and thus, intraorbital spin fluctuations do not survive, while the interorbital spin fluctuations move to higher energy.
The momentum and energy dependence of the spin fluctuation vertex V( q , Ω) is plotted along high-symmetry directions in (a)–(d). Panel (e): the corresponding <V(Ω)> q averaged over 3D momentum space. All calculations are performed for ±10 eV energy window, but results are shown only in the relevant energy region. Reproduced from Ref. Reference Das, Zhu and Graf6. Arrows dictate two peaks in the f–f (lower energy) and f–d (higher energy) indicate transition channels.

C. Energy-dependent self-energy and band renormalization
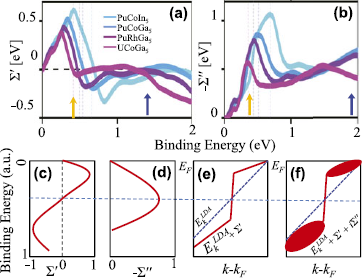
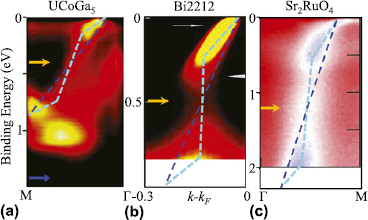
The coupling of the spin fluctuations to the electron dynamics gives the self-energy correction in Eq. (4). The real and imaginary parts of the self-energy Σ(ω) = <Σ( k , ω)> k are plotted in Figs. 4(a) and 4(b), respectively. Note that Σ″(ω) shows a peak-dip-hump feature, which is strongly enhanced by the electronic state in comparison with <V( q , Ω)> q . Both the low- and high-energy features move toward ω = 0 as the 5f states shift toward E F across the series PuCoIn5 → PuCoGa5 → PuRhGa5 → UCoGa5 (for UCoGa5, the 5f states eventually move above E F). The itinerant and localized picture of the quasiparticle character in this class of materials is intimately related to the shape of the self-energies, as schematically illustrated in the lower panel of Fig. 4. In these systems, the strength of the Σ″(ω) peak acquires values that split the overall quasiparticle states into two energy scales; at low energies, it induces itinerant quasiparticle states, while at higher energies, it creates incoherent localized states. The resulting Σ′(ω) acquires an interesting energy dependence. The peak height of Σ″(ω) is sufficiently large at the crossover energy such that it leads to Σ′(ω) = 0, which is possible within the intermediate Coulomb interaction scenario but not in the weak-coupling regime. Below this crossover energy, Σ′(ω) > 0, which causes the quasiparticles to acquire mass enhancement with quasiparticle weight Z < 1. As a consequence, the corresponding bands are renormalized toward the Fermi level. Above this characteristic energy, Σ″(ω) causes the overall quasiparticle state to sharply drop from Z < 1 to Z > 1 region. At the crossover energy, the spectral weight is strongly suppressed due to the peak in Σ″(ω). The obtained shape of the quasiparticle dispersion is dubbed “waterfall” or “S” feature due to both its visual and conceptual similarity,Reference Markiewicz, Sahrakorpi and Bansil 50 , Reference Graf, Gweon, McElroy, Zhou, Jozwiak, Rotenberg, Bill, Sasagawa, Eisaki, Uchida, Takagi, Lee and Lanzara 57 – Reference Basak, Das, Lin, Nieminen, Lindroos, Markiewicz and Bansil 60 see also Sec. IV. C.
The computed momentum-averaged Σ′(ω) and Σ″(ω) are plotted in (a) and (b), respectively. All peak positions in <V> in Fig. 3(b) are shifted to higher energy in Σ″ in (b) due to band structure effects. (c) and (d) Schematic energy dependence of the general shape of the real and imaginary part of the self-energy. Σ′ contains a sign reversal at a characteristic energy where Σ″ is expected to obtain a peak at the energy. (e) A linear dispersion is renormalized by Σ′. (f) Typical form of the spectral weight map in the energy and momentum space due to full Σ-correction. Arrows have same meaning as in Fig. 3.

D. Momentum-resolved single-particle spectrum
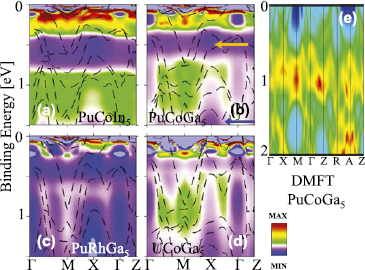
The self-energy dressed quasiparticle state is shown in Fig. 5 for all four compounds as a function of energy and momentum. In all spectra, the pileup of spectral weight (hot spots) at two or three energy scales is clearly visible. A more detailed momentum resolution of the data will be given below. At low energies, when Σ′ > 0, all quasiparticle states are renormalized toward E F. In this energy region, Σ″ is small, reflecting that quasiparticle states are coherent and itinerant. Above the peak in Σ′, where Σ′ < 0, quasiparticle states are pushed to higher energy. The lost spectral weight from the peak in Σ′ is redistributed to both lower and higher binding energies. A similar spectral weight redistribution occurs at the second peak (hump) in Σ″ near 2 eV binding energy. As a result, further pileup of spectral weight occurs around 1.0–1.5 eV, creating hot spots of new quasiparticle states due to electronic correlations. The quasiparticle states in this energy region are incoherent and fairly dispersionless, reflecting the dual aspect of the localized behavior of 5f electrons. Qualitatively, similar behavior was also found by using the LDA + DMFT methodReference Pourovskii, Katsnelson and Lichtenstein 42 shown in Fig. 5(e), however, with a weaker renormalization and significantly less spectral weight near E F compared to experiments (Figs. 7 and 10).
(a)–(d) The self-energy dressed angle-resolved spectral weight A( k , ω) is plotted along high-symmetry momentum directions. The peak-dip-hump feature is clearly evident in all spectra below 1 eV. Reproduced from Ref. Reference Das, Zhu and Graf6. The LDA + DMFT calculation of PuCoGa5 from Ref. Reference Choi, Min, Shim, Haule and Kotliar41 is shown in (e) for comparison. We see that DMFT predicts the pileup of the spectral weight around 1 eV (lower Hubbard band) with virtually no spectral weight at lower energy. The experimental data in Fig. 7 and in Fig. 10, however, demonstrate substantial spectral weight in the low-energy region, which agrees well with the present calculation. Two arrows in panel (b) indicate generic dips in the spectral weight, related to peaks in the self-energy.

E. Peak-dip-hump feature
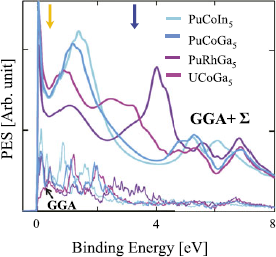
The duality of itinerant and localized quasiparticles manifests itself as a prominent peak-dip-hump feature in the momentum-integrated spectral function or DOS: I PES = <A( k , ω)>nF (ω), where we neglect for simplicity any matrix element effects. The results are shown in Fig. 6. As we move across the series from PuCoIn5 to UCoGa5, the spectral weight redistribution gradually decreases. This suggests that spin fluctuations play a lesser role in UCoGa5 than in the isostructural Pu-115 compounds. We show a direct comparison of our theory with available experimental data in Fig. 10 below.
Computed PES spectra for various Pu-115 and U-115 compounds. All theoretical spectra have been renormalized by the same scaling factor. The GGA DOS is plotted with a much reduced normalization [taken from Fig. 1(b)] for comparison. Two arrows indicate generic dips in the spectral weight, related to peaks in the self-energy in Fig. 4.

IV. COMPARISON WITH EXPERIMENTS
A. Angle-resolved photoemission spectroscopy
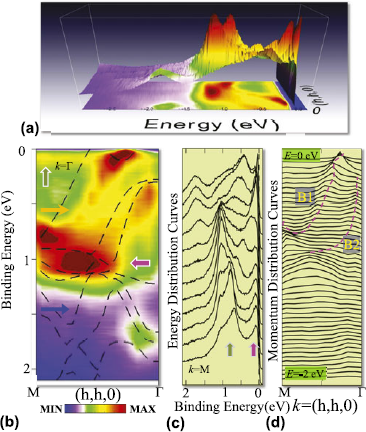
The subsequent ARPES measurementReference Das, Durakiewicz, Zhu, Joyce, Sarrao and Graf 16 in UCoGa5 revealed the anomalous momentum and energy dependence of the electronic dispersions shown in Fig. 7, which is in close agreement with the key features of our predictions. Figures 7(a) and 7(b) show the three-dimensional (3D) and two-dimensional (2D) rendering of the same data, respectively. The dispersion (traces of the intensity peaks), in Fig. 7(b), reveals a drastic departure of the quasiparticle states from the ab initio electronic structure calculations (dashed lines). More importantly, the associated quasiparticle width at the peak positions is significantly momentum and energy dependent. Unlike the renormalized quasiparticle dispersion relation, which is a genuine manifestation of many-body correlation effects, the anomaly in the lifetime may have many intrinsic and extrinsic causes and is more difficult to assign to a particular mechanism.Reference Yeh and Lindau 61 We notice that while bare GGA bands are present in the entire energy and momentum region, the spectral intensity is accumulated mainly at two energy scales. As mentioned earlier, this connection between low and high energy scales is analogous to the so-called “waterfall” or high-energy-kink feature observed in single-band cupratesReference Graf, Gweon, McElroy, Zhou, Jozwiak, Rotenberg, Bill, Sasagawa, Eisaki, Uchida, Takagi, Lee and Lanzara 57 – Reference Valla, Kidd, Yin, Gu, Johnson, Pan and Fedorov 59 and Sr2RuO4 Reference Iwasawa, Yoshida, Hase, Shimada, Namatame, Taniguchi and Aiura 62 as compared in Fig. 9, see below. The energy distribution curves (EDCs) of the ARPES intensity at several representative fixed momenta in Fig. 7(c) and momentum distribution curves (MDCs) at several fixed energy points in Fig. 7(d) indicate that the anomaly is markedly different in the energy and momentum space, which is a hallmark feature of correlated electron states. The peaks in the EDCs display prominent dispersionless features at two energy scales marked by arrows. The lowest energy peak persists at all momenta around −80 meV and gradually becomes sharper close to the Γ point. This low-energy feature reveals the formation of the long-lived renormalized quasiparticle. The high-energy feature around −1 eV is considerably broad in both energy and momentum space. In momentum space, it attains a large width, demonstrating that these states are significantly incoherent and are created by spectral weight depletion near −500 meV due to the coupling to spin fluctuations.
Dispersion and measured ARPES spectral function anomaly. (a) 3D intensity map of UCoGa5 along the M → Γ direction (h, h, 0) in the Brillouin zone. (b) Same data plotted as 2D contour map and compared to the corresponding ab initio GGA electronic band structure dispersions (black dashed lines). Arrows indicate characteristic features in the dispersion and spectral weight such as regions of dip or peak (see text). All the ARPES data are collected at the photon energy of 46 eV, with energy resolution better than 20 meV. (c) The EDCs are plotted for fixed momenta. The curves from bottom to top are chosen for equally spaced momentum points from M to Γ. Arrows have same meaning as in (a). (d) MDCs for fixed binding energy. Top to bottom curves are chosen from E = 0 to 2 eV, below the Fermi level. The dashed lines are guide to the eyes for two extracted low-lying dispersions of anomalous character, analyzed in Fig. 2.

B. Experimental self-energy
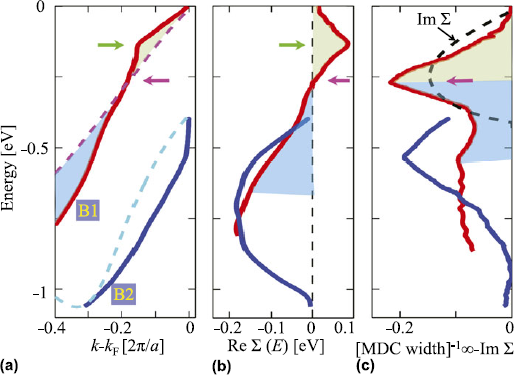
Embedded in the one-electron self-energy is considerable information of the many-body correlation mechanism. In principle, this makes it a very useful quantity to compare with predictions by different theories to identify the appropriate approximation scheme for treating correlation effects. The determination of the self-energy in actinides has so far only been achieved for USb2 Reference Durakiewicz, Riseborough, Olson, Joyce, Oppeneer, Elgazzar, Bauer, Sarrao, Guziewicz, Moore, Butterfield and Graham 63 and UCoGa5.Reference Das, Durakiewicz, Zhu, Joyce, Sarrao and Graf 16 Here, we illustrate how to extract two quasiparticle dispersion branches by tracing the locii of the MDC peaks as shown in Fig. 8(a). To study the dispersion renormalization, the common practice is to observe the departure of the dispersion with respect to the nearest LDA one, ξ n k (shown by dashed lines of same color). A visual comparison reveals a sharp kink in the metallic actinide UCoGa5, i.e., a change in the slope of the dispersion. The low-energy kink lies around −130 meV (indicated by green arrow), which is higher than that in cuprates (−70 meV).Reference Lanzara, Bogdanov, Zhou, Kellar, Feng, Lu, Yoshida, Eisaki, Fujimori, Kishio, Shimoyama, Nodak, Uchidak, Hussain and Shen 64 On the other hand, the kink observed in the actinide USb2 is at much lower energy and thus is most likely caused by electron–phonon coupling.Reference Durakiewicz, Riseborough, Olson, Joyce, Oppeneer, Elgazzar, Bauer, Sarrao, Guziewicz, Moore, Butterfield and Graham 63 Furthermore, the high-energy kink (−1 eV) poses a ubiquitous anomaly in the 115s similar to the cuprates.Reference Graf, Gweon, McElroy, Zhou, Jozwiak, Rotenberg, Bill, Sasagawa, Eisaki, Uchida, Takagi, Lee and Lanzara 57 – Reference Valla, Kidd, Yin, Gu, Johnson, Pan and Fedorov 59 On the basis of these comparisons, we deduce that the present kink lies well above the phonon energy scale of ∼30 meV for metallic UCoGa5 Reference Piekarz, Parlinski, Jochym, Olés, Sanchez and Rebizant 52 and hitherto provides a novel system to study the evolution of spin fluctuations in f-electron systems.
The real and imaginary parts of the experimental self-energy. (a) Two low-lying dispersions derived from the peak positions of the MDCs [Fig. 7(c)] along M → Γ. The momentum axis is offset by k F for band B1. Dashed lines of same color give the ab initio dispersion (offset from their corresponding Fermi momenta values), which helps to expose the degree of anomaly for each dispersion with respect to their linear dispersion features. (b) The real part of the self-energy measures the deviation of each dispersion curve in (a) from its corresponding GGA value. Green arrow marks the location of the low-energy kink. (c) The inverse of the MDCs width obtained with the help of Fig. 7(c), which is proportional to the imaginary part of the self-energy, when the extrinsic background contribution is negligible. Different color fillings in all three curves (corresponding to band B1) separate the characteristic energy scale (marked by magenta arrows). The imaginary part attains a peak at the energy where the real part of the self-energy changes sign. To demonstrate this behavior, we calculate Im Σ from Re Σ in (b) using the Kramers–Kronig relation and plot as black dashed line in (c). Reproduced from Ref. Reference Das, Durakiewicz, Zhu, Joyce, Sarrao and Graf16.

The experimental values of the real and imaginary parts of the self-energy can be derived from the ARPES spectra by tracing the peak positions of each band
k
n
as Σ′(
k
n
, ω) = ω −
 ${\rm{\xi }}_k^n $
, Σ′(
k
, ω) ∝ 1/FWHMMDC. Here,
 ${\rm{\xi }}_k^n $
is the nth GGA dispersion with respect to its corresponding Fermi energy. The obtained results are shown in Figs. 8(b) and 8(c), respectively, for the two extracted bands shown in Fig. 8(a). Taking advantage of the high-precision data, we expose two energy scales in Σ′ (marked by arrows), which are intrinsically linked to the quasiparticle lifetime τ = ħ/(2Σ′). In addition to the peak at the kink energy, Σ′ possesses a sign reversal around −260 meV. This is an important feature, which imposes the constraint that the corresponding Σ″ should yield a peak exactly at the same energy, due to the Kramers–Kronig relationship. This is indeed in agreement with our findings for UCoGa5 in Fig. 8(c), which exhibits a sharp peak in the extracted broadening, exactly where Σ′ changes sign (marked by green arrow). It is worthwhile to mention that in ARPES measurements, the extrinsic source of quasiparticle broadening is typically known to be quasilinear in energy,Reference Shirley
65
while the presence of a peak is a definitive signature of the intrinsic origin of broadening.
C. Comparison with cuprates and ruthenates
In Fig. 9, we demonstrate the similarity of the dispersion anomaly in very different systems. The basic concept underlying the lineshape of quasiparticle dispersions is that the mass renormalization is strongly energy dependent, and there exists a crossover where the renormalization changes from positive to negative. This part is illustrated by drawing straight lines on top of the ARPES spectral function and studying how they deviate from an idealized linear dispersion connecting the top and bottom of the experimental lineshape. We find a surprisingly similar behavior in all three systems, and following the self-energy analysis illustrated in Fig. 8, we can easily see that the extracted real and imaginary parts of the self-energy have similar characteristics as obtained in Figs. 8(b) and 8(c). This means, Σ′ = 0 at the crossover energies where Σ″ peaks, and the dispersion below and above this energy scale is renormalized toward and away from the Fermi level, respectively. Without loss of generality, we attribute the origin of this peak in Σ″ to be due to strong fluctuations (most likely due to spin fluctuations as in actinidesReference Das, Zhu and Graf 6 and cupratesReference Markiewicz, Sahrakorpi and Bansil 50 , Reference Basak, Das, Lin, Nieminen, Lindroos, Markiewicz and Bansil 60 ), although the microscopic origin of fluctuations can be different. These two energy scales yield a ubiquitous peak-dip-hump feature, which is present in a number of actinide systems.
The ARPES data for various compounds, as different as nonsuperconducting actinide UCoGa5,Reference Das, Durakiewicz, Zhu, Joyce, Sarrao and Graf 16 high-temperature cuprate superconductor Bi2Sr2CuO8 +δ,Reference Ophale, Elgazzar, Koepernik and Oppeneer 55 and odd parity superconductor Sr2RuO4.Reference Iwasawa, Yoshida, Hase, Shimada, Namatame, Taniguchi and Aiura 62 The cyan dashed line guides the eyes on how the experimental dispersion deviates from the linear bare dispersion (blue dashed line). Arrows indicate various characteristic energy scales (see text).

D. Photoemission spectroscopy
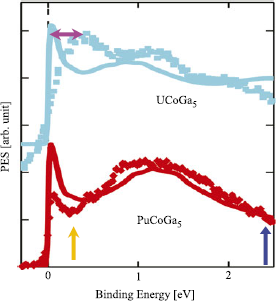
The angle-integrated photoemission spectroscopy can directly probe the DOS of the filled states below the Fermi level to the extent that matrix element effects are not important.Reference Basak, Das, Lin, Nieminen, Lindroos, Markiewicz and Bansil 60 To validate our results, we directly compare them with available data for PuCoGa5 Reference Joyce, Wills, Durakiewicz, Butterfield, Guziewicz, Sarrao, Morales, Arko and Eriksson 17 , Reference Joyce, Durakiewicz, Graham, Bauer, Moore, Mitchell, Kennison, Martin, Roy and Scuseria 18 at 77 K and x-ray photoemission data of UCoGa5 Reference Troc, Bukowski, Sukowski, Misiorek, Morkowski, Szajek and Chekowska 66 in Fig. 10. The theory data are reproduced from Fig. 6. Our computed results are in good agreement with the PES experiments, revealing a ubiquitous presence of the peak-dip-hump feature or equivalently of electronic hot spots in the momentum energy space of actinides. Near E F, the experiment shows a broader feature than theory with less spectral weight, which may be related to experimental resolution and theoretical approximations. The present calculation slightly underestimates the dip in the spectral weight, which stems from the neglect of orbital matrix elements, charge and other fluctuations, as well as the quasiparticle approximation in the self-consistency scheme of the calculation of the self-energy. The key result is that both the spectral weight loss at low energy and high energy are well captured by the spin fluctuation model.
Computed angle-integrated photoemission spectra (solid lines) for two actinide materials compared with corresponding experimental data (symbols of same color). The results for UCoGa5 are shifted vertically upward by arbitrary value for visualization. The relative intensity difference between peak and hump depends on various experimental conditions such as photon energy and background. The experimental data of UCoGa5 are obtained via x-ray photoemission spectroscopy,Reference Troc, Bukowski, Sukowski, Misiorek, Morkowski, Szajek and Chekowska 66 whereas that for PuCoGa5 is from synchrotron data.Reference Joyce, Wills, Durakiewicz, Butterfield, Guziewicz, Sarrao, Morales, Arko and Eriksson 17 , Reference Joyce, Durakiewicz, Graham, Bauer, Moore, Mitchell, Kennison, Martin, Roy and Scuseria 18

The PES data of other actinides, such as α- and δ-phase-stabilized PuReference Wills, Eriksson, Delin, Andersson, Joyce, Durakiewicz, Butterfield, Arko, Moore and Morales 67 – Reference Shim, Haule and Kotliar 70 and UNiGa5,Reference Durakiewicz and Joyce 71 also exhibit similar peak-dip-hump features. These results suggest that intermetallic actinide compounds and elemental Pu reside in the intermediate Coulomb interaction regime.Reference Das, Zhu and Graf 6 In addition, it should be noted that the intermediate Coulomb interaction scenario also successfully explains many salient features of high-temperature copper oxide superconductors,Reference Das, Markiewicz and Bansil 5 , Reference Das, Markiewicz and Bansil 72 where spin fluctuations are thought to be important.
E. Fermiology and dHvA oscillations
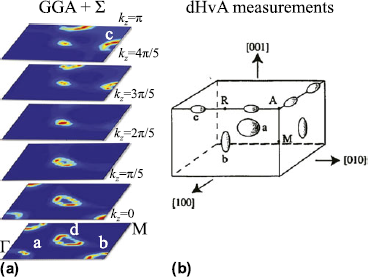
The fermiology of the self-energy dressed FS topology is presented for several k z cuts in Fig. 11(a). We note that the self-energy corrections in the GGA + Σ calculation of the dispersion do not make a dramatic change to the overall GGA FS maps (shown in Fig. 2). The GGA-computed FS maps are in accord with dHvA measurements, except for the tube-like FS around (π/2, π/2, 0).Reference Ikeda, Tokiwa, Okubo, Haga, Yamamoto, Inada, Settai and Onuki 73 In the kz = 0 plane, we obtain three FSs: at the Γ point (labeled “a” FS), at (π, 0, 0) (labeled “b” FS), and around (π/2, π/2, 0) connecting the “Σ” to “S” points (labeled “d” FS), and their equivalent points in the Brillouin zone. In the kz = π plane, the “a” and “b” FSs disappear, whereas a fourth FS “c” reaches maximum size. After including the spin fluctuation interaction in the GGA + Σ calculation, the spectral weight across each FS varies, but the general shape and position of each FS remains very much the same, satisfying the Luttinger theorem for conserved FS volume. Only the tube-shaped “d” pocket changed from closed to open orbits along the kz direction due to the small shift of the chemical potential to lower energies. This sensitivity to small changes in the electronic structure calculation is consistent with earlier reports of closed versus open tube-like pockets.Reference Ophale, Elgazzar, Koepernik and Oppeneer 55 , Reference Maehira, Hotta, Ueda and Hasegawa 56 The “a,” “b,” and “c” pockets, seen in the dHvA measurements, are in qualitative agreement with electronic structure calculations, as previously discussed by Opahle et al.,Reference Ophale, Elgazzar, Koepernik and Oppeneer 55 while the “d” FS was not observed. It is possible that the open loop pocket “d” was masked by the relatively broad fundamental frequency of the “a” orbit. A targeted search for the associated dHvA oscillation should resolve the so far missing tube-shaped pocket.
FS maps and dHvA results of UCoGa5. (a) FS cuts at six representative kz values after including the self-energy (Σ) correction. (b) Measured FS pockets from dHvA oscillations.Reference Durakiewicz and Joyce 71 In the GGA + Σ and dHvA data, all the FS pieces labeled “a,” “b,” and “c” are well reproduced, while the large tube-like FS “d” obtained in our calculation around (π/2, π/2, 0) is not seen in the dHvA experiment. Reproduced from Ref. Reference Das, Durakiewicz, Zhu, Joyce, Sarrao and Graf16.

V. DISCUSSION
It is important to note that all energy scales of the renormalization and corresponding spectral weight of electronic dispersion are related to each other. In other words, the spin fluctuation induced anomaly at energies as high as 500 meV, is also responsible for mass renormalization at low energy, and thus in turn affects superconductivity. To see that connection, we estimate the coupling constant (mass renormalization) and compare with experiments.
A. Spin fluctuation coupling constant and implication to superconductivity
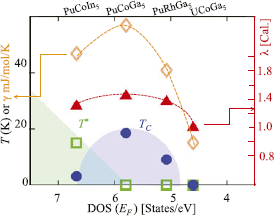
We calculate the spin fluctuation coupling constant λ from the energy derivative of Σ′. In the low-energy region, we obtain Σ′(ξ k ) ≈ −λξ k = (1 − Z −1)ξ k . The coupling constant λ follows the same material dependence as T c across the series from PuCoIn5 → UCoGa5 with its maximum for PuCoGa5. Although λ is quite large for PuCoIn5, its T c is strongly suppressed probably due to competition with a significantly large impurity phase of PuIn3. In addition, Bauer et al.Reference Bauer, Altarawneh, Tobash, Gofryk, Ayala-Valenzuela, Mitchell, McDonald, Mielke, Ronning, Griveau, Colineau, Eloirdi, Caciuffo, Scott, Janka, Kauzlarich and Thompson 13 reported a three to four times larger spin fluctuation energy scale between PuCoIn5 and PuCoGa5 by extracting a spin fluctuation temperature from the Sommerfeld coefficient or maximum in resistivity. They further concluded that PuCoIn5 exhibits more localized 5f electron physics due to the 28% enlarged unit cell.Reference Bauer, Altarawneh, Tobash, Gofryk, Ayala-Valenzuela, Mitchell, McDonald, Mielke, Ronning, Griveau, Colineau, Eloirdi, Caciuffo, Scott, Janka, Kauzlarich and Thompson 13 In contrast, our self-consistent self-energy calculations do not provide any evidence for these interpretations. We do not see noticeably different spin fluctuation coupling constants between both materials, see Fig. 12. Therefore, the origin of these discrepancies may be tied to the magnetic properties of the impurity phase PuIn3.
Experimental values of T c and the antiferromagnetic transition T * as a function of the GGA DOS at E F (theory) and compared with computed values of the spin fluctuation coupling constant λ and corresponding Sommerfeld coefficient γ. Reproduced from Ref. Reference Das, Zhu and Graf6.

Encouraged by the aforementioned analysis, we now focus on delineating the nature of the elementary excitations responsible for this anomaly. As mentioned before, both the energy scales and the strength of electron–phonon interactionReference Ophale, Elgazzar, Koepernik and Oppeneer 55 , Reference Maehira, Hotta, Ueda and Hasegawa 56 are insufficient to capture our observed dispersion anomalies. We demonstrated that the electron–electron interaction due to dynamical spin fluctuations of exchanged bosons can describe the data. In UCoGa5, strong spin–orbit coupling from relativistic effects enables substantial spin fluctuations whose feedback results in an increase of the electron mass and a shortening of the quasiparticle lifetime.
B. Comparison with measured Sommerfeld coefficient
1. PuCoGa5
Next, we compare our estimation of λ in PuCoGa5 with experimental values. Experimentally, an estimate of λ at the Fermi level is obtained by comparing the measured Sommerfeld coefficient with respect to its noninteracting value, γ ≈ (1 + λ)γ0. For PuCoGa5, we find a GGA value of γ0 = 20.5 mJ/(mol K2), which leads to the renormalized theoretical value of γ = 54 mJ/(mol K2) with λ = 1.4. This calculated Sommerfeld coefficient is only slightly less than the corresponding experimental value of 77 mJ/(mol K2),Reference Sarrao, Morales, Thompson, Scott, Stewart, Wastin, Rebizant, Boulet, Colineau and Lander 11 suggesting that there is room for additional phonon fluctuations of about λep ∼ 0.8; a value which is very close to the electron–phonon coupling constant deduced by first-principles calculations (λep = 0.7).Reference Piekarz, Parlinski, Jochym, Olés, Sanchez and Rebizant 52 , Reference Metoki, Kaneko, Raymond, Sanchez, Piekarz, Parlinski, Oles, Ikeda, Matsuda, Haga, Onuki and Lander 74 Note that our calculated coupling constant of λ = 1.4 for PuCoGa5 is smaller than the calculated value of 2.5 obtained within the LDA + DMFT approximation.Reference Shick, Rusz, Kolorenc, Oppeneer and Havela 43
2. UCoGa5
Following the same procedure as for PuCoGa5, we obtain for UCoGa5 the theoretical estimate of the spin fluctuation coupling constant λ = 1. The experimental values of γ are between γ = 10 and 21 mJ/(mol K2),Reference Moreno, Bauer, Sarrao, Hundley, Thompson and Fisk 8 , Reference Noguchi and Okuda 75 while the GGA calculated value is γ0 = 5.8 mJ/(mol K2). The theoretical Sommerfeld coefficient agrees well with the literatureReference Ophale, Elgazzar, Koepernik and Oppeneer 55 , Reference Maehira, Hotta, Ueda and Hasegawa 56 and thus gives an experimental estimate of λ ≈ 0.7–2.6. Therefore, the combination of the calculated spin fluctuation couplingReference Piekarz, Parlinski, Jochym, Olés, Sanchez and Rebizant 52 , Reference Metoki, Kaneko, Raymond, Sanchez, Piekarz, Parlinski, Oles, Ikeda, Matsuda, Haga, Onuki and Lander 74 constant of λ = 1.0 with the low-energy electron–phonon coupling constant, same λep ∼ 0.7 as for PuCoGa5, adequately describes the observed modest electronic mass renormalization in UCoGa5.
VI. SUMMARY AND CONCLUSION
Among the several computational advantages that the intermediate Coulomb-U coupling method provides, is its controlled perturbative approach for spin fluctuations to actinides. In this work, we focused on spin fluctuations, but the formulation is more general to account for charge and pair fluctuations as well. An important outcome of this study is the agreement of the self-consistently calculated results with various photoemission, dHvA, and heat capacity measurements. We conclude with three key observations: (i) the perturbative approach requires that the interaction part or the value of the Coulomb potential U must be smaller than the noninteracting electronic bandwidth D. Since we start with the first-principles band structure, we can choose a value of U up to a value below the GGA bandwidth D as long as it does not introduce an instability in the RPA susceptibility to an ordered ground state. (ii) The mass renormalization of the quasiparticle obtained via the self-energy Σ at the Fermi level is related to the shape of Σ″, i.e., to the quasiparticle lifetime due to the Kramers–Kronig relationship. The energy scale and the strength of Σ″ are the key factors that determine the characteristics of the correlation effects of a given material. In the weak-coupling regime, the peak height of Σ″ is typically less pronounced and thus often gives a negligible amount to the width of the quasiparticle lineshape. As this study has shown, the quasiparticle states near the Fermi level in the 115 actinides can be well described within the itinerant picture with a modest mass renormalization, consistent with the Fermi liquid theory and spin fluctuations. (iii) In strong-coupling approaches like the DMFT method, the peak in Σ″ is pronounced, thus it may lead to an overestimation of the spectral weight loss in the low-energy region. However, more importantly, single-site DMFT lacks the momentum dependence of the self-energy compared to the GW method.
In summary, the intermediate Coulomb-U coupling method offers an opportunity to address the complex nature of the dynamic band renormalization in actinides. This is not unexpected for materials with itinerant electrons since similar theories based on the coupling between spin fluctuations and electrons are among the leading contenders for explaining the origin of high-temperature superconductivity,Reference Scalapino, Loh and Hirsch 76 itinerant magnetism, and other emergent states of matter in d and f electron systems.Reference Moriya 7 , Reference Moriya and Takimoto 77 In addition, spin fluctuations in 5f electron systems are a manifestation of relativistic effects due to spin–orbit split states of order ∼0.5 eV. In fact, spin–orbit coupling may provide a novel electronic knob to tune the interaction strength and characteristic frequency of the mediating boson. We hope that our results for the self-energy will motivate efforts to identify generic dispersion anomalies and “waterfall” physics in a larger class of actinide and heavy fermion compounds.
In the future, it will be interesting to extend the intermediate coupling calculation to a wider range of the 115 familyReference Grin, Rogl and Hiebl 14 , Reference Ikeda, Tokiwa, Okubo, Yamada, Matsuda, Inada, Settai, Yamamoto, Haga and Onuki 15 , Reference Scalapino, Loh and Hirsch 76 and the so-called 122 familyReference Palstra, Menovsky, van den Berg, Dirkmaat, Kes, Nieuwenhuys and Mydosh 79 , Reference Trovarelli, Geibel, Mederle, Langhammer, Grosche, Gegenwart, Lang, Sparn and Steglich 80 of actinides to understand and predict their correlated electronic structure and anomalous ground state properties. It should be noted that the unsolved mysteries in the 122 materials, like the “hidden order” phase in URu2Si2 Reference Held 38 , Reference Das 81 or the unusual FS reconstruction in YbRh2Si2,Reference Paschen, Lühmann, Wirth, Gegenwart, Trovarelli, Geibel, Steglich, Coleman and Si 82 call for models that are sophisticated enough to incorporate the high-energy fluctuation phenomena and strong spin–orbit coupling for generating spectral weight “hot spots,” which are responsible for the emergence of broken symmetry phasesReference Das 81 in the low-energy region.
ACKNOWLEDGMENTS
We thank T. Durakiewicz, J.J. Joyce, A.V. Balatsky, R.S. Markiewicz, A. Bansil, P. Werner, P. Oppeneer, F. Ronning, and E.D. Bauer for discussions. Work at the Los Alamos National Laboratory was supported by the U.S. DOE under Contract No. DE-AC52-06NA25396 through the LDRD Program and BES (T.D.), Division of Materials Sciences and Engineering. We acknowledge computing allocations by NERSC through the Office of Science (BES) under Contract No. DE-AC02-05CH11231.