1. Introduction
In modern sedimentary systems, phosphogenesis is closely linked to upwelling conditions along shelf environments such as the coast of Namibia and South Africa, with organic matter being the most important carrier for phosphorus delivery to the sediments (Follmi, Reference Follmi1996). Phosphogenesis is also known to occur in non-upwelling environments where Fe-redox pumping plays an important role in phosphorus transportation from the redox-stratified water column to sediments (Heggie et al. Reference Heggie, Skyring, Obrien, Reimers, Herczeg, Moriarty, Burnett and Milnes1990; Nelson, Pufahl & Hiatt, Reference Nelson, Pufahl and Hiatt2010). For both environments, phosphogenesis is known to occur near the sediment–water interface (Follmi, Reference Follmi1996). Activities of sulphur bacteria, which are known to mediate phosphorite precipitation in modern marine sediments (Schulz & Schulz, Reference Schulz and Schulz2005), may also play a role in the formation of ancient phosphorites (Bailey et al. Reference Bailey, Joye, Kalanetra, Flood and Corsetti2007, Reference Bailey, Corsetti, Greene, Crosby, Liu and Orphan2013).
Sedimentary phosphate rocks mainly consist of crypto- to microcrystalline carbonate fluorapatite (CFA), which can incorporate abundant rare earth elements (REE) during their formation (McArthur & Walsh, Reference McArthur and Walsh1984; Kidder, Krishnaswamy & Mapes, Reference Kidder, Krishnaswamy and Mapes2003). They may therefore record information about the REE distribution in the seawater/porewater/sediment system during their formation (Shields & Stille, Reference Shields and Stille2001; Chen et al. Reference Chen, Dong, Qi, Chen and Chen2003; Jiang et al. Reference Jiang, Zhao, Chen, Yang, Yang and Ling2007; Zhu et al. Reference Zhu, Jiang, Yang, Pi, Ling and Chen2014; Xin et al. Reference Xin, Jiang, Yang, Wu and Pi2015, Reference Xin, Jiang, Yang, Wu and Pi2016; Alibert, Reference Alibert2016). Additionally, REE can be important proxies for the reconstruction of the depositional and diagenetic history of phosphate rocks (e.g. Jiang et al. Reference Jiang, Zhao, Chen, Yang, Yang and Ling2007; Joosu et al. Reference Joosu, Lepland, Kirsimäe, Romashkin, Roberts, Martin and Črne2015; Alibert, Reference Alibert2016; Auer et al. Reference Auer, Hauzenberger, Reuter and Piller2016; Xin et al. Reference Xin, Jiang, Yang, Wu and Pi2016).
Previous studies on REE in phosphate rocks usually employed a leaching procedure, whereby the phosphate fraction can be leached using diluted hydrochloric acid. The results therefore reflect the average or bulk REE characteristics of the phosphate rocks. In contrast, laser ablation inductively coupled plasma mass spectrometry (LA-ICP-MS) allows in situ micro-sampling of specific areas and/or minerals, and can therefore better trace variations of chemical composition on the micro scale. The technique provides valuable information concerning the chemical variability and therefore the potential processes and conditions during the formation of these sedimentary rocks (Joosu et al. Reference Joosu, Lepland, Kirsimäe, Romashkin, Roberts, Martin and Črne2015; Alibert, Reference Alibert2016).
The late Neoproterozoic–Cambrian phosphogenic event, which represents one of the two oldest major phosphogenic events in Earth's history, is considered to have close links to the dramatic changes in the oceanic, atmospheric and biogenic systems during this period (e.g. high rate of primary productivity, accumulation of atmospheric oxygen, the rise of complex multicellular life) (Papineau, Reference Papineau2010; Fan, Wen & Zhu, Reference Fan, Wen and Zhu2016; Li, Zhu & Chu Reference Li, Zhu and Chu2016; Qiao et al. Reference Qiao, Lang, Peng, Jiang, Chen, Huang and Shen2016). The Ediacaran Doushantuo Formation at Weng'an, Guizhou Province, South China hosts two phosphate-rich intervals known as the Lower Phosphorite bed (LPB) and the Upper Phosphorite bed (UPB). In particular, the UPB hosts well-preserved phosphatized microfossils such as animal embryos, acritarchs, sponges and multicellular algae which carry information on the early evolution of cellularly differentiated eukaryotes and animals (Xiao, Zhang & Knoll, Reference Xiao, Zhang and Knoll1998; Zhang et al. Reference Zhang, Yin, Xiao and Knoll1998; Xiao & Knoll, Reference Xiao and Knoll2000; Chen et al. Reference Chen, Bottjer, Davidson, Dornbos, Gao, Yang, Li, Li, Wang, Xian, WU, Hwu and Tafforeau2006; Zhou et al. Reference Zhou, Xie, McFadden, Xiao and Yuan2007; Xiao et al. Reference Xiao, Muscente, Chen, Zhou, Schiffbauer, Wood, Polys and Yuan2014; Yin et al. Reference Yin, Zhu, Davidson, Bottjer, Zhao and Tafforeau2015). In order to understand the link between the evolution of life and palaeoenvironment, geochemical studies including carbon isotope, sulphur isotope and major, trace and rare earth elements analyses were carried out on the sedimentary rocks (e.g. carbonates, shales, phosphorites) of the Doushantuo Formation (e.g. Chen et al. Reference Chen, Dong, Qi, Chen and Chen2003; Shields et al. Reference Shields, Kimura, Yang and Gammon2004; Zhou & Xiao, Reference Zhou and Xiao2007; Zhu, Zhang & Yang, Reference Zhu, Zhang and Yang2007; Ling et al. Reference Ling, Chen, Li, Wang, Shields-Zhou and Zhu2013; Li, Zhu & Chu, Reference Li, Zhu and Chu2016; Xin et al. Reference Xin, Jiang, Yang, Wu and Pi2016). However, most of the previously published research has focused on the bulk composition of the sedimentary rocks. In the present study, we carried out an in situ analysis of rare earth elements in the phosphatic grains including phosphatized microfossils and phosphatic clasts from the UPB at Weng'an, Guizhou Province, South China. The purpose of this study is to improve our understanding of the REE geochemistry during deposition (e.g. redox state of bottom seawater) as well as during post-depositional diagenetic alteration processes.
2. Geological setting and samples
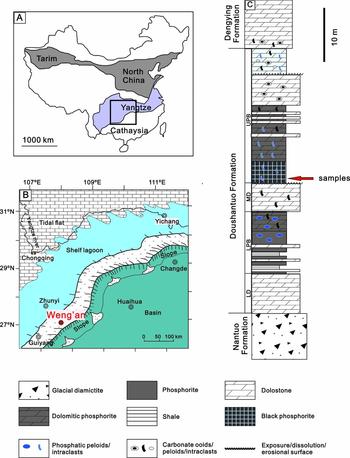
Following the termination of the global Marinoan glaciation at c. 635 Ma, the Ediacaran succession in South China was deposited on a passive continental margin on the Yangtze platform (Zhu et al. Reference Zhu, Zhang, Steiner, Yang, Li and Erdtmann2003; Zhu, Zhang & Yang, Reference Zhu, Zhang and Yang2007; Jiang et al. Reference Jiang, Shi, Zhang, Wang and Xiao2011). Sedimentary facies analyses and sequence studies for multiple Ediacaran sections in South China show a variety of depositional environments from shallow to deep water (Zhu, Zhang & Yang, Reference Zhu, Zhang and Yang2007; Vernhet & Reijmer, Reference Vernhet and Reijmer2010; Jiang et al. Reference Jiang, Shi, Zhang, Wang and Xiao2011). Palaeogeographic reconstruction studies suggest that the Yangtze platform evolved into a rimmed shelf soon after the Marinoan glaciation, with a barrier separating the shelf lagoon from the open ocean (Fig. 1). The palaeogeographic configuration may have lasted until deposition of the lower part of the Ediacaran Dengying Formation (Vernhet & Reijmer, Reference Vernhet and Reijmer2010; Jiang et al. Reference Jiang, Shi, Zhang, Wang and Xiao2011). The Doushantuo Formation at Weng'an is interpreted to be deposited on a distal side of the shelf lagoon most likely within the shelf margin shoal complex (Fig. 1; Jiang et al. Reference Jiang, Shi, Zhang, Wang and Xiao2011).
(a) Tectonic outline of China showing the main tectonic blocks, including the Yangtze Block in the southern half of the country (Jiang et al. Reference Jiang, Shi, Zhang, Wang and Xiao2011). (b) Depositional environment (rectangle in (a)) of the Doushantuo Formation at Weng'an (Jiang et al. Reference Jiang, Shi, Zhang, Wang and Xiao2011). (c) Simplified stratigraphic column of the Doushantuo Formation at Weng'an (Xiao et al. Reference Xiao, Knoll, Yuan and Pueschel2004), which highlights the lithological characteristics of the Lower Dolomite (LD), the Lower Phosphorite Bed (LPB), the Middle Dolomite (MD) and the Upper Phosphorite Bed (UPD).

The stratigraphy of the Doushantuo Formation at Weng'an has been described in several publications (e.g. Zhou et al. Reference Zhou, Xie, McFadden, Xiao and Yuan2007; Zhu, Zhang & Yang, Reference Zhu, Zhang and Yang2007; Xiao et al. Reference Xiao, Muscente, Chen, Zhou, Schiffbauer, Wood, Polys and Yuan2014). The Doushantuo Formation overlies the Cryogenian diamictite of the Nantuo Formation and underlies the Ediacaran Dengying carbonate (Fig. 1). It can be further divided into four members in ascending order (Fig. 1). The first member, known as the Lower Dolomite member (LD), consists of thickly bedded dolostone. The LD is followed by the Lower Phosphorite bed (LPB) that consists of thick, interbedded shale and dolostone with banded and laminated phosphorite. The Middle Dolomite member (MD) overlies the LPB, and is composed of massive dolostone with a karstic surface developing at the top (Zhu, Zhang & Yang, Reference Zhu, Zhang and Yang2007). The last member, the Upper Phosphorite bed (UPB), begins with a 1–3 m thick, black granular phosphorite unit, followed by dolomitic phosphorite in the middle and granular phosphatic dolostone with phosphorite bands, as well as thinly bedded dolostone interbedded with thin layers of phosphorite on the top (Zhu, Zhang & Yang, Reference Zhu, Zhang and Yang2007).
Previous geochronlogical studies have been conducted on the UPB, and so far three Pb–Pb dates have been reported from this unit. Phosphorites from the upper and the lower part of the UPB yield Pb–Pb ages of 576±14 Ma and 599±4 Ma, respectively (Fig. 1; Barfod et al. Reference Barfod, Albarede, Knoll, Xiao, Telouk, Frei and Baker2002; Chen et al. Reference Chen, Dong, Zhu and Chen2004); black shales from the bottom of the UPB yield a Pb–Pb age of 572±36 Ma (Fig. 1; Chen et al. Reference Chen, Jiang, Ling and Yang2009). Despite the large uncertainties for some ages, the ages are compatible with the zircon U–Pb ages (635–551 Ma) obtained from tuff layers of the uppermost and lowermost parts of the Doushantuo Formation in the Three Gorges area, Hubei Province (Condon et al. Reference Condon, Zhu, Bowring, Wang, Yang and Jin2005). So far, no age has been reported from the LPB. Liu et al. (Reference Liu, Yin, Gao, Tang and Chen2009) reported a zircon U–Pb age of 614.0±7.6 Ma from a tuff layer below an exposure surface at the Wangjiagou section c. 50 km NE of the Three Gorges area. The exposure surface can be correlated to the exposure surface at the top of the Middle Dolomite Member at Weng'an (Zhu, Zhang & Yang, Reference Zhu, Zhang and Yang2007). The U–Pb age of 614.0±7.6 Ma therefore represents a maximum age constraint from the UPB, and is consistent within uncertainties with the three Pb–Pb ages at Weng'an.
The famous Weng'an biota is hosted in the UPB. The unit yields abundant animal embryos, acritarchs, sponges and multicellular algae, and is unique for its extraordinary cellular preservation (Xiao, Zhang & Knoll, Reference Xiao, Zhang and Knoll1998; Zhang et al. Reference Zhang, Yin, Xiao and Knoll1998; Xiao & Knoll, Reference Xiao and Knoll2000; Chen et al. Reference Chen, Bottjer, Davidson, Dornbos, Gao, Yang, Li, Li, Wang, Xian, WU, Hwu and Tafforeau2006; Zhou et al. Reference Zhou, Xie, McFadden, Xiao and Yuan2007; Xiao et al. Reference Xiao, Muscente, Chen, Zhou, Schiffbauer, Wood, Polys and Yuan2014; Yin et al. Reference Yin, Zhu, Davidson, Bottjer, Zhao and Tafforeau2015). In contrast, only some unidentifiable pyritized microfossils have been reported in the lower Doushantuo Formation at Weng'an (Xiao & Knoll, Reference Xiao and Knoll2000; Zhou et al. Reference Zhou, Xie, McFadden, Xiao and Yuan2007). The well-preserved Weng'an biota provide crucial information about the early evolution of animals and the early evolution of cellularly differentiated eukaryotes (Xiao et al. Reference Xiao, Muscente, Chen, Zhou, Schiffbauer, Wood, Polys and Yuan2014).
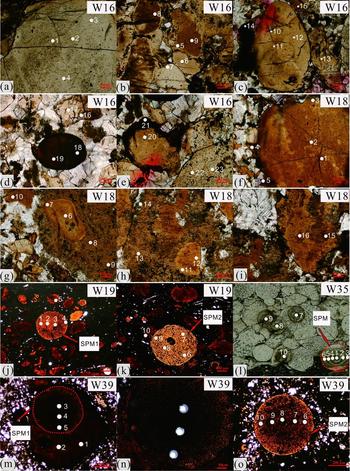
The samples for the present study were collected from the basal part of the black intraclastic phosphorite unit (Fig. 1) at three quarries (Datang, Nanbao, Daxin) of Weng'an. The samples consist of two major types: (1) clastic phosphorites and (2) organical-rich shale with reworked phosphate grains. The clastic phosphorites are composed of >50% phosphatic grains with a dolomitic cement (W-16, W-18, online Supplementary Fig. S1). The phosphatic grains are angular and subangular, suggesting in situ reworking, windowing or minimal transportation (Chen et al. Reference Chen, Dong, Qi, Chen and Chen2003). In the organic-rich shale (W-19, W-35, W-39; online Supplementary Fig. S1), reworked phosphatic grains comprise mixed rounded and sharply angular grains. Silt to fine-grained quartz grains are present. The internal structures of the spherical grains in W-19, W-35 and W-39, shown in Figure 2j–o, are similar to that of phosphatized microfossils from the Doushantuo Formation described in previous studies (e.g. Yin & Gao, Reference Yin and Gao2000; Xiao et al. Reference Xiao, Knoll, Yuan and Pueschel2004; Yin, Bengtson & Yue, Reference Yin, Bengtson and Yue2004). However, diagnostic features (e.g. envelope/wall) are not present in the fossils, prohibiting further classification of the fossils. In Figure 2g (W-18) a phosphatic grain is enclosed by cloudier phosphates, suggesting earlier formation of the enclosed grain compared to its surrounding phosphate. Similarly, in Figure 2m a phosphatized microfossil is enclosed by later phosphate material.
Transmitted light (a–k, m–o) and reflected light (l) photomicrographs of phosphatic grains in samples, with ablation sites marked by white spots. Numbers near the spots correspond to numbering in Table 1 in each sample. The dashed line represents the boundary of analysed spherical phosphatized microfossils. SPM: spherical phosphatized microfossils. The spherical phosphatic grains (SPM1 and SPM of W-19, SPM in W-35, SPM1 and SPM2 of W-39) are phosphatized microfossils. (n) Magnifications of the microfossil in (m). In (g, m), single phosphatic grains are surrounded by later phosphate material.

3. Methodology
Before the LA-ICP-MS analysis, the thin-sections were carefully examined with light microscopy. In each sample, we selected representative phosphatic grains for the laser ablation ICP-MS analysis. To investigate any variation in the REE characteristics within individual grains, we carried out core to rim analysis for some spherical phosphatized microfossils (SPM1 of W-19, SPM of W-35, SPM1, SPM2 of W-39; Fig. 2). For other phosphatic grains, we analysed spots near the centres and the boundaries of the grains (spots 20 and 21 in W-16; spots 1, 5, 6 and 7 in W-18, Fig. 2). All analyses were carried out at the State Key Laboratory for Mineral Deposits Research of Nanjing University. An Element XR SF-ICP-MS (ThermoFisher, Germany), coupled to a FX193 (New Wave, USA) ArF excimer laser equipped with the large format cell, was used for spot analyses. Laser ablation was conducted in a helium atmosphere using a high energy density of 8 J cm–2 and a pulse rate of 10 Hz. Analyses were performed on polished thin-sections for all samples using a spot size of 35 µm. In order to direct the laser to the targeted domains, the mounted samples were scanned and calibrated to stage coordinates using a customized equipment prior to analysis. The measured isotopes include: 139La, 140Ce, 141Pr, 146Nd, 147Sm, 153Eu, 160Gd, 159Tb, 163Dy, 165Ho, 166Er, 165Ho, 166Er, 169Tm, 172Yb and 175Lu. Each time-resolved analysis takes c. 115 s with the first c. 20 s used to measure the gas blank (i.e. background), followed by 70 s of ablation and 25 s of washout time to allow the signal to drop back to the gas blank values. Analysis of every five spots was bracketed by a standard analysis. The NIST standard reference material 612 (glass) was used for calibration. NIST610 standard was used as an external standard for data quality control. Typical sensitivity obtained for the NIST612 glass using a 35 µm spot size was 2×10⁵ counts/s on 238U, with oxides (ThO/Th) kept under 0.8%. Raw mass spectrometry data were reduced using the software Iolite with the trace elements data reduction scheme (Paton et al. Reference Paton, Hellstrom, Paul, Woodhead and Hergt2011). Reproducibility of the NIST612 standard was within 10% for concentration of REE.
The REE concentrations of all analysed spots were normalized to Post-Archean Australian Shales (PAAS) (McLennan, Reference McLennan1989). The PAAS-normalized REE concentrations were then used to calculate Ce and Eu anomalies. Ce anomaly in sedimentary rocks is well accepted as an useful tracer for palaeoredox conditions (e.g. Bau & Dulski, Reference Bau and Dulski1996; Shields & Stille, Reference Shields and Stille2001). The conventional calculation equations for Ce anomaly are Ce/Ce* = 2CeN/(LaN + PrN) or Ce/Ce* = 3CeN/(2LaN+ NdN) (German & Elderfield, Reference German and Elderfield1990; Bau & Dulski, Reference Bau and Dulski1996), where lower subscript N denotes normalization of concentrations against PAAS. In some cases however, the calculated Ce/Ce* using the above equations could be misleading due to excess La (Bau & Dulski, Reference Bau and Dulski1996). To address this problem, Bau & Dulski (Reference Bau and Dulski1996) proposed that Ce/Ce* v. Pr/Pr* plot is diagnostic of genuine Ce anomalies. Recently, Ling et al. (Reference Ling, Chen, Li, Wang, Shields-Zhou and Zhu2013) argued that the criterion proposed by Bau & Dulski (Reference Bau and Dulski1996) might disguise a genuine Ce anomaly for samples having both excess La and a real Ce anomaly. Following Ling et al. (Reference Ling, Chen, Li, Wang, Shields-Zhou and Zhu2013), we therefore adopted an different equation given in Lawrence et al. (Reference Lawrence, Greig, Collerson and Kamber2006) as:
 $$\begin{equation*}
{\rm{Ce/C}}{{\rm{e}}^*} = {{{\rm{C}}{{\rm{e}}_{\rm{N}}}}
/ {\left( {{\rm{P}}{{\rm{r}}_{\rm{N}}}^{\rm{*}}{\rm{P}}{{\rm{r}}_{\rm{N}}}{\rm{/N}}{{\rm{d}}_{\rm{N}}}} \right)}}.
\end{equation*}$$
This calculation avoids using the element La, but uses the nearest neighbouring elements Pr and Nd.
The Eu anomaly (Eu/Eu*) is also calculated following the equations given by Lawrence et al. (Reference Lawrence, Greig, Collerson and Kamber2006):
 $$\begin{equation*}
{\rm{Eu}}/{\rm{E}}{{\rm{u}}^{\rm{*}}} = {{{\rm{E}}{{\rm{u}}_{\rm{N}}}}
/ {{{\left( {{\rm{S}}{{\rm{m}}_{\rm{N}}}{{^{\rm{2}}}^{\rm{*}}}{\rm{T}}{{\rm{b}}_{\rm{N}}}} \right)}^{1/3}}}}.
\end{equation*}$$
As enrichment of the MREE over other REE and REE concentrations in phosphorites are considered as useful tracers for diagenetic processes (Shields & Stille, Reference Shields and Stille2001; Jiang et al. Reference Jiang, Zhao, Chen, Yang, Yang and Ling2007), LaN/SmN and YbN/SmN are calculated and used for cross plots of total REE v. LaN/SmN, total REE v. YbN/SmN and SmN v. YbN/SmN. Meanwhile, in order to evaluate the effects of diagenesis on our samples, a cross plot of the LaN/SmN v. LaN/YbN ratios proposed by Reynard, Lécuyer & Grandjean (Reference Reynard, Lécuyer and Grandjean1999) is used.
4. Results
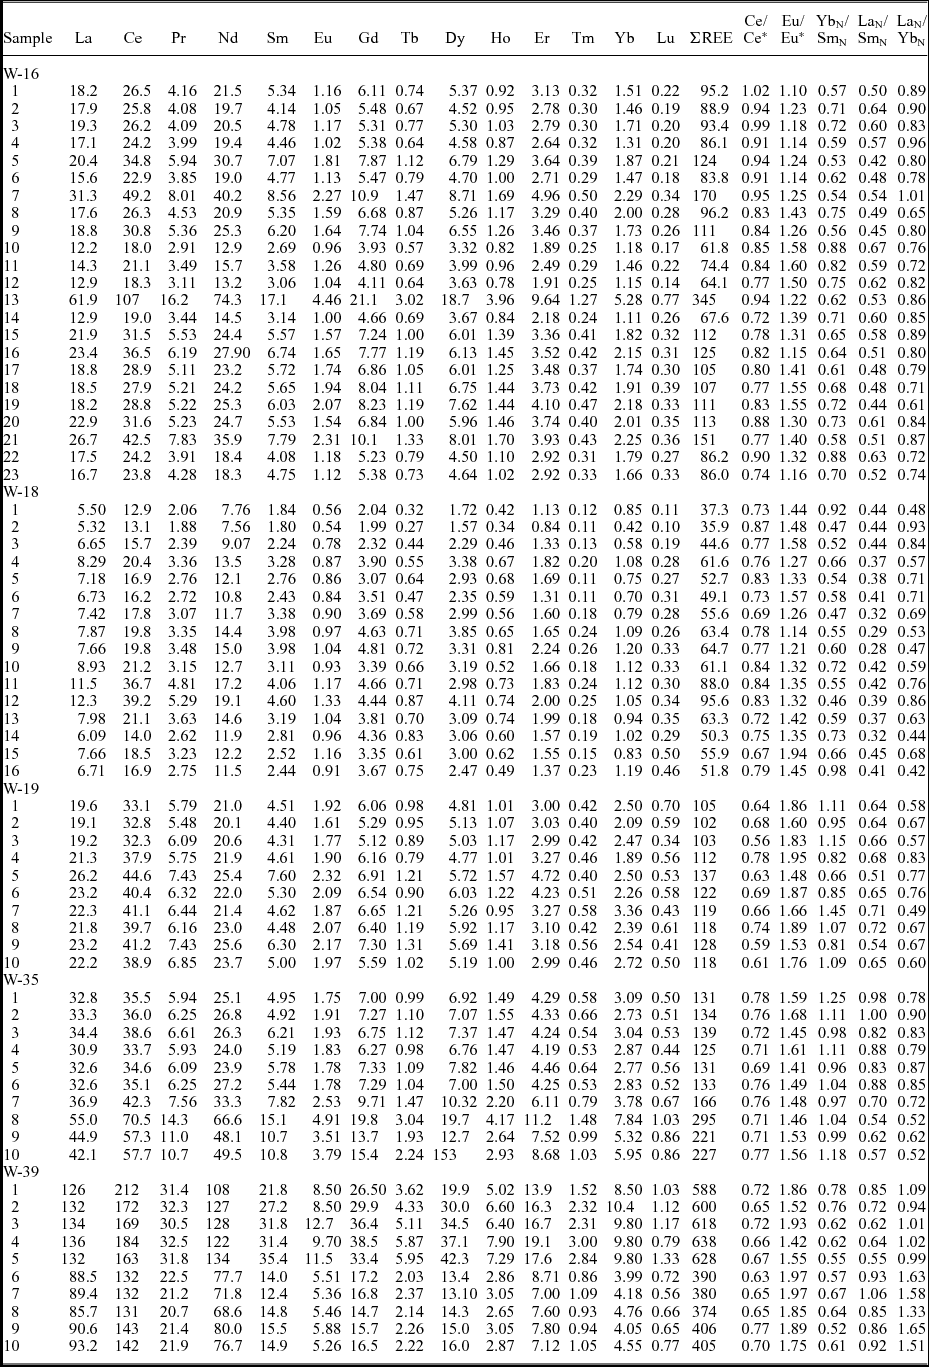
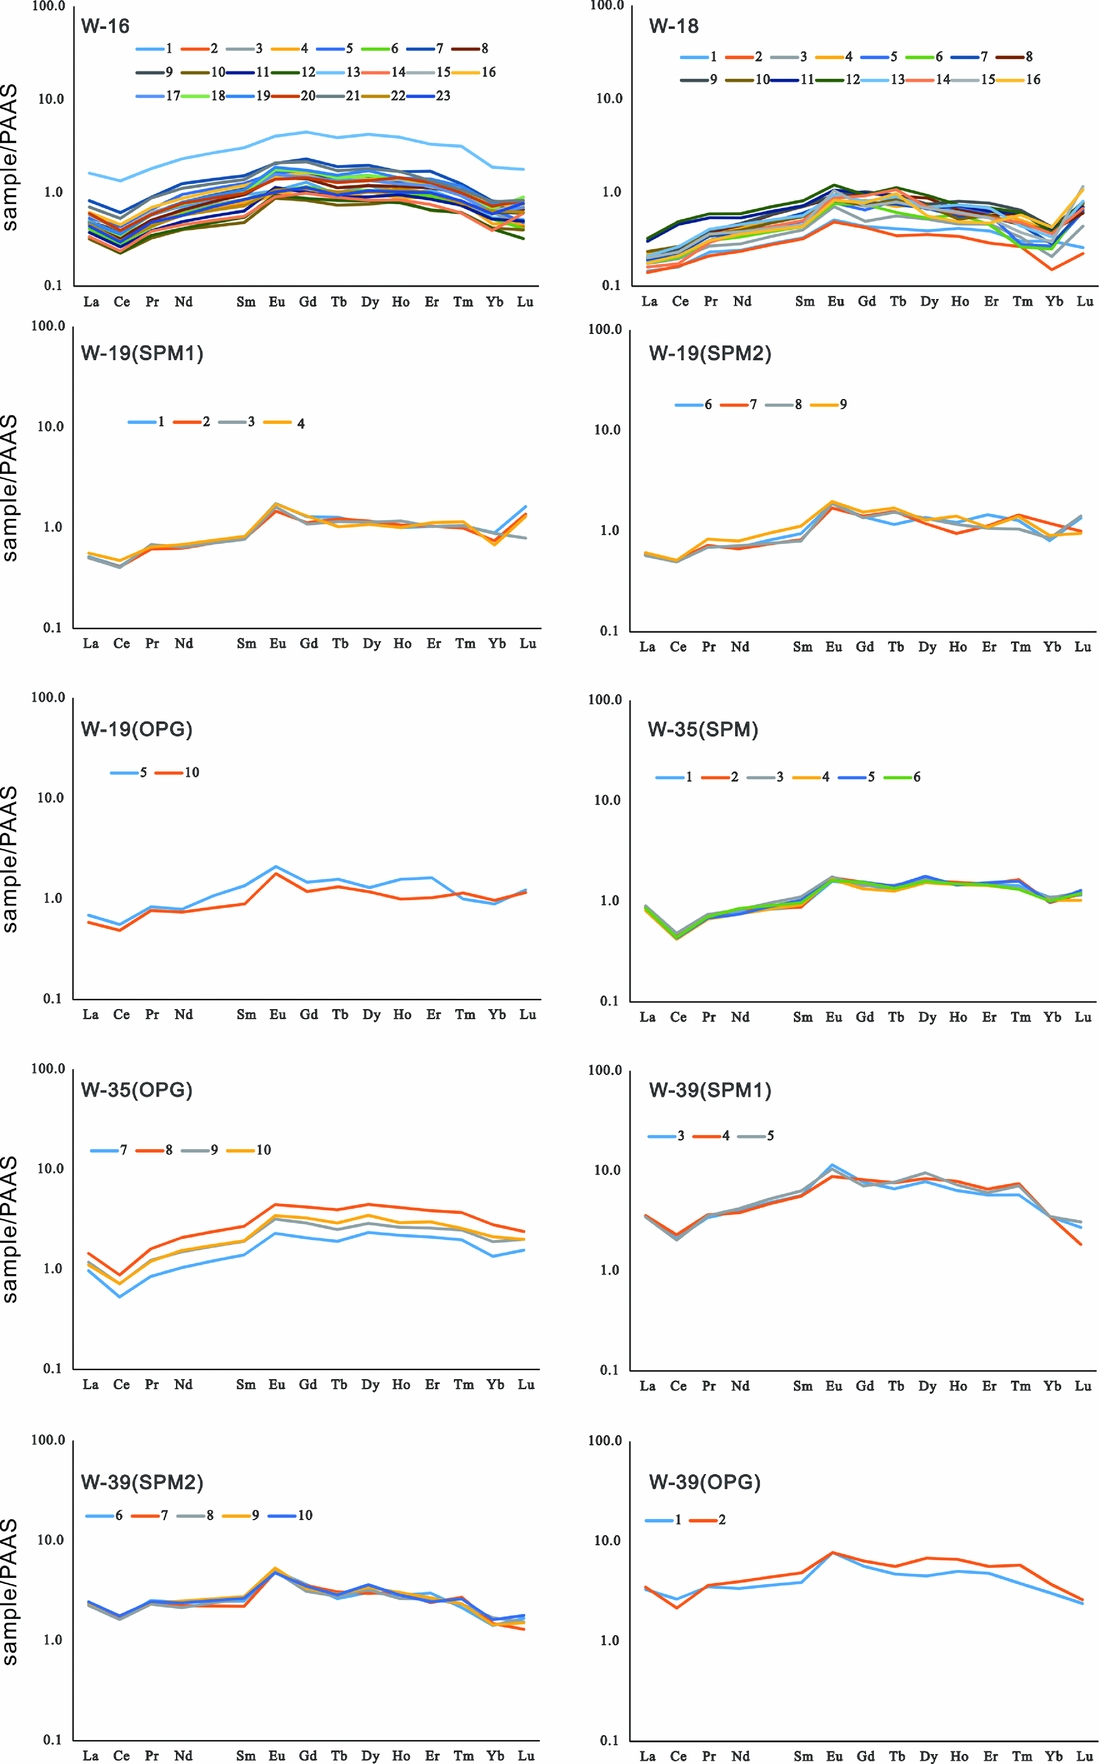
REE concentrations for all analysed spots are listed in Table 1 and the PAAS-normalized patterns are shown in Figure 3. Diagnostic ratios (LaN/SmN, YbN/SmN, LaN/YbN), Ce anomaly (Ce/Ce*) and Eu anomaly (Eu/Eu*) are also listed in Table 1.
Measured REE contents (in ppm) of phosphatic grains in the Weng'an black phosphorties for respective samples (e.g. W-16) and spot numbers (e.g. 1–23)

PAAS-normalized REE distribution patterns of the phosphatic intraclasts of the Weng'an phosphorite. For samples W-19, W-35 and W-39, spherical phosphatized microfossils and other phosphatic grains are shown separately. SPM: spherical phosphatized microfossils; OPG: other phosphatic grains. The numbers shown in the diagrams correspond to the numbers of analysed spots in Figure 2 and Table 1.

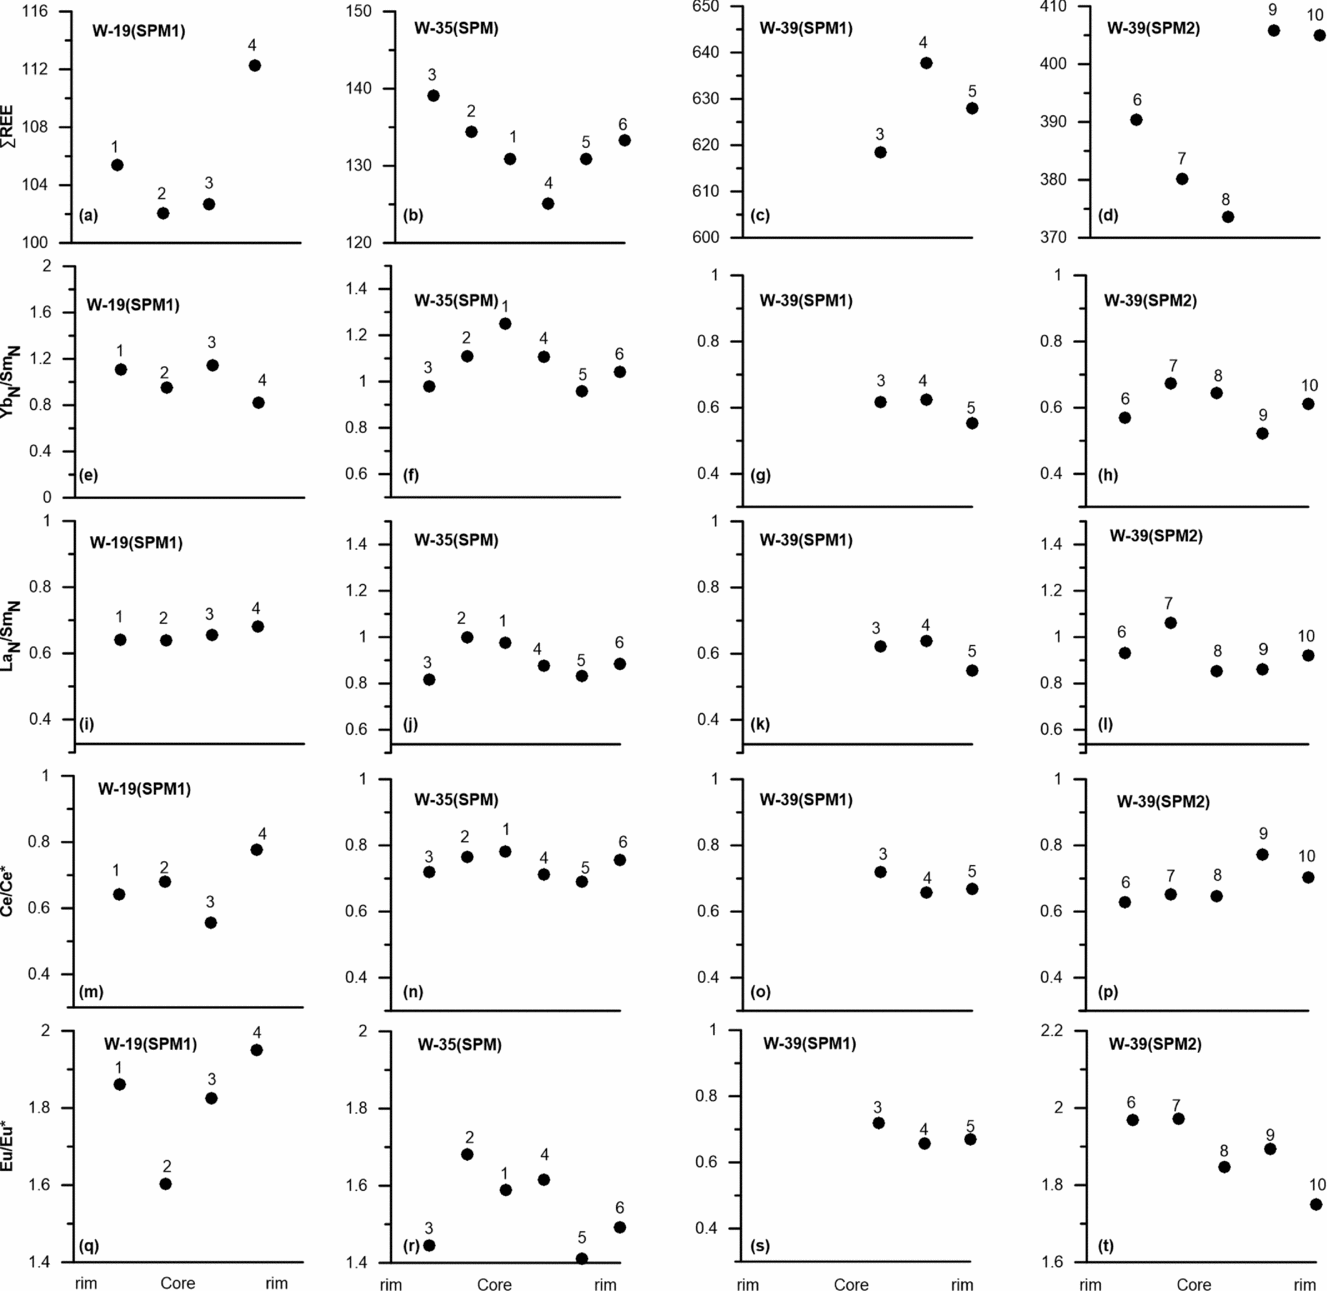
The total REE concentrations (∑REE) for all analysed spots show a range from 35.9 to 638 ppm (average 165 ppm). Among all samples, W-39 displays the highest REE contents (∑REE = 374–638 ppm) while W-18 displays the lowest REE contents (∑REE = 35.9–95.6 ppm). The spherical phosphatized microfossils (SPM) show ∑REE ranging over 102–638 ppm. Other phosphatic grains (OPG) have ∑REE of 36–600 ppm. Within some samples (W-19, W-35), the OPG seem to have higher ∑REE than the SPM (102–128 ppm for SPM and 118–137 ppm for OPG in W-19; 125–139 ppm for SPM and 166–295 ppm for OPG in W-35). However, in W-39 the REE abundances of OPG (588–600 ppm) are within the range of that of SPM (374–638 ppm). Core to rim analysis of the SPM transects (SPM1 in W-19, SPM in W-35, SPM1 and SPM2 in W-39; Fig. 2) indicates an increase in REE contents towards the rims (Table 1, Fig. 4).

The PAAS-normalized REE patterns for all samples display a hat-shaped pattern characterized by a slight MREE arching. PAAS-normalized Yb/Sm and La/Sm ratios (YbN/SmN and LaN/SmN) of all analysed spots range over 0.46–1.45 (average 0.76) and 0.28–1.06 (average 0.59), respectively. The YbN/SmN and LaN/SmN for the SPM are 0.52–1.45 and 0.54–1.06, respectively, slightly higher than the YbN/SmN (0.46–1.18) and LaN/SmN (0.28–0.85) of the OPG. Compared to modern seawater in various basins (YbN/SmN: 3.31–6.47; LaN/SmN: 0.57–1.37) (Alibert, Reference Alibert2016), our samples have much lower YbN/SmN and slightly lower LaN/SmN values (Table 1). The Ce/Ce* values of the analysed spots show a range over 0.56–1.02, but most spots show negative Ce anomalies and only several spots in W-16 having Ce/Ce* around 1 (Table 1). All spots display positive Eu anomalies ranging over 1.10–1.97. The Ce/Ce* and Eu/Eu* values for the SPM and OPG show slightly different ranges (Ce/Ce*: 0.56–0.78 for the SPM and 0.61–1.02 for the OPG; Eu/Eu*: 1.41–1.97 for the SPM and 1.10–1.94 for the OPG). Within individual samples, the ranges of the YbN/SmN, LaN/SmN, Ce/Ce* as well as Eu/Eu* values of both SPM and OPG are broadly similar (Table 1).
Unlike the core to rim increase in REE concentrations, no apparently systematic changes in the YbN/SmN, LaN/SmN, Ce/Ce* and Eu/Eu* were found in the phosphatized microfossils (Fig. 4, Table 1). For samples W-18 and W-39, the REE concentrations of the enclosed, earlier phosphates (Fig. 2g, m) show either higher (W-39) or lower (W-18) REE concentrations than the surrounding phosphates. The LaN/SmN ratios for the enclosed and surrounding phosphates are slightly different (Table 1), but no obvious differences in YbN/SmN, Ce/Ce*, Eu/Eu* values are observed (Table 1).
5. Discussion
The REE composition of authigenic carbonate fluorapatite (CFA) in marine sediments is greatly influenced by the REE composition of its surrounding porewater, which is regulated by a number of factors. Studies on REE composition of porewater in marine sediments indicate that Fe–Mn oxides and/or organic matter are major sources for REE, with lithogenic input being an additional significant source in some cases (Haley, Klinkhammer & McManus, Reference Haley, Klinkhammer and McManus2004; Schacht, Wallmann & Kutterolf, Reference Schacht, Wallmann and Kutterolf2010; Soyol-Erdene & Huh, Reference Soyol-Erdene and Huh2013). These different REE sources are characterized by distinct REE features (Haley, Klinkhammer & McManus, Reference Haley, Klinkhammer and McManus2004; Soyol-Erdene & Huh, Reference Soyol-Erdene and Huh2013). For example, hydrogenous Mn-oxides scavenge preferentially the LREE while Fe-oxyhydroxides scavenge preferentially the HREE in seawater (Ohta & Kawabe, Reference Ohta and Kawabe2001; Surya Prakash et al. Reference Surya Prakash, Ray, Paropkari, Mudholkar, Satyanarayanan, Sreenivas, Chandrasekharam, Kota, Kamesh Raju, Kaisary, Balaram and Gurav2012). Upon reduction, these REE carriers would enrich the porewater with LREE and HREE, respectively. On the other hand, the decay of organic matter may increase the LREE/HREE ratio in porewater (Haley, Klinkhammer & McManus, Reference Haley, Klinkhammer and McManus2004). The relative contribution of these sources therefore has a significant influence on the REE pattern of porewater (Haley, Klinkhammer & McManus, Reference Haley, Klinkhammer and McManus2004; Soyol-Erdene & Huh, Reference Soyol-Erdene and Huh2013). In addition, the complexion of REE with carbonate species as well as dissolved organic matter are known to fractionate the REE in porewater (Byrne & Kim, Reference Byrne and Kim1990; Pourret et al. Reference Pourret, Davranche, Gruau and Dia2007a , Reference Pourret, Davranche, Gruau and Dia b ), and can finally lead to shifts in the patterns of REE incorporated into phosphate (Liu, Byrne & Schijf, Reference Liu, Byrne and Schijf1997). In some cases, phosphorites can display seawater-like REE patterns and are believed to record the signature of the ambient seawater during deposition (e.g. Shields & Stille, Reference Shields and Stille2001; Jiang et al. Reference Jiang, Zhao, Chen, Yang, Yang and Ling2007; Xin et al. Reference Xin, Jiang, Yang, Wu and Pi2015, Reference Xin, Jiang, Yang, Wu and Pi2016). The formation of the seawater-like pattern in phosphorites requires no significant REE fractionation during REE delivery from seawater to porewater and REE scavenging by apatite from porewater (e.g. Alibert, Reference Alibert2016). The mechanism for this pattern is not yet fully understood. Alibert (Reference Alibert2016) reported seawater-like REE patterns in apatite from the Hamersley banded iron formation, West Australia, and the absence of fractionation between the apatite and seawater was interpreted to be related to the formation of the apatite via a transient amorphous calcium phosphate phase (ACP). On the other hand, the MREE-enriched pattern that displays MREE arching seems to be more commonly found in phosphorites (e.g. Shields & Stille, Reference Shields and Stille2001; Jiang et al. Reference Jiang, Zhao, Chen, Yang, Yang and Ling2007). This pattern may result from that apatite incorporating more MREE over the other REE through substitution mechanisms, as modelling calculations indicate that the theoretical REE spectrum in apatite in equilibrium with seawater through the substitution mechanism showed pronounced enrichment in MREE (Reynard, Lécuyer & Grandjean, Reference Reynard, Lécuyer and Grandjean1999).
5.a. REE patterns and concentrations, Yb/Sm and La/Sm characteristics of the phosphatic intraclasts
Analysis of spherical phosphatized microfossils shows that the REE concentrations within individual grains are not homogeneous and show a systematic variation from the core to rim, with higher REE concentrations in the rims compared to the cores (Fig. 4, Table 1). This trend is similar to the progressive increase in REE concentrations from the core to rim for early Cambrian phosphate nodules in South China (Jiang et al. Reference Jiang, Zhao, Chen, Yang, Yang and Ling2007; Zhu et al. Reference Zhu, Jiang, Yang, Pi, Ling and Chen2014). The REE increase in the Cambrian phosphate nodules has been interpreted to be caused by more pronounced diagenetic alteration for the rims (Jiang et al. Reference Jiang, Zhao, Chen, Yang, Yang and Ling2007). In a study of the early Cambrian phosphorites in Yunnan and Sichuan provinces of South China, Shields & Stille (Reference Shields and Stille2001) also suggested that phosphorties show progressively higher REE concentrations during diagenetic mineralization. The core to rim increase in REE contents of the spherical phosphatized microfossils may therefore also reflect that the outer part of the grains were more significantly influenced by the diagenetic fluids than the inner part and incorporated more REE during diagenesis. The small sizes of the spherical phosphatized microfossils are quite noticeable (Fig. 2). The variations in REE contents observed in the phosphatized microfossils therefore suggest that the digenetic overprinting of the rims was preserved in the grains at sub-millimetre scale. Similarly, for other phosphatic grains, REE concentrations near the boundary of individual grains are higher than in the inner part. For example, in W-18, spots 3, 4 and 5 exhibit higher REE than spots 1 and 2, and spot 6 has lower REE than spot 7 (Fig. 2, Table 1). The higher REE contents near the boundaries of both phosphatized microfossils and other phosphatic grains highlight the facts that the outer parts of these grains are more easily altered by diagenetic fluids and incorporated more REE during the process.
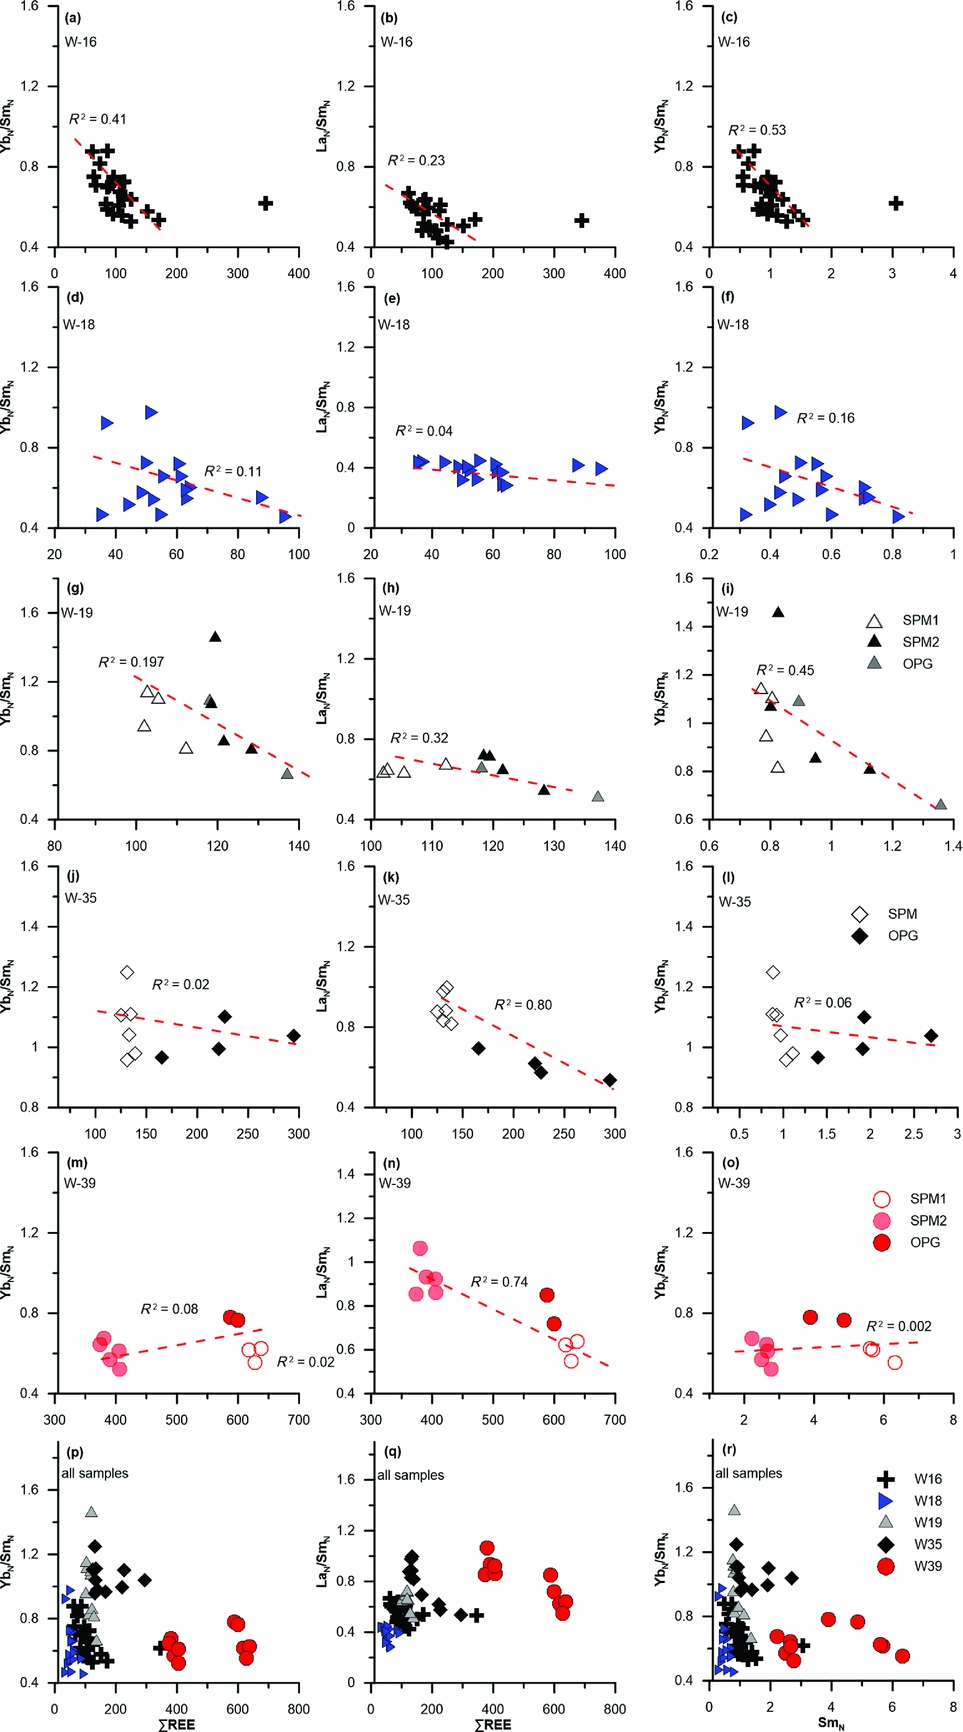
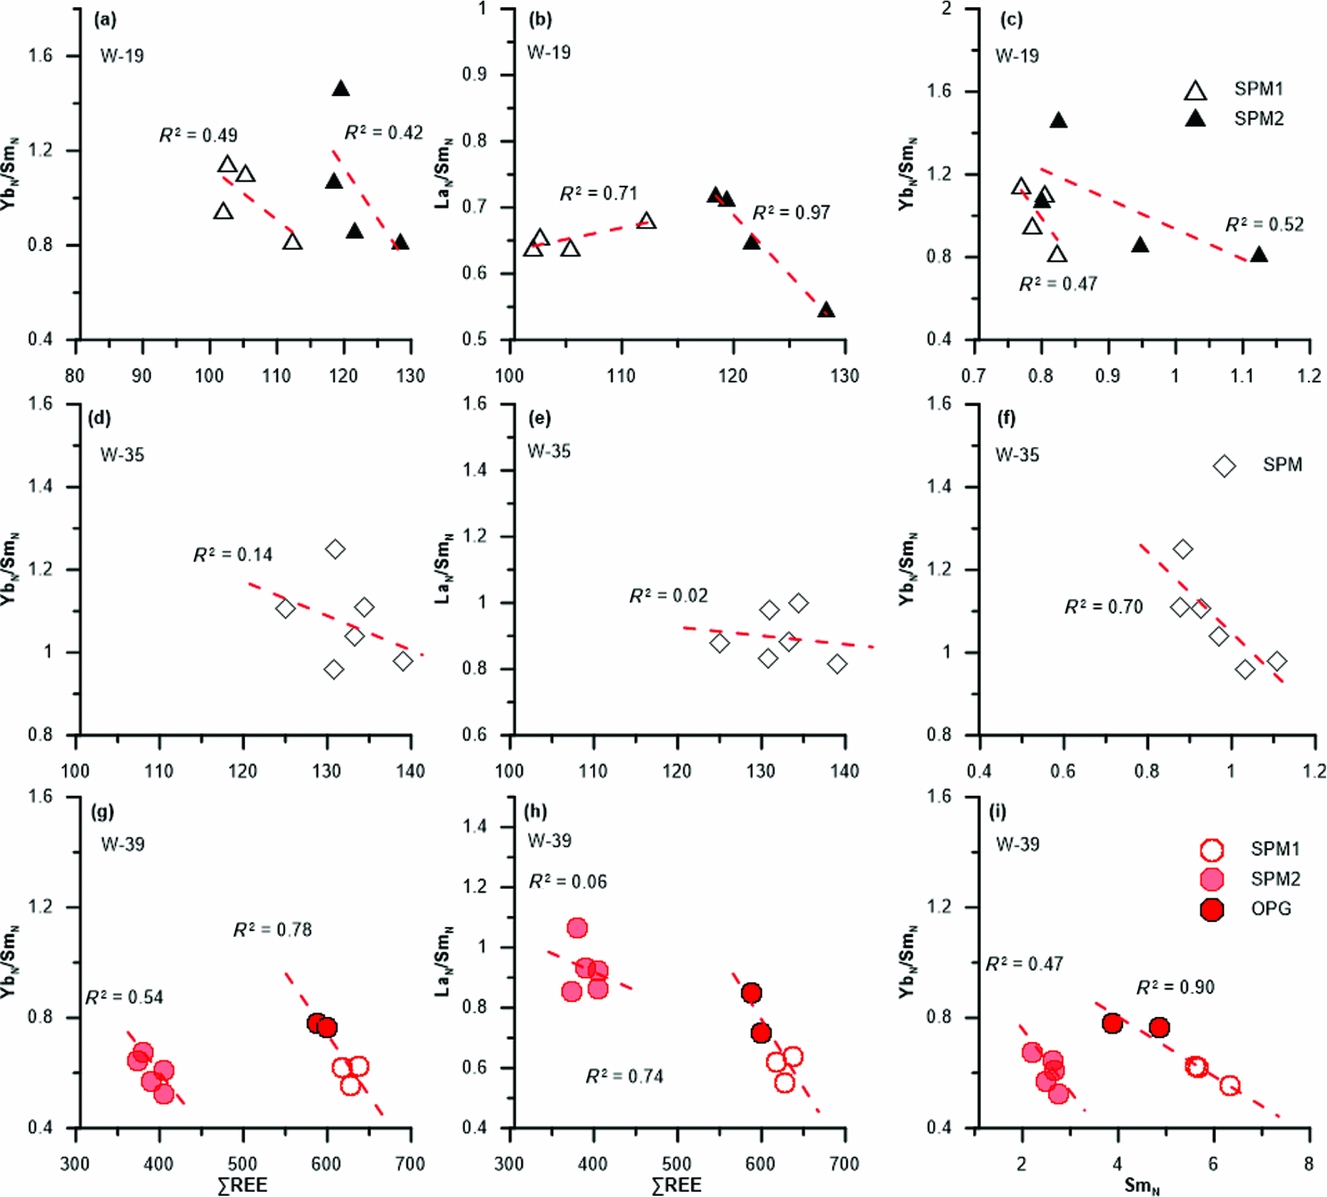
The PAAS-normalized REE patterns for the phosphatic grains are broadly similar, with slight enrichment in MREE relative to LREE and HREE (Fig. 3, Table 1). Previous studies have suggested that, during diagenetic processes, phosphorites tend to increase REE contents and preferentially concentrate the MREE (Shields & Stille, Reference Shields and Stille2001; Jiang et al. Reference Jiang, Zhao, Chen, Yang, Yang and Ling2007). This ‘diagenetic path’ is shown in W-16, of which the analysed spots exhibit negative correlation in the ∑REE v. YbN/SmN and ∑REE v. LaN/SmN diagrams (Fig. 5a–c). Further, a negative correlation between the YbN/SmN ratios and Sm contents is shown in W-16, consistent with the fact that the MREE are preferentially enriched in phosphorite during diagenesis (Shields & Stille, Reference Shields and Stille2001; Jiang et al. Reference Jiang, Zhao, Chen, Yang, Yang and Ling2007). By contrast, no clear correlation was found in W-18 (Fig. 5d–f). For individual phosphatic grains in W-19, W-35 and W-39, although analysed spots are limited, negative correlations between YbN/SmN ratios and ∑REE, LaN/SmN and ∑REE, and between YbN/SmN and Sm contents are displayed in most grains (Fig. 6). Interestingly, the correlations seem more significant within individual grains. When plotting data of other grains of the same sample together, the correlations became less clear (Fig. 5g–o). This is particularly obvious in W-39, in which two phosphatic grains display negative correlations within individual grains but follow distinct trends (Fig. 6g–i). We consider the complexity in correlations shown in different samples/phosphatic grains may associate with two factors. First, the complex diagenetic history of the samples may have attributed to the complexity in correlations. The phosphates in the samples occur as intraclastic grains with reworked characteristics (Xiao et al. Reference Xiao, Muscente, Chen, Zhou, Schiffbauer, Wood, Polys and Yuan2014; Fig. 2), suggesting that the grains were once buried, reworked and re-deposited. Some of those grains may have experienced multiple episodes of exposure, reworking and burial. It follows that each grain may have experienced a different history of diagenetic alteration before finally being buried. Within individual grains, the analysed spots have similar digenetic history and are therefore more likely to exhibit good correlations in the ∑REE v. YbN/SmN, ∑REE v. LaN/SmN and SmN v. YbN/SmN diagrams (Fig. 6). This is best shown in W-39 in which two grains follow distinct trends (Fig. 6). On the other hand, plots of all data from various grains are likely to weaken the correlations given that phosphatic grains may differ in diagenetic history and follow different diagenetic patterns.
ΣREE v. YbN/SmN, ΣREE v. LaN/SmN and SmN v. YbN/SmN diagrams for all samples. The square of correlation coefficient (R 2) is shown in each diagram. Regarding W-16, note that the spot which clearly deviates from the remainder of the dataset was not used in the calculation of R 2.

ΣREE v. YbN/SmN, ΣREE v. LaN/SmN and SmN v. YbN/SmN diagrams of the spherical phosphatized microfossils in W-19, W-35 and W-39 (also refer to Fig. 2 for more information). Symbols as for Figure 5. The diagrams of W-39 include two spots (spots 1 and 2 in Fig. 2) that are located outside the SPM1 (Fig. 2). Since the two spots are within the same phosphatic grain with the SPM1, the data are regressed together to calculate the correlation coefficient.

Another factor that may have played a role in introducing complexities to the diagenetic history of the phosphatic grains is the depositional environment of the phosphorites. The Weng'an phosphorites were interpreted to form in high-energy, shallow-water conditions (Xiao et al. Reference Xiao, Muscente, Chen, Zhou, Schiffbauer, Wood, Polys and Yuan2014). It can be inferred that, under such a setting, the chemical parameters (e.g. depth of redox interface within the sediments/seawater) and the balance between major REE sources near the seawater–sediments interface would be fluctuant, resulting in changes in REE patterns and the LaN/SmN and YbN/SmN ratios of porewater with time. As a result, the phosphatic grains at the same site would equilibrate with porewater with different REE compositions at different time periods. Finally, the changes in porewater REE geochemistry would also influence the REE characteristic of the intraclasts and add complexities to the diagenetic history of the phosphatic grains.
5.b. La/Yb and La/Sm characteristics of the phosphatic intraclasts
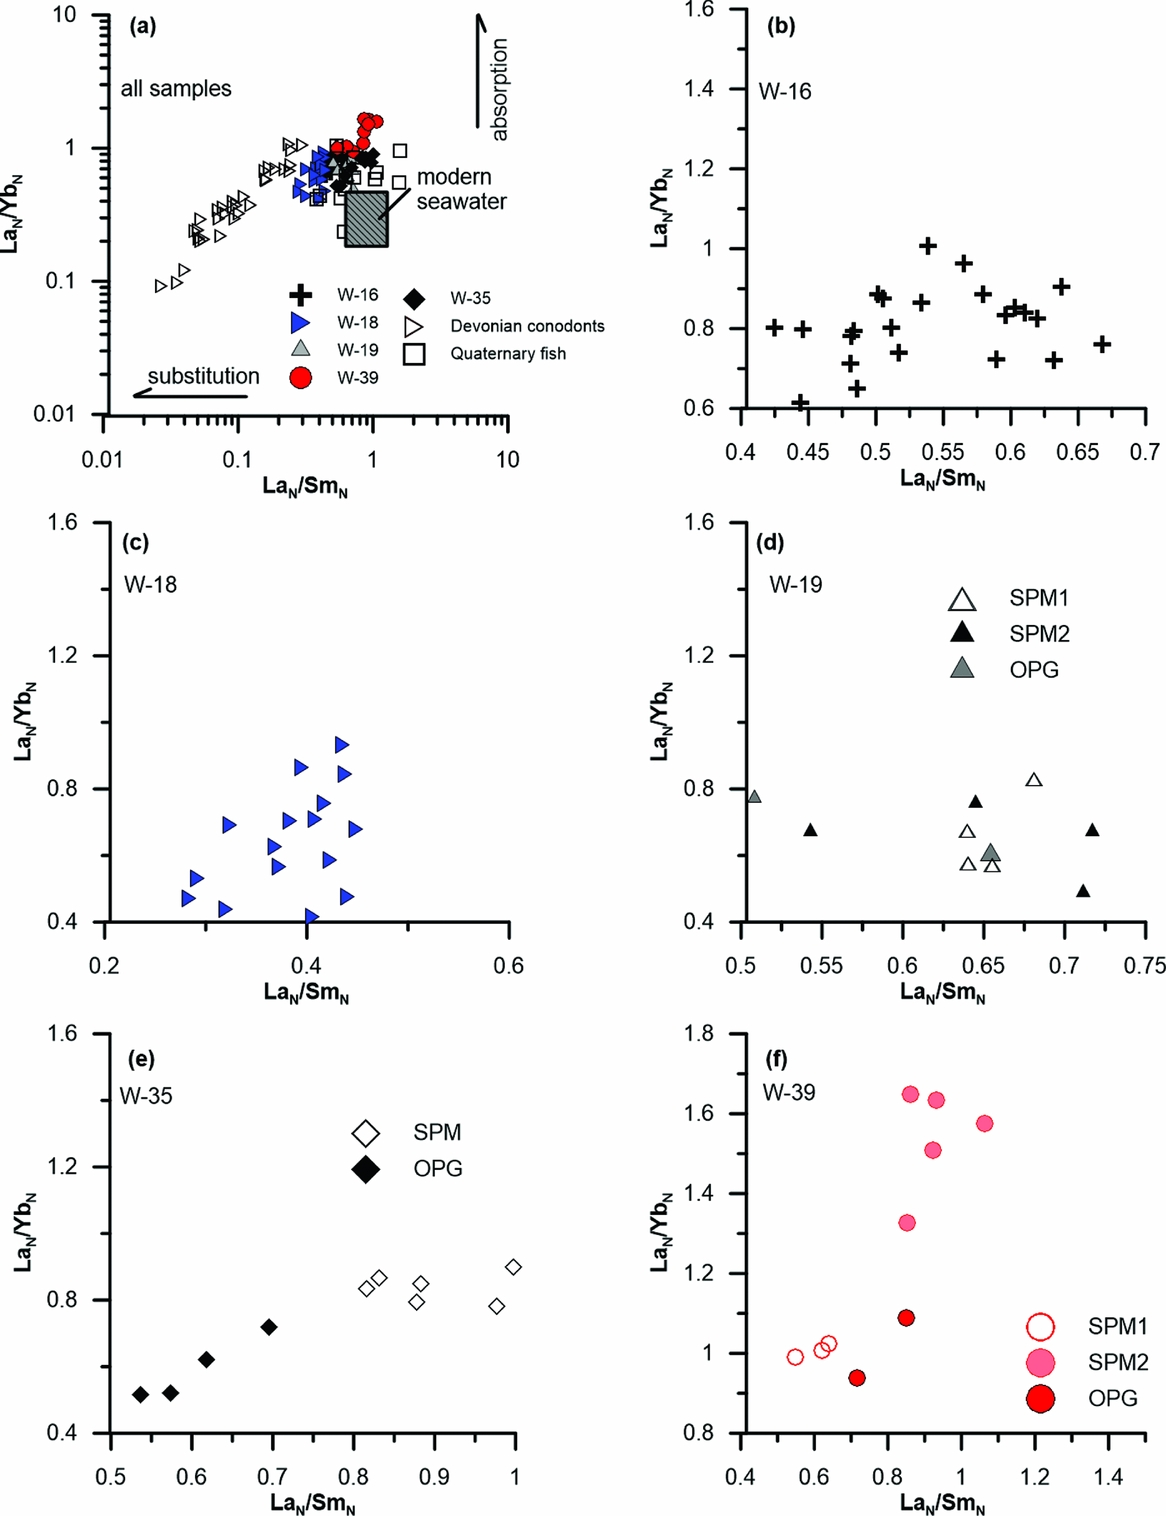
By comparison of partition coefficients of REE between apatite and water through different mechanisms (absorption versus substitution), Reynard, Lécuyer & Grandjean (Reference Reynard, Lécuyer and Grandjean1999) proposed that the LaN/SmN v. LaN/YbN diagram can be used to decipher different mechanisms of REE incorporation into apatite. The La/Yb ratios are not affected during substitution but show an increase if the adsorption mechanism dominates. Meanwhile, the La/Sm ratios usually remain invariant during absorption but decrease during substitution (Fig. 7a). In Figure 7a, most samples exhibit LaN/YbN ratios higher than seawater. The LaN/SmN ratios overlap the range of seawater with a small shift towards smaller LaN/SmN ratios. If assuming that the ‘initial’ LaN/YbN and LaN/SmN ratios of the samples were similar to seawater, the LaN/YbN and LaN/SmN patterns shown in Figure 7a would suggest the samples were affected by absorption processes and, to a slight extent, by substitution processes during diagenesis. Although whether the samples had initial REE features similar to seawater is uncertain, the samples display LaN/YbN and LaN/SmN ratios similar to some data of Quaternary fish debris (Elderfield & Pagett, Reference Elderfield and Pagett1986). The LaN/YbN and LaN/SmN features in the fish debris have been interpreted to reflect slight alteration during early diagenesis mainly via the adsorption mechanism (Reynard, Lécuyer & Grandjean, Reference Reynard, Lécuyer and Grandjean1999). In contrast, our dataset clearly deviates from the Devonian conodonts, of which the LaN/SmN v. LaN/YbN patterns are associated with the substitution mechanism during late extensive diagenesis (Reynard, Lécuyer & Grandjean, Reference Reynard, Lécuyer and Grandjean1999). These observations suggest that the samples were only influenced by early diagenetic processes rather than by extensive late recrystallization.
LaN/SmN v. LaN/YbN diagrams for the studied phosphatic grains (after Reynard, Lécuyer & Grandjean, Reference Reynard, Lécuyer and Grandjean1999). All samples and individual samples are shown separately.

Interestingly, a positive correlation between the LaN/YbN and LaN/SmN ratios was observed for the whole sample set, with W-39 and W-18 marking the two ends of the data array (Fig. 7a). The positive correlation can be also observed in W-35 and W-39 (Fig. 7e, f). Among all samples, W-39 has the highest ∑REE and W-18 has the lowest ∑REE (Table 1). If we take ∑REE as a measure of diagenetic alteration, the trend in Figure 7 would suggest La was enriched over Sm and Yb along with progressive diagenesis. However, SPM1 and OPG in W-39 characterized by higher ∑REE show lower La/Yb and La/Sm ratios (Fig. 7, Table 1). In W-35, OPG characterized by higher ∑REE also exhibits lower La/Yb and La/Sm ratios with respect to SPM (Fig. 7, Table 1). Moreover, in individual samples/phosphatic grains, the correlations between LaN/SmN and ∑REE are either negative or not clear (Figs 5, 6). The contrasting observations of individual samples/grains and the whole sample set cannot be explained by a single, one-directional diagenetic process. A more plausible explanation would be that the samples were in equilibrium with diagenetic fluids with different extents of La enrichment. This explanation is compatible with the interpretation based on the analysis of the ΣREE v. LaN/SmN, ΣREE v. YbN/SmN and SmN v. YbN/SmN cross plots, that is, each phosphatic grain within the black phosphorites differs in its own diagenetic path due to the complex diagenetic history of the grains. Higher La/Yb and La/Sm ratios of the samples/grains reflect La enrichment in porewater rather than more diagenetic alteration.
5.c. Ce anomaly
The value of the Ce anomaly is considered as an excellent indicator of the redox condition of palaeo-seawater (e.g. German & Elderfield, Reference German and Elderfield1990; Shields & Stille, Reference Shields and Stille2001; Ling et al. Reference Ling, Chen, Li, Wang, Shields-Zhou and Zhu2013). The philosophy for this index is that the redox chemistry of Ce is different from that of other LREE in seawater (Byrne & Sholkovitz, Reference Byrne, Sholkovitz, Gschneidner and Eyring1996). Ce can exist as trivalent or tetravalent forms depending on the redox conditions. In oxic seawater, trivalent Ce can be readily oxidized to tetravalent form via biological or MnO2 mediation (Moffett, Reference Moffett1990, Reference Moffett1994; Tanaka et al. Reference Tanaka, Tani, Takahashi, Tanimizu, Suzuki, Kozai and Ohnuki2010). Absorption of tetravalent Ce by Mn-oxides and hydroxides, or oxidation of trivalent Ce after its absorption by Mn-oxides and hydroxides, would cause a decrease in solubility of Ce and differentiate it from the other trivalent REE in seawater (Bau & Dulski, Reference Bau and Dulski1996; Tachikawa et al. Reference Tachikawa, Jeandel, Vangriesheim and Dupré1999). Consequently, the dissolved REE load in fully oxygenated seawater displays a negative Ce anomaly. In contrast, in suboxic and anoxic seawater where Ce reduction occurs, soluble Ce re-enters the solution phase, producing less negative or no Ce anomaly (German, Holliday & Elderfield, Reference German, Holliday and Elderfield1991). The same principle is also applicable to porewater. REE in sediments can be released to porewater via decomposition of major REE carriers (e.g. organic matter, Fe–Mn oxides). However, Ce remains differentiated from the other LREE if it stays in the insoluble, tetravalent form (Haley, Klinkhammer & McManus, Reference Haley, Klinkhammer and McManus2004). Negative Ce anomaly in porewater can therefore be expected at depth where the redox threshold for reduction of Ce(IV) is not reached. This is consistent with the REE profile studies of porewater in marine sediments. For instance, in studies of REE in porewater from the California margin and the Nazca Ridge off Peru where the bottom water is oxic to suboxic, a negative Ce anomaly is observed in the near surface, followed by increased Ce/Ce* values with depth (Haley, Klinkhammer & McManus, Reference Haley, Klinkhammer and McManus2004). In contrast, porewater displays no Ce anomaly or even a slightly positive Ce anomaly through the profile when the bottom water is anoxic, as shown in several studies (Elderfield & Sholkovitz, Reference Elderfield and Sholkovitz1987; Sholkovitz, Piepgras & Jacobsen, Reference Sholkovitz, Piepgras and Jacobsen1989; Soyol-Erdene & Huh, Reference Soyol-Erdene and Huh2013).
The phosphatic intraclasts in the studied phosphorites suggest that they were formed and deposited in a high-energy, likely oxic, shallow-water condition (Xiao et al. Reference Xiao, Muscente, Chen, Zhou, Schiffbauer, Wood, Polys and Yuan2014). This is consistent with the negative Ce anomalies exhibited in most samples, given the observation that negative Ce anomalies occur in porewater only when the bottom water is oxic–suboxic. As progressive diagenetic alteration would weaken negative Ce anomalies in phosphorites (Shields & Stille, Reference Shields and Stille2001), the Ce/Ce* values of c. 1 in a few spots of W-16 (spots 1, 3) may indicate that the originally negative Ce anomalies were altered by diagenetic fluids at deeper depths. Alternatively, as negative Ce anomalies in porewater are restricted to only the first several centimetres in some cases (Haley, Klinkhammer & McManus, Reference Haley, Klinkhammer and McManus2004), the higher Ce/Ce* values in W-16 could also indicate that they incorporated most of their REE (at least the LREE) inventories near or below the ‘negative Ce anomaly’ zone. Nevertheless, the preservation of negative Ce anomalies in most samples strongly supports the theory that the phosphatic grains were formed in oxic bottom-water conditions before their final deposition. As the phosphatic grains experienced in situ reworking or minimal transportation, the redox condition of bottom water at the final depositional site for them may not necessarily be oxic; more analysis, such as Fe speciation and trace elements, is needed in the future.
5.d. Eu anomaly
Due to spectroscopic overlap of BaO+ and BaOH+ ions, Ba has a significant inference on Eu during analysis using ICP-MS, and sometimes may produce artificial Eu anomalies in geological samples with high Ba/Eu ratios (Shields & Stille, Reference Shields and Stille2001). However, laser ablation analysis was performed under a dry plasma condition; yields of oxide and hydroxide are therefore generally low and inference from Ba on Eu is negligible (Taylor, Reference Taylor2001). The positive Eu anomalies (Eu/Eu*=1.10–1.97) of the analysed spots in the present study are therefore not an artefact caused by Ba interference.
Except for Ce, Eu is the only REE that may change its valence in the near-surface system (Brookins, Reference Brookins, Lipin and Mckay1989). At surface conditions Eu is usually present in the trivalent form, but under highly reducing and/or high temperature conditions, Eu is present as Eu2+ (Bau, Reference Bau1991). Change in Eu valence may differentiate Eu from the other REE and produces positive/negative Eu anomaly in phosphorites (Ogihara, Reference Ogihara1999; Shields & Stille, Reference Shields and Stille2001). Additionally, as pronounced positive Eu anomalies are usually found in hydrothermal fluids and venting sediments (Michard et al. Reference Michard, Albarede, Michard, Minster and Charlou1983; Stalder & Rozendaal, Reference Stalder and Rozendaal2004; Schmidt et al. Reference Schmidt, Koschinsky, Garbe-Schönberg, Carvalho and Seifert2007; Bau et al. Reference Bau, Balan, Schmidt and Koschinsky2010), involvement of hydrothermal fluids during formation of phosphorite is considered to account for positive Eu anomalies in some marine sedimentary rocks (Zhu et al. Reference Zhu, Jiang, Yang, Pi, Ling and Chen2014; Joosu et al. Reference Joosu, Lepland, Kirsimäe, Romashkin, Roberts, Martin and Črne2015).
Previous studies suggest that extreme reducing conditions during diagenesis would favour the reduction of Eu3+ to Eu2+ and the incorporation of the mobile Eu2+ into phosphorites to cause a positive Eu anomaly (e.g. Kidder, Krishnaswamy & Mapes, Reference Kidder, Krishnaswamy and Mapes2003). However, Joosu et al. (Reference Joosu, Lepland, Kirsimäe, Romashkin, Roberts, Martin and Črne2015) suggest such a process may not produce positive Eu anomalies in apatite, as Eu2+ does not fit into the apatite structure. Moreover, in a study of porewater down to 140 m below the seafloor, no Eu anomalies were found in the porewater REE patterns even below the sulphate–methane transition zone (Soyol-Erdene & Huh, Reference Soyol-Erdene and Huh2013). The observation of Soyol-Erdene & Huh (Reference Soyol-Erdene and Huh2013) suggests no preferential release of Eu over other REE under highly reducing diagenetic conditions as expected by Kidder, Krishnaswamy & Mapes (Reference Kidder, Krishnaswamy and Mapes2003). To conclude, redox conditions during diagenesis may not have a direct link to the positive Eu anomalies in our samples. Finally, hydrothermal involvement remains a plausible explanation for the Eu anomalies in the studied samples. In a previous study of the Doushantuo Formation at Weng'an, Guo et al. (Reference Guo, Yang, Liu, Strauss and Wang2003) also suggested that submarine hydrothermal activities may have played a role in the formation of the phosphorite based on sedimentary structure and geochemical evidence in the phosphorites. However, more evidence pointing to this hydrothermal origin is still lacking, and more work needs to be done to further address this issue.
6. Conclusions
(1) The systematic REE increase from core to rim in the phosphatized microfossils from the black phosphorites at Weng'an suggests the rims were more influenced by diagenetic fluids. The contrasting patterns shown in the ΣREE v. YbN/SmN, ΣREE v. LaN/SmN and SmN v. YbN/SmN diagrams for individual samples and phosphatic grains may reflect the complex diagenetic history of the phosphatic grains and may be associated with fluctuations in REE sources and chemical parameters in high-energy, shallow water.
(2) The LaN/SmN and LaN/YbN characteristics of the phosphatic intraclasts suggest they were only subjected to early diagenetic alteration rather than late extensive recrystallization.
(3) The negative Ce anomalies displayed in most samples indicate mostly oxic bottom-water conditions for the phosphatic grains. Positive Eu anomalies displayed in all samples are likely to reflect involvement of hydrothermal fluids rather than changes in the redox conditions of porewater.
Acknowledgments
This work was supported by grants from the National Natural Science Foundation of China (grant numbers 41302018, 41230102); National 973 project (grant number 2013CB835000); the State Key Laboratory of Petroleum Resources and Prospecting, China University of Petroleum, Beijing (grant number PRP/open-1305); and PhD Programs Foundation of Ministry of Education of China (grant number 20130094120008). We thank Dr Zongjun Yin for his help in identifying phosphatized microfossils in thin-sections, and Dr Tao Yang, Mr Wei Zhou and Xiong Yan for helping with the laser-ablation ICP-MS work. Dr Gerald Auer and an anonymous reviewer helped to improve this paper.
Declaration of interest
We declare no conflicts of interest in this study.
Supplementary material
To view supplementary material for this article, please visit https://doi.org/10.1017/S001675681700022X.