1. Introduction
The outspread of COVID-19 places a renewing challenge on the fundamentals of disease transmission, including a detailed investigation on the dynamics of virus carriers, such as droplets and aerosols, generated through breathing, speaking, coughing and sneezing (e.g. Bourouiba, Dehandschoewercker & Bush Reference Bourouiba, Dehandschoewercker and Bush2014; Bhagat et al. Reference Bhagat, Wykes, Davies, Stuart and Linden2020; Stadnytskyi et al. Reference Stadnytskyi, Bax, Bax and Anfinrud2020; Yang et al. Reference Yang, Pahlavan, Mendez, Abkarian and Stone2020; Bourouiba Reference Bourouiba2021). According to a recent study, for a speech droplet 10  $\mathrm {\mu }$m in diameter prior to dehydration, there is a 0.37 % probability that the droplet contains at least one virion for COVID-19, while for a larger droplet 50
 $\mathrm {\mu }$m in diameter, the probability increases dramatically to 37 % (Stadnytskyi et al. Reference Stadnytskyi, Bax, Bax and Anfinrud2020). Many previous studies looked into the collective dynamics of exhaled droplets and fluid filaments in a buoyant environment (e.g. Bourouiba et al. Reference Bourouiba, Dehandschoewercker and Bush2014; Yang et al. Reference Yang, Pahlavan, Mendez, Abkarian and Stone2020; Bourouiba Reference Bourouiba2021), which provides useful quantitative descriptions for implementing the rule of social distancing.
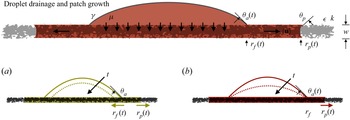
We focus on the coupled process of spreading and drainage in this study, when an exhaled droplet attaches at the surface of a thin porous layer (e.g. paper, tissues, clothes, pants, shoes and bed sheets). During the time period of interest, a sessile droplet drains gradually into a porous layer, while a fluid-infused (wet) patch eventually develops within the porous matrix through imbibition. It is of interest to understand how long a droplet completely drains into a porous layer, as it defines a first time period before virus particles enter the porous matrices. It is also of interest to understand the subsequent transport process after drainage completes, when virus particles redistribute within the wet patches as evaporation proceeds. The flow and transport dynamics within both time periods can be related to the risk of disease transmission to other locations from where breathing, speaking, coughing or sneezing occurs. This mechanism is possibly related to the enduring reports of COVID-19 positive cases in Shanghai, even when lockdown has already been undertaken for weeks/months, with food/daily consumables purchased online and delivered in packages and paper boxes. We focus on the first stage of droplet drainage in this work, as shown in figure 1, and the second stage of particle redistribution under evaporation is the focus of another work.
Coupled process of droplet drainage and patch growth on a thin porous layer through imbibition. The permeability, porosity and thickness of the porous layer are denoted by  $k$,
 $\epsilon$ and
 $w$, respectively, while the viscosity of the draining fluid, the surface tension and the advancing contact angle within the porous layer are denoted by
 $\mu$,
 $\gamma$ and
 $\theta _p$, respectively. Two limiting cases are considered in this work: (a) time evolution of
 $r_p(t)$, the radius of the wet patch, and
 $r_f(t)$, the radius of the sessile droplet, when the apparent contact angle remains a constant, i.e.
 $\theta _a(t)=\theta _{a0}$ in Case (i); (b) time evolution of
 $r_p(t)$, and
 $\theta _a(t)$, the apparent contact angle, when the location of the contact line is pinned, i.e.
 $r_f(t) = r_0$ in Case (ii). In both cases, the process continues until the droplet drains completely into the porous layer at a finite time
 $t = t_f$, which corresponds to
 $r_f(t_f) = 0$ in Case (i) or
 $\theta _a(t) = 0$ in Case (ii).

This paper is structured as follows. We first present a theoretical model based on experimentally observable behaviours of the contact line and contact angle. We then provide example solutions for representative dimensionless control parameters and descriptions of initial states, followed by a comparison with available experimental data to verify the model predictions. A brief discussion is then provided on the potential implications in the context of disease spreading through exhaled droplets. The coupled process of fluid drainage and spreading within a porous layer is also related to the traditional and modern techniques of ink painting and calligraphy (Chen Reference Chen2013), the application of paper-based microfluidic devices (e.g. Martinez et al. Reference Martinez, Phillips, Whitesides and Carrilho2010; Hertaeg et al. Reference Hertaeg, Tabor, Berry and Garnier2020), and the transport of water and nutrient in plant tissues (e.g. Zhou et al. Reference Zhou, Care, King, Courtier-Murias, Rodts, Gerber, Aimedieu, Bonnet, Bornert and Courssot2019). Therefore, the model and solutions might also find applications in other contexts.
2. Theoretical model
The permeable substrate is modelled as a thin porous layer with constant thickness  $w$, which maintains constant permeability
 $k$ and porosity
 $\epsilon$ within the entire domain and throughout the entire process. The fluid is assumed to wet the matrix that forms the porous layer, characterised by a constant advancing contact angle
 $\theta _p \in (0,{\rm \pi} /2)$. Correspondingly, the capillary pressure jump across the air–fluid interface within the porous layer is given by
 $p_c = \gamma \cos \theta _p / r_a$, with
 $\gamma$ denoting surface tension and
 $r_a$ denoting the representative pore size. The initial impact dynamics of the exhaled droplet onto the porous layer is neglected in the current study, as we assume that the droplet evolves immediately into a quasi-static spherical-cap shape with an apparent contact angle
 $\theta _{a0}$, once it attaches at the porous surface. Thus a wet patch of initial radius
 $r_0$ is created instantly on the porous layer, as the fluid drains immediately into the porous matrix once a sessile droplet of initial radius
 $r_0$ is attached. We note that the thickness of the porous layer is assumed much smaller than the initial radius of the droplet, so the time scale of fluid penetration into the substrate is negligible compared with imbibition, and we also neglect the influence of surface roughness of the substrate. Then the radius of the wet patch
 $r_p(t)$ increases gradually with time as imbibition, one type of capillary-driven spreading (e.g. Bell & Cameron Reference Bell and Cameron1906; Washburn Reference Washburn1921; Marmur Reference Marmur1988; Courbin et al. Reference Courbin, Denieul, Dressaire, Roper, Ajdari and Stone2007; Hultmark, Aristoff & Stone Reference Hultmark, Aristoff and Stone2011; Xiao, Stone & Attinger Reference Xiao, Stone and Attinger2012; Elizalde, Urteaga & Berli Reference Elizalde, Urteaga and Berli2015), occurs, and the trend persists until the droplet drains completely into the porous layer at a finite time
 $t_f$. It is further assumed that the sessile droplet maintains a spherical-cap shape during the subsequent drainage process, while the total volume
 $V(t)$ continues to decrease due to volume loss into the porous layer. The influence of evaporation is also neglected in the current work.
Even with the assumption that the sessile droplet maintains a spherical-cap shape, the motion of the contact line during the coupled process of droplet drainage and fluid spreading (i.e. patch growth) can still be complicated, depending, for example, on the surface condition of the porous layer and the property of the fluids (e.g. Huh & Scriven Reference Huh and Scriven1971; de Gennes Reference de Gennes1985; Duffy & Wilson Reference Duffy and Wilson1996; Eggers & Fontelos Reference Eggers and Fontelos2009; Zheng et al. Reference Zheng, Fontelos, Shin, Dallaston, Tseluiko, Kalliadasis and Stone2018; Kiradjiev, Breward & Griffiths Reference Kiradjiev, Breward and Griffiths2019). Nevertheless, two limiting cases can be considered to provide some insights. (i) Assuming that the apparent receding contact angle remains unchanged during the drainage of the droplet, i.e.  $\theta _a(t) = \theta _{a0} \in (0,{\rm \pi} /2)$, as sketched in figure 1(a), the radius
 $r_f(t)$ of the sessile droplet then decreases with time due to volume loss (Starov et al. Reference Starov, Kostvintsev, Sobolev, Velarde and Zhdanov2002; Kumar & Deshpande Reference Kumar and Deshpande2006). (ii) Assuming that the contact line remains pinned during the drainage process, i.e.
 $r_f(t) = r_0$, as sketched in figure 1(b), the apparent contact angle
 $\theta _a(t)$ of the sessile droplet, in contrast, decreases with time, accordingly, until the fluid drains out (e.g. Kumar & Deshpande Reference Kumar and Deshpande2006; Wemp & Carey Reference Wemp and Carey2017). These two limiting cases have also been considered for the evolution of sessile droplets on impermeable substrates, subject to volume loss due to fluid withdrawal at the centre (Marmur Reference Marmur1988). It is also possible that both
 $r_f(t)$ and
 $\theta _a(t)$ evolve with time, due to the complexity of the problem, which is beyond the scope of the current study. For the two limiting cases considered in this study, nevertheless, no arbitrary fitting parameters need to be introduced in the model to capture the details of the contact-line motion (e.g. Starov et al. Reference Starov, Kostvintsev, Sobolev, Velarde and Zhdanov2002; Espin & Kumar Reference Espin and Kumar2015), while the model remains self-consistent and leads successfully to the evolution pathways for the size of both the sessile droplet and the fluid film within the porous layer.
A quantitative description is provided next for the coupled process of droplet drainage and fluid spreading within the porous layer for the two limiting cases (i) and (ii), under the different assumptions on the motion of the contact line and the evolution of the apparent contact angle. The goal is to provide the time evolution of the frontal location  $r_p(t)$ of the wet patch on the thin porous layer, and the radius
 $r_f(t)$ and the apparent contact angle
 $\theta _a(t)$ of the sessile droplet that shrinks gradually. The decrease of the droplet volume
 $V(t)$ can also be obtained once
 $r_f(t)$ and
 $\theta _a(t)$ are known.
We start by characterising the motion of the fluid within the porous layer with Darcy's law (e.g. Bear Reference Bear1988), neglecting the influence of the gravitational force, to describe the velocity field
 \begin{equation} \frac{\mu}{k}\,\langle \boldsymbol{u} \rangle ={-}\boldsymbol{\nabla} p,\quad \mbox{or}\ \frac{\mu}{k}\,\langle u\rangle ={-}\frac{{\rm d}p}{{\rm d}r}\ \mbox{for radial flows}, \end{equation}
where  $\langle \boldsymbol {u} \rangle (\boldsymbol {r},t) \equiv \langle u \rangle \boldsymbol {e_r} + \langle v \rangle \boldsymbol {e_{\theta }}$ is the average (Darcy) velocity of the spreading fluid across the thickness of the porous layer,
 $\langle u \rangle$ is the average speed of motion along the radial direction
 $\boldsymbol {e_r}$,
 $p(\boldsymbol {r},t)$ is the pressure field within the fluid, and
 $\mu$ denotes the viscosity of the fluid. In addition, the continuity equation for the incompressible fluid flow within the porous layer provides that
 \begin{equation} \boldsymbol{\nabla}\boldsymbol{\cdot} \langle \boldsymbol{u} \rangle = 0,\quad\mbox{or}\ \frac{{\rm d}(r \langle u \rangle)}{{\rm d}r} = 0\ \mbox{for radial flows}, \end{equation}
which indicates that  $\langle u \rangle \propto r^{-1}$ in a radial configuration. Hence the volumetric rate of the radial flow, defined as
 $Q(t) \equiv 2{\rm \pi} w r \langle u \rangle$, is independent of its location
 $r$. Knowing that the capillary pressure jump across the interface between air and the infusing fluid at
 $r_p(t)$ is given by
 $p_c = \gamma \cos \theta _p / r_a > 0$ for
 $\theta _p \in (0,{\rm \pi} /2)$, we obtain how the flow rate
 $Q(t)$ evolves with time from (2.1) and (2.2) as
 \begin{equation} Q(t) = \frac{2{\rm \pi} w k \gamma\cos \theta_p}{\mu r_a}\,\frac{1}{\ln [r_p(t)/r_f(t)]}, \end{equation}
depending on the evolution of  $r_p(t)/r_f(t)$, the ratio of the frontal location of the wet patch
 $r_p(t)$ to the radius of the sessile droplet
 $r_f(t)$. To arrive at (2.3), we have imposed the condition for the capillary pressure jump as
 $p(r_f,t) - p(r_p,t) = p_c > 0$, assuming that the radial flow within the porous layer occurs only in domain
 $r \in [r_f,r_p]$, while the domain
 $r \in [0,r_f]$ is treated as a quiescent fluid bath, accordingly.
Arguing that the growth of the wet patch is sustained by the drainage of the fluid from the sessile droplet attaching at the surface, the conservation of volume then leads to  $Q(t) = -\epsilon ^{-1}\,{\rm d}V(t)/{\rm d}t$, where the total volume
 $V(t)$ of the sessile droplet can be calculated according to
 \begin{equation} V(t) = {\rm \pi}\,r_f^3(t)\,\varPi_G(\theta_a),\quad\mbox{where}\ \varPi_G(\theta_a) \equiv \frac{2 - 3\cos \theta_a+\cos^3\theta_a}{3\sin^3\theta_a}. \end{equation}
Here,  $\varPi _G(\theta _a)$ depends only on the evolution of the apparent contact angle
 $\theta _a(t)$, which describes the shape evolution of a spherical cap.
2.1. Case (i): constant contact angle, i.e.  $\theta _a(t) = \theta _{a0}$

Assuming that the apparent contact angle of the sessile droplet remains unchanged during the drainage process, i.e.  $\theta _a(t) = \theta _{a0}$, with
 $\theta _{a0} \equiv \theta _a(t = 0)$ denoting the initial contact angle, (2.3) leads to an evolution equation for the radius of the sessile droplet
 $r_f(t)$ as
 \begin{equation} \frac{{\rm d}r_f}{{\rm d}t} ={-}\frac{2w \epsilon k \gamma \cos \theta_p}{3\mu r_a\,\varPi_G(\theta_{a0})}\, \frac{1}{r_f^2\ln [r_p/r_f]}. \end{equation}
Notice also that the kinematic condition indicates  ${\rm d}r_p/{\rm d}t \equiv \langle u \rangle |_{r=r_p} = Q/(2{\rm \pi} w r_p)$, which represents the speed of the propagating front of the wet patch within the thin porous layer. Consequently, (2.3) also leads to the evolution equation for the frontal location of the wet patch
 $r_p(t)$ as
 \begin{equation} \frac{{\rm d}r_p}{{\rm d}t} = \frac{k \gamma\cos \theta_p}{\mu r_a}\,\frac{1}{r_p\ln [r_p/r_f]}. \end{equation}
Equations (2.5) and (2.6) form a coupled system for the time evolution of  $r_f(t)$ and
 $r_p(t)$, and can be solved together with the initial condition
 \begin{equation} (r_f,r_p)|_{t=0}=(r_0,r_0), \end{equation}
where  $r_0 = [V_0/{\rm \pi} \,\varPi _G(\theta _{a0})]^{1/3}$ denotes the initial radius of the sessile droplet.
We next non-dimensionalise (2.5) and (2.6), and the initial condition (2.7), by defining  $\bar r_f = r_f/r_0$,
 $\bar r_p = r_p/r_0$ and
 $\bar t = t/t_c$, where the characteristic time scale is chosen as
 $t_c =\mu r_a r_0^2 / k \gamma \cos \theta _p$, based on (2.6) for the evolution of
 $r_p(t)$ due to imbibition. Then we obtain the dimensionless form of the coupled evolution equations for the location of the fronts,
 \begin{equation} \frac{{\rm d}\bar r_f}{{\rm d}\bar t} ={-}\frac{\varPi_A}{\bar r_f^2 \ln (\bar r_p / \bar r_f)}\quad\mbox{and}\quad \frac{{\rm d}\bar r_p}{{\rm d}\bar t} = \frac{1}{\bar r_p \ln (\bar r_p/\bar r_f)}, \end{equation}
and the dimensionless initial condition
 \begin{equation} (\bar r_f,\bar r_p)|_{\bar t=0} = (1,1). \end{equation}
A dimensionless control parameter appears in (2.8a,b), defined as
 \begin{equation} \varPi_A \equiv 2 w \epsilon/3r_0\,\varPi_G(\theta_{a0}), \end{equation}
which indicates the ratio of the thickness of the porous layer over the initial radius of the sessile droplet. Notice that neither the viscosity of the fluid  $\mu$ nor the interfacial tension
 $\gamma$ enters the definition of
 $\varPi _A$. Nevertheless, both
 $\mu$ and
 $\gamma$ enter the problem by impacting the characteristic time scale
 $t_c$, and hence how long the coupled process of droplet drainage and patch growth lasts. Equations (2.8a,b) are ready to be solved with (2.9), for example, using Matlab subroutine ODE45, or ODE15s, for the time evolution of
 $\bar r_f(\bar t)$ and
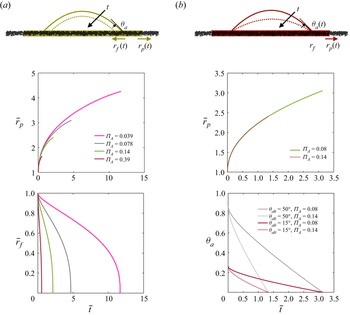
 $\bar r_p(\bar t)$, with typical evolution curves shown in figure 2(a) for selected values of
 $\varPi _A$. Once
 $\bar r_f(\bar t)$ is known, the decrease of the total volume of the sessile droplet can also be obtained through
 $\bar V (\bar t) \equiv V(t)/V_0 = \bar r_f(\bar t)^3$.
Example solutions for the time evolution of  $\bar r_p(\bar t)$, the radius of the wet patch,
 $\bar r_f(\bar t)$, the radius of the sessile droplet, and
 $\theta _a(\bar t)$, the apparent contact angle. (a) Sketch and example solutions for
 $\bar r_p(\bar t)$ and
 $\bar r_f(\bar t)$ in Case (i), when the apparent contact angle remains a constant, i.e.
 $\theta _a(\bar t)=\theta _{a0}$. (b) Sketch and example solutions for
 $\bar r_p(\bar t)$ and
 $\theta _a(\bar t)$ in Case (ii), when the location of the contact line is pinned, i.e.
 $\bar r_f(\bar t) = 1$.

Notice also that (2.8a,b) can be rearranged to provide
 \begin{equation} \frac{{\rm d}\bar r_f^3}{{\rm d}\bar r_p^2} ={-}3\varPi_A/2, \end{equation}
and, after an integration,
 \begin{equation} \bar r_p = [1-2(\bar r_f^3-1)/3\varPi_A]^{1/2}, \end{equation}
with initial condition (2.9). Knowing that the droplet eventually drains out at a finite time  $\bar t_f$, i.e.
 $\bar r_f(\bar t_f) \to 0^+$, we then obtain an expression for the maximum outreach of the wet patch within the porous layer:
 \begin{equation} \bar r_{max} (\bar t_f) \to (1+2/3\varPi_A)^{1/2}, \end{equation}
which depends only on the dimensionless control parameter  $\varPi _A$, as defined in (2.10). In fact, solution (2.13) can be derived simply from the conservation of volume between the initial (
 $t=0$) and final (
 $t=t_f$) states, i.e. from
 $V_0+\epsilon {\rm \pi}r_0^2 w = \epsilon {\rm \pi}r_{max}^2 w$, and is independent of the evolution pathways for either
 $r_f(t)$ or
 $r_p(t)$. Notably, (2.13) suggests that
 $r_{max} \sim r_0^{3/2}[\varPi _G(\theta _{a0})/\epsilon w]^{1/2} \propto r_0^{3/2}$ for
 $r_0\,\varPi _G(\theta _{a0})/\epsilon w \gg 1$, i.e. for greater droplet size, less wettable surface, and smaller thickness of the porous layer, while
 $r_{max} \sim r_0$ for
 $r_0\,\varPi _G(\theta _{a0})/\epsilon w \gg 1$ in the opposite limit.
Equation (2.12) can also be substituted into (2.8a,b) to provide the decoupled evolution equations for  $\bar r_p(\bar t)$ and
 $\bar r_f(\bar t)$ as
 $$\begin{gather} \frac{{\rm d}\bar r_f}{{\rm d}\bar t} = \frac{\varPi_A}{\bar r_f^2 \ln (\bar r_f/[1-2(\bar r_f^3-1)/3\varPi_A]^{1/2})}, \end{gather}$$
 $$\begin{gather}\frac{{\rm d}\bar r_p}{{\rm d}\bar t} = \frac{1}{\bar r_p \ln (\bar r_p/[1-3\varPi_A(\bar r_p^2-1)/2]^{1/3})}, \end{gather}$$
which can be solved independently, with initial condition (2.9) and any specific value of  $\varPi _A$. Equation (2.14) is equivalent to (2.8a,b), so the results for
 $\bar r_f(\bar t)$ and
 $\bar r_p(\bar t)$ from solving (2.8a,b) or (2.14) are the same.
2.2. Case (ii): pinned contact line, i.e. $r_f(t) = r_0$

We next consider the alternative scenario, Case (ii), with the assumption that the location of the contact line is pinned during the coupled process of droplet drainage and patch growth through imbibition. In this case, the radius of the sessile droplet, attaching at the surface of the thin porous layer, remains as its initial value  $r_f(t) = r_0$. Nevertheless, the apparent contact angle
 $\theta _a(t)$ becomes time-dependent and decreases with time, as the volume loss of the droplet continues to occur through drainage. The evolution equation for the radius of the wet patch
 $r_p(t)$ remains the same as (2.6), as the imbibition process depends on
 $r_f(t)$, which impacts the pressure gradient that drives the flow in the porous layer, but is independent of
 $\theta _a(t)$. However, the conservation of volume
 $Q(t)=-\epsilon ^{-1}\,{\rm d}V/{\rm d}t$ now leads to an evolution equation for the decrease of the apparent contact angle
 $\theta _a(t)$ as
 \begin{equation} \frac{{\rm d}\theta_a}{{\rm d}t} ={-}\frac{2w \epsilon k \gamma\cos \theta_p}{\mu r_a r_0^3}\, \frac{1}{\varPi_G'(\theta_a)\ln r_p/r_0}, \end{equation}
with  $'$ indicating
 ${\rm d}/{\rm d}\theta _a$, and hence
 \begin{equation} \varPi_G'(\theta_a) = 1-3\cot \theta_a\,\varPi_G(\theta_a) = 1-\frac{\cos \theta_a \left(2 - 3\cos \theta_a+\cos^3\theta_a\right)}{\sin^4\theta_a}, \end{equation}
rather than the evolution equation (2.5) for the shrinkage of the droplet radius  $r_f(t)$ in Case (i).
We can also non-dimensionalise (2.6) and (2.15), with the same characteristic length scale  $r_0$ and time scale
 $t_c =r_0^2 \mu r_a/ k \gamma \cos \theta _p$ as Case (i), to provide the dimensionless governing equations for the radius of the wet patch
 $\bar r_p(\bar t)$ and apparent contact angle
 $\theta _a(\bar t)$ as
 \begin{equation} \frac{{\rm d}\bar r_p}{{\rm d}\bar t} = \frac{1}{\bar r_p \ln \bar r_p}\quad \mbox{and}\quad \frac{{\rm d}\theta_a}{{\rm d}\bar t} ={-}\frac{3\varPi_A\,\varPi_G(\theta_{a0})}{\varPi_G' (\theta_a)\ln \bar r_p}, \end{equation}
with  $\varPi _A$ already defined in (2.10), which indicates the thickness of the porous layer over the initial radius of the sessile droplet. Equations (2.17a,b) can be solved, for example, using Matlab subroutine ODE15s, with initial condition
 $(\bar r_p, \theta _a) = (1,\theta _{a0})$, providing the value of
 $\varPi _A$, the dimensionless parameter, and
 $\theta _{a0}$, the initial contact angle. Representative evolution curves from solving (2.17a,b) are shown in figures 2(b) for selected values of
 $\varPi _A$ and
 $\theta _{a0}$.
Once  $\theta _a(\bar t)$ is obtained, the evolution of the droplet volume can also be calculated through
 $\bar V(\bar t) \equiv V(t)/V_0 = \varPi _G(\theta _a(\bar t))/\varPi _G(\theta _{a0})$, with the shape function
 $\varPi _G$ already defined in (2.4) for a spherical cap. In fact, (2.17a,b) can be rearranged further to provide the evolution equation for
 $\bar V(\bar t)$ as
 \begin{equation} \frac{{\rm d}\bar V}{{\rm d}\bar t} ={-}\frac{3\varPi_A}{\ln \bar r_p},\quad \mbox{or}\quad \frac{{\rm d}\bar V}{{\rm d}\bar r_p^2} ={-}\frac{3\varPi_A}{2}, \end{equation}
which is independent of the detailed evolution pathway of the apparent contact angle  $\theta _a(\bar t)$. Thus the decrease of the droplet volume
 $\bar V(\bar t)$ due to drainage is independent of the initial contact angle
 $\theta _{a0}$, even though
 $\theta _{a0}$ impacts how
 $\theta _{a}(\bar t)$ decreases with time. It is also shown from (2.17a,b) that the evolution of the radius
 $\bar r_p(\bar t)$ of the wet patch is independent of
 $\varPi _A$ and decoupled from the evolution of
 $\theta _a(\bar t)$. However,
 $\bar r_p(\bar t)$ impacts the evolution of
 $\theta _a(\bar t)$ and hence the finite time
 $\bar t_f$ for the sessile droplet to drain out, which feeds back to inform when the evolution of
 $\bar r_p(\bar t)$ ends.
Implicit expressions can also be derived for the evolution of both  $\bar r_p(\bar t)$ and
 $\bar V(\bar t)$ from their equivalent derivative forms (2.17a,b) and (2.18) as
 \begin{equation} \bar r_p^2 \ln \bar r_p^2 - \bar r_p^2 = 4\bar t - 1\quad \mbox{and}\quad \bar V = 1 - 3\varPi_A(\bar r_p^2 - 1)/2, \end{equation}
for  $\bar r_p \le \bar r_{max} = (1+2/3\varPi _A)^{1/2}$. The evolution of
 $\theta _a(\bar t)$, in addition, is also informed implicitly from (2.19a,b), knowing that
 $\bar V(\bar t) = \varPi _G(\theta _a(\bar t))/\varPi _G(\theta _{a0})$. The maximum outreach of the wet patch can also be derived from (2.19a,b) as
 $\bar r_{max} = (1+2/3\varPi _A)^{1/2}$, which recovers solution (2.13), as expected, and can be derived directly based on the conservation of volume. We can also derive an explicit expression for the finite drain-out time from (2.19a,b) as
 \begin{equation} \bar t_f = (\bar r_{max}^2 \ln \bar r_{max}^2 -\bar r_{max}^2 + 1)/4= [(1+2/3\varPi_A)\ln (1+2/3\varPi_A)-2/3\varPi_A]/4, \end{equation}
which corresponds to  $\theta _a(\bar t_f) = 0$.
2.3. Remarks
A comparison on the evolution of  $\bar r_p(\bar t)$ and
 $\bar V(\bar t)$ between the two limiting cases is shown in figure 3 for
 $\varPi _A = 0.08, 0.14$, and the evolution curves are independent of the initial contact angle
 $\theta _{a0}$. It can be seen that for the same
 $\varPi _A$, while the maximum outreach of the wet patch
 $\bar r_{max}$ is the same in both cases, the finite time
 $\bar t_f$ to arrive at the final state is different, and the process can be significantly shorter (e.g.
 $\approx 1/3$ shorter for
 $\varPi _A = 0.14$) in Case (i), when the apparent contact angle remains unchanged, than in Case (ii), when the contact line is pinned. Such a feature can be related to the risk of disease transmission through attached fluid filaments on tissues and clothes, as we discuss later in § 2. In addition, the growth of the wet patch slows down in both cases, i.e. the speed of the expanding interface
 $\langle u \rangle |_{\bar r = \bar r_p} = {\rm d}\bar r_p/{\rm d}\bar t$ decreases with time, as the evolution curves of
 $\bar r_p(\bar t)$ both bend down as time progresses, as shown in figure 3(a), and eventually stops at
 $\bar t_f$.
Comparison between the solutions of Case (i) and Case (ii) for different  $\varPi _A$. Time evolution for (a) the radius of the wet patch
 $\bar r_p(\bar t)$, and (b) the total volume of the sessile droplet
 $\bar V(\bar t)$.

2.4. Comparison with experiments
Laboratory experiments have also been reported on the drainage of sessile droplets into thin layers of porous substrates (e.g. Starov et al. Reference Starov, Kostvintsev, Sobolev, Velarde and Zhdanov2002; Kumar & Deshpande Reference Kumar and Deshpande2006; Courbin et al. Reference Courbin, Denieul, Dressaire, Roper, Ajdari and Stone2007; Wemp & Carey Reference Wemp and Carey2017). Both Case (i), constant contact angle, and Case (ii), pinned contact line, have been observed, depending on the specific fluids and porous substrates employed in the experiments. We provide a brief discussion in this section on the major experimental observations and also a comparison between the theoretical predictions and the experimental measurements.
Specifically, earlier experiments were performed by placing silicone oils of different viscosities (PROLABO, SO20, SO100, SO500) onto cellulose nitrate membrane filters (Sartorius, type 113) (Starov et al. Reference Starov, Kostvintsev, Sobolev, Velarde and Zhdanov2002). Their measurements on the apparent contact angle indicate that after a short initial transition, e.g.  $O(10)$ s, the receding contact angle stays approximately unchanged for a long period of time, e.g.
 $O(10^2)$ s, until the droplet drains completely into the porous base. These experiments are more relevant to Case (i) of the current model. To obtain a quantitative comparison between the prediction of the current model and the experimental measurements, we next take the experimental data from table 2 in Starov et al. (Reference Starov, Kostvintsev, Sobolev, Velarde and Zhdanov2002) on the volume of the droplets, viscosity of the silicone oil, characteristic pore size, porosity, and thickness of the porous substrates, and the apparent contact angle at intermediate times. We also impose
 $\gamma = 21.2$ mN m
 $^{-1}$ for the surface tension of silicone oil 500 cSt. The permeability of the membranes was not reported in Starov et al. (Reference Starov, Kostvintsev, Sobolev, Velarde and Zhdanov2002), hence we impose
 $k=4.80 \times 10^{-16}$ m
 $^2$ in experiment 9 and
 $k=5.27 \times 10^{-16}$ m
 $^2$ in experiment 10 in our calculations, such that there is good agreement on the finite drain-out time
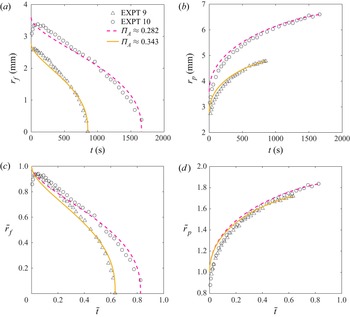
 $t_f$ between the theory and experiments. Eventually, the experimentally recorded time-dependent data for the contact-line location
 $r_f(t)$ and the radius of the wet patch
 $r_p(t)$ both demonstrate good agreement with the prediction of the current model, as shown in figure 4. We also note that the rescaled experimental data do not collapse onto universal curves in figures 4(c,d), as expected and in contrast to the theory developed in Starov et al. (Reference Starov, Kostvintsev, Sobolev, Velarde and Zhdanov2002). This is because the dimensionless control parameter
 $\varPi _A$ takes different values in the experiments (
 $\varPi _A \approx 0.343$ in experiment 9 and
 $\varPi _A \approx 0.282$ in experiment 10). Nevertheless, for each experiment, the current model provides good predictions with the corresponding
 $\varPi _A$.
Comparison between the prediction of Case (i) of the current model (the solid and dashed curves) and the experimental observations (the symbols) in Starov et al. (Reference Starov, Kostvintsev, Sobolev, Velarde and Zhdanov2002). (a,b) The raw data for  $r_f(t)$, the radius of the sessile droplet, and
 $r_p(t)$, the radius of the wet patch. (c,d) The rescaled data for
 $\bar r_f(\bar t)$ and
 $\bar r_p(\bar t)$. The apparent contact angle approaches approximately a constant after a quick initial transition in these experiments, which is consistent with the assumptions in Case (i). The dimensionless parameter
 $\varPi _A$ is calculated based on the experimental parameters
 $\varPi _A \approx 0.343$ in experiment 9 and
 $\varPi _A \approx 0.282$ in experiment 10.

There are also droplet drainage experiments by depositing water droplets onto thin layers of nanostructured ZnO surfaces (Wemp & Carey Reference Wemp and Carey2017), during which, in contrast, the location of the contact line remains approximately pinned for a long period of time, e.g.  $O(1)$ s, after a very quick initial adjustment, e.g.
 $O(10^{-2})$ s. While the time evolution of the apparent contact angle was not reported in this study for us to impose a comparison between the theoretical prediction and experimental measurements, these experiments demonstrate that the regime of Case (ii) of the current model indeed exists. It is also of interest to note that in the analogue problem of fluid drainage from beneath an elastic sheet, it is also observed that the location of the contact line remains approximately pinned, as the fluid gradually drains into the thin porous layer underneath (Chase, Lai & Stone Reference Chase, Lai and Stone2021; Lai et al. Reference Lai, Stevens, Chase, Creyts, Behn, Das and Stone2021).
Finally, it is worth noting that the wet front within the porous substrate can become non-circular when the substrate is patterned specifically, which provides additional insights into the droplet drainage problem (Courbin et al. Reference Courbin, Denieul, Dressaire, Roper, Ajdari and Stone2007). We consider that more laboratory experiments with careful characterisation of the porous base and the wetting behaviours will be helpful to further understand the underlying mechanisms for different contact-line dynamics along porous surfaces. In particular, it will be helpful if future experiments are designed to keep track of the evolution of both the contact-line location and the apparent contact angle, knowing that there were experimental studies tracking only the contact-line location without measuring the apparent contact angle.
3. Potential implications
We next discuss briefly the potential implications of the simplified model for the coupled process of droplet drainage and patch growth, in the context of the outspread of COVID-19, through exhaled droplets during breathing, speaking, coughing and sneezing. The exhaled droplets can include virus particles, as can the wet patches on the tissues and clothes (e.g. Stadnytskyi et al. Reference Stadnytskyi, Bax, Bax and Anfinrud2020). Further risks of virus transmission are hence imposed, since such patches can possibly bring the virus particles to different places far beyond where breathing, speaking, coughing and sneezing occur, and can last much longer, for hours or days until evaporation completes. The sessile droplets are possibly related to the COVID-positive cases during lockdown (e.g. in Shanghai), when food and consumables were purchased online and delivered in packages without direct contact. While the final size of the patch can be estimated based on the conservation of volume, one key feature of the current model is to estimate the drain-out time of the spherical cap into the porous layer. If the drain-out time is longer, then the fluid filament stays longer at the surface of the porous layers rather than draining into them. As a result, the possibility for disease transfer, e.g. subject to unintentional touch/contact, becomes higher. On the other hand, the clothing industry can consider alternative designs of surfaces, such that a shorter drain-out time results, in order to, possibly, better prevent the transfer of infectious diseases.
Normal speech generates a large amount of droplets with diameter in the range 1–500  $\mathrm {\mu }$m, or, representatively, 12–21
 $\mathrm {\mu }$m, which can contribute to disease transmission (Stadnytskyi et al. Reference Stadnytskyi, Bax, Bax and Anfinrud2020). Coughing or sneezing, in addition, can generate droplets and filaments of a greater size, e.g. with diameter from 2
 $\mathrm {\mu }$m to greater than
 $1000$
 $\mathrm {\mu }$m, and has a much higher possibility of including virions (e.g. Duguid Reference Duguid1946; Stadnytskyi et al. Reference Stadnytskyi, Bax, Bax and Anfinrud2020; Bourouiba Reference Bourouiba2021). In this study, we choose
 $V_{0} \approx 3.64\times 10^3$
 $\mathrm {\mu }$m
 $^3$ (i.e. 21
 $\mathrm {\mu }$m in diameter) as a representative value for speech droplets, which is also likely to represent the greater end of the breathing droplets. We also choose
 $V_{0} \approx 1.68\times 10^7$
 $\mathrm {\mu }$m
 $^3$ (i.e. 350
 $\mathrm {\mu }$m in diameter) and
 $V_{0} \approx 25.1$ mm
 $^3$ (i.e. 3 mm in diameter) for coughing and sneezing droplets of greater size. The viscosity of the fluid is assumed to be
 $\mu = 0.93$ mPa s, while the surface tension between air and the fluid is
 $\gamma = 72$ mN m
 $^{-1}$, regardless of the further details of speaking, coughing or sneezing (e.g. Hertaeg et al. Reference Hertaeg, Tabor, Berry and Garnier2020). In addition, knowing that typical evaporation rate for water is of order
 $10^{-8}$ m s
 $^{-1}$ at room temperature in the diffusion-limited regime, it takes hours for a sessile droplet of mm in thickness to evaporate (see e.g. Boulogne, Ingremeau & Stone (Reference Boulogne, Ingremeau and Stone2016) for a summary of simple models of droplet evaporation in the diffusion-limited and convection-dominated regimes). Correspondingly, within the time scale of droplet drainage and fluid imbibition in porous layers, it is reasonable to neglect the influence of evaporation.
Four example porous layers are considered, which represent both paper and cloth, where the wet patches are formed upon droplet impact (e.g. Kolinski et al. Reference Kolinski, Rubinstein, Mandre, Brenner, Weitz and Mahadevan2012; van der Veen et al. Reference van der Veen, Hendrix, Tran, Sun, Tsai and Lohse2014; Joung & Buie Reference Joung and Buie2015). The thickness, permeability and porosity for both the paper and cloth can vary significantly, depending on the design and manufacturing for everyday use, and the wettability, i.e. the contact angle between air and the fluid above the surface and within the porous matrix. The fibrous matrix can also swell, so the thickness of the porous layer can increase with time. Nevertheless, we first model a piece of paper as a homogeneous porous layer with constant thickness  $w=25$
 $\mathrm {\mu }$m for a piece of printing paper or a book page, and
 $w=190$
 $\mathrm {\mu }$m for a piece of filter paper. The average pore radius
 $r_a = 5$
 $\mathrm {\mu }$m is estimated based on the size of the particles that can be filtered, while the permeability is estimated by
 $k = r_a^2/12 \approx 2.1 \times 10^{-12}$ m
 $^2$, and the porosity is taken as
 $\epsilon = 0.7$ (e.g. FisherScientific 2011; Hertaeg et al. Reference Hertaeg, Tabor, Berry and Garnier2020). In addition, the initial apparent contact angle
 $\theta _a$ (above the surface of the paper) and the advancing contact angle
 $\theta _p$ (within the paper) are both assumed to be 15
 $^{\circ }$, i.e.
 $\theta _{a0} = \theta _p = 15^{\circ }$ (e.g. Hertaeg et al. Reference Hertaeg, Tabor, Berry and Garnier2020). We include two additional examples for cloth, e.g. from either a shirt or a suit. The representative thickness is taken as
 $w=0.1$ mm (for shirts) and
 $w=0.5$ mm (for suits), and for both types of cloth, it is further assumed that the porosity is
 $\epsilon = 0.5$ and the average pore size is
 $r_a = 1$
 $\mathrm {\mu }$m, hence the permeability is estimated by
 $k = r_a^2/12 \approx 8.3 \times 10^{-14}$ m
 $^2$. The contact angles are taken as
 $\theta _{a0} = \theta _p = 50^{\circ }$ in the calculations here, although
 $\theta _{a0}$ and
 $\theta _p$ can vary significantly, as mentioned before.
We next evaluate the coupled process of droplet drainage and patch growth within a piece of paper or cloth. In particular, we focus on the growth of the wet patches and provide the maximum outreach  $r_{max}$ and the finite drain-out time
 $t_f$ based on the theoretical model. The results are summarised in table 1, representing the key features for patch growth in both a piece of paper and cloth, and the theoretical predictions are provided for both Case (i), with the assumption of a constant contact angle, and Case (ii), with the assumption of a pinned contact line when a sessile droplet drains. The calculations suggest that it is more self-consistent to apply the current model to evaluate the feature of patch growth from droplets of greater size, such as those generated from coughing and sneezing. For example, the model suggests that once a spherical droplet, of diameter 3 mm and generated by coughing or sneezing, is deposited onto a thin piece of cloth, the diameter of the wet patch can reach the centimetre scale (e.g.
 $r_{max} \approx 8.2$ mm), and the entire draining and spreading process lasts for several seconds (e.g.
 $t_f \approx 4.5\unicode{x2013}6.5$ s). The detailed evolution pathways for the radius of the wet patch
 $\bar r_p(\bar t)$ and volume of the sessile droplet
 $\bar V(\bar t)$ are also illustrated by the solution curves in figures 1 and 3. For speech droplets of much smaller size, however, the current model is no longer applicable to capture the dynamics of draining and spreading, as the paper or cloth becomes a deep porous base (e.g. Acton, Huppert & Worster Reference Acton, Huppert and Worster2001; Alleborn & Raszillier Reference Alleborn and Raszillier2004; Liu, Zheng & Stone Reference Liu, Zheng and Stone2017), rather than a thin porous layer: Further models are hence needed to address the three-dimensional motion of the draining fluid within the deep porous base.
Implications of the simplified model in the context of virus spreading, employing the physical properties for the exhaled droplets from breathing, speaking, coughing and sneezing, and those for thin porous layers, such as a piece of paper and cloth. For all the examples considered here, it is assumed that the viscosity of the fluid is  $\mu = 0.93$ mPa s and the surface tension between air and the fluid is
 $\gamma = 72$ mN m
 $^{-1}$. NA indicates the cases when the current model is not applicable.

4. Final remarks
We have investigated the coupled process of droplet drainage and patch growth when a sessile droplet is attached at a thin porous layer, which is related to the fundamentals of disease transmission. A simplified model and its solutions are provided to describe the decrease of the droplet volume  $V(t)$ and the growth of the wet patches, e.g. described by the radius
 $r_p(t)$ of the patches. In addition, we show the detailed evolution pathways for
 $r_p(t)$ and
 $V(t)$ in two cases: (i) when the receding contact angle remains unchanged; and (ii) when the contact line is pinned. The model suggests that the only dimensionless parameter that controls the dynamics of
 $\bar r_p(\bar t)$ and
 $\bar V(\bar t)$, in the dimensionless form, is
 $\varPi _A \equiv 2 w \epsilon /3r_0\, \varPi _G(\theta _{a0})$ in both cases, which represents the thickness of the porous layer over the initial radius of the sessile droplet. Accordingly, the evolution of
 $\bar r_p(\bar t)$ and
 $\bar V(\bar t)$, in both cases, is independent of the wettability (i.e. the apparent contact angle), as long as the liquid wets the matrix so imbibition occurs. The viscosity of the fluid and the surface tension enter the definition of the characteristic time scale
 $t_c =r_0^2 \mu r_a/ k \gamma \cos \theta _p$ and hence impact how long the process lasts. The potential implication of the model and its solutions are also discussed briefly by substituting in the physical parameters of the exhaled droplets, generated by speaking, coughing and sneezing, and those for a piece of printing paper, a book page and a piece of cloth as the thin porous layers, in the context of virus spreading.
It is also of interest to note that the current work is partially in alignment with the modelling work in a series of recent studies on hydraulic fracturing and flow–elastica interaction problems subject to volume loss (e.g. Lai et al. Reference Lai, Zheng, Dressaire, Ramon, Huppert and Stone2016, Reference Lai, Stevens, Chase, Creyts, Behn, Das and Stone2021; Chase et al. Reference Chase, Lai and Stone2021), where simple models were derived based on experimentally observable evolution of the contact-line location and without fitting parameters. In particular, in the analogue problem of fluid drainage into a thin porous layer from beneath a thin sheet of elastica that bends, it has been observed in more recent experiments that the radius of the fluid blob remains approximately unchanged as drainage and imbibition continue to proceed simultaneously (Chase et al. Reference Chase, Lai and Stone2021; Lai et al. Reference Lai, Stevens, Chase, Creyts, Behn, Das and Stone2021). These observations are more consistent with the assumption of a pinned contact line during the drainage process, as made in Case (ii) of the droplet drainage model. Alternatively, if experimental evidence can be provided on the detailed feature of the prewetting film, it would then be possible to verify the capillarity-driven thin-film models with appropriate regularisation treatments at the moving contact line and their fitting parameters, which it is hoped will bridge the two limiting cases considered in the current model.
Finally, the current model ends when the sessile droplet drains completely into the porous layer, and the final state includes a sharp interface between an inner wet patch and the outer dry area. It is also possible that the envelope of the wet patch continues to grow under further effects that generate unsaturated (or fractional) flows within the wet region, i.e. when the wet patch becomes a combination of both air and the invading fluid (e.g. Buckley & Leverett Reference Buckley and Leverett1942; Golding et al. Reference Golding, Neufeld, Hesse and Huppert2011; Zheng & Neufeld Reference Zheng and Neufeld2019; Zheng & Stone Reference Zheng and Stone2022). Detailed analysis is beyond the scope of the current study and is left for a separate work.
Acknowledgements
Part of this work was inspired by a discussion with A. Chen during an academic visit to Brown University, hosted by J.T. Ault. We would also like to thank E. Dressaire, C.-Y. Lai, G.G. Peng and A. Sauret for helpful discussions.
Funding
This work was partially supported by the Program for Professor of Special Appointment (Eastern Scholar, no. TP2020009) at Shanghai Institutions of Higher Learning.
Declaration of interests
The author reports no conflict of interest.