Implications
Production of the feed consumed by dairy cows can contribute around 50% of the greenhouse gases (GHG) emitted from milk production. Knowledge of the composition of feed rations, crop cultivation practices and availability of various feedstuffs (due to e.g. climate variations) is crucial in the work of reducing GHG emissions. This study showed that changes in feed production management (e.g. crop yield, fertilisation rate and feed waste) and ration composition (e.g. use of maize silage or domestically grown horse bean) can reduce farm level GHG emissions, but also increase them, thus, measures need to be evaluated on regional or farm basis.
Introduction
Feed production is a major source of greenhouse gas (GHG) emissions from dairy production (e.g. Thomassen et al. Reference Thomassen, van Calker, Smits, Iepema and De Boer2008). It is reported to be the second largest source, after methane (CH4) emissions from enteric fermentation (Kristensen et al., Reference Kristensen, Mogensen, Knudsen and Hermansen2011; Lesschen et al., Reference Lesschen, van den Berg, Westhoek, Witzke and Oenema2011) and Flysjö et al. (Reference Flysjö, Henriksson, Cederberg, Ledgard and Englund2011) found that almost 50% of GHG emissions per kg milk can originate from feed production in high-yielding milk production systems. Production of feed is currently the largest land use on agricultural land (Steinfeld et al., Reference Steinfeld, Gerber, Wassenaar, Castel, Rosales and deHaan2006) and since land is a limited resource, land use efficiency is another important sustainability issue related to GHG emissions from feed and milk production.
The main reason why feed production has a large impact on the life cycle GHG emissions of milk, that is the carbon footprint (CF), is nitrous oxide (N2O) emitted from cultivated soils and significantly influenced by cultivation practices, especially nitrogen (N) fertilisation (Bouwman et al., Reference Bouwman, Boumans and Batjes2002). Emissions of biogenic CO2 from the conversion of organic matter when natural ecosystems are converted into cropland and pastures can also significantly contribute to milk CF, while fossil CO2 contributes a minor part (Gerber et al., Reference Gerber, Vellinga, Opio, Henderson and Steinfeld2010).
Estimates of GHG emissions and land use efficiency in feed production have mostly been carried out for single feed products (Flysjö et al., Reference Flysjö, Cederberg and Strid2008; Mogensen et al., Reference Mogensen, Kristensen, Nguyen and Knudsen2012; Middelaar et al., Reference Middelaar, Cederberg, Vellinga, Werf and Boer2013) or included in emission estimates for total milk or meat production systems (de Vries and de Boer, Reference de Vries and de Boer2009). However, the CF of a feed product is not a fixed value, as it varies due to crop yield, cultivation practices, etc. (Flysjö et al., Reference Flysjö, Cederberg and Strid2008; Middelaar et al., Reference Middelaar, Cederberg, Vellinga, Werf and Boer2013), and thus needs to be studied for different sites. In addition, feeds are merged into rations in different combinations and proportions, which affect the overall GHG emissions from feed production as well as required land area. Ration composition can also vary with dairy farm location due to regional conditions such as climate, latitude, soil type, crop growing requirements and the availability of by-products from food industries for feed. All these factors can be expected to influence GHG emissions and the land requirement for the rations. In addition, high losses of silage DM can occur in the ensiling process, as discarded feed after opening of the silo and as spill during feeding (McGechan, Reference McGechan1990; Köhler et al., Reference Köhler, Diepolder, Ostertag, Thurner and Spiekers2013), and this is an important influencing factor to include in estimates of ration CF and land use.
To investigate these factors, this study used data from different dairy regions in Sweden as it encompasses large climate variations. Grass/clover leys are cultivated from south to north, whereas grain production is limited at higher latitudes and altitudes. Forage maize is a fairly newly introduced feed crop that is mainly grown in southern Sweden for climate reasons. Cultivation of domestic protein crops such as horse bean (Vicia faba) and pea is also limited by climate, but these crops are also outrivaled by imported soya meal in terms of protein quality and price.
The objective of this study was to estimate GHG emissions for differently formulated dairy herd rations in five dairy regions and to analyse the impacts of regional differences on ration CF and overall land use efficiency in terms of yield level, cultivation practices, nutritional quality of grass/clover silage, feed DM losses and availability of local feedstuffs. The impact of feed rations on enteric methane emissions from animals was beyond the scope of this study, but is being analysed in a parallel study.
Material and methods
Data acquisition
Regions
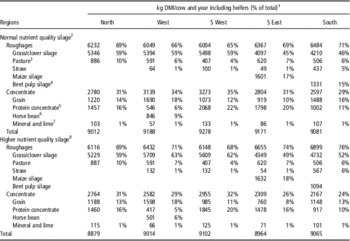
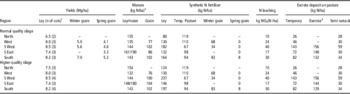
Dairy feed rations were optimised for five climatically different dairy regions: North, West, South West, South East and South, which represent a significant share of Swedish milk production, in order to illustrate feeding strategies used in practice (Supplementary Figure S1). Length of the growing season (influencing yield level and grown species) decreases with latitude (from 55º to 66º) and annual precipitation ranges from abundant rainfall in western Sweden (favouring grass production) to occasional droughts in the east. Latitude is also known to influence silage quality (Deinum et al., Reference Deinum, Beyer, Nordfeldt, Kornher, Østgård and Gv1981). Ration composition are shown in Table 1, and feed crops grown on the regional dairy farms in Table 2. Regional characteristics of the rations are further described in Supplementary Table S1.
Annual feed as dry matter intake (DMI) for cows including replacement heifers, at an annual milk yield of 9900 kg energy corrected milk, for regional feed rations

1 1 cow includes 0.98 replacement heifer. Heifers share≈22% of total, 30% of roughages and 3% to 10% of concentrate.
2 Energy=10.5–10.8 MJ/kg DM, CP=136–155 g/kg DM, NDF=490–518 g/kg DM.
3 Temporary pasture, pasture only for exercise and semi-natural pasture.
4 Pressed beet pulp from sugar industry, 27% DM content.
5 Purchased mix including soya meal, rape seed meal, distillers dried grain, dried beet pulp, other by-products from cereal and fat industry, minerals and grain. All grain are withdrawn and presented in feed category ‘Grain’.
6 Vicia faba var. equina
7 In addition to that included in purchased mix.
8 Energy=11.2–11.5 MJ/kg DM, CP=150–177 g/kg DM, NDF=461–485 g/kg DM.
Region-specific data on annual yields, N application and N leaching for feed crops grown on the regional dairy farms

1 Grassland in rotation for silage production; 5% clover content was assumed for South and S West and 20% for the others.
2 Total N including NH3 emissions at application. Doses of manure are correlated to arable area needed for farm produced feed. Approximately 80% of total manure applied on leys.
3 Cows outdoor mainly for exercise (national laws), minor dry matter intake and higher animal density.
Feed rations
Feed evaluation was carried out using the semi-mechanistic, static, science-based feed evaluation model NorFor, which was introduced some years back and includes new knowledge in feed evaluation for cattle (Volden, Reference Volden2011a). It is now commonly used in Sweden, Denmark and Norway and includes economic optimisation based on actual feed costs (Weisbjerg, Reference Weisbjerg2010). Ration optimisation using the NorFor software tool was carried out by experienced feed advisors in the regional extension service, and modelled according to the predetermined characteristics of the rations (Supplementary Table S1) and pre-defined optimisation settings. This method involves some degree of subjectivity, but was chosen as it provided realistic instead of theoretical rations, as the advisors have great overall knowledge of feed conditions for their respective regions.
The rations analysed in the study are presented in Table 1 and represent the average herd ration for an average dairy cow with annual milk yield of 9900 kg energy corrected milk (ECM) including replacement heifer. The rations were based on a Holstein herd with 13.4 months calving interval, 28.2 months age at first calf and 38% replacement rate, resulting in 0.98 heifers/cow, and on daily rations for the different animal categories (e.g. animals in different lactation, dry periods or growth phases) and indoor/grazing periods, further described in Supplementary material S1. Average herd performance data were taken from the official Swedish milk recording system.
Two alternative rations with different nutrient quality (normal, higher) in grass/clover silage were optimised for all regions (Table 1) since improving silage nutrient quality is a general recommendation in Sweden. Improved quality can increase cows’ silage dry matter intake (DMI) and reduce concentrate DMI and thus improve milk production profitability since silage can be produced at a comparable low cost due to favourable national cultivation conditions. Normal quality represented the average silage produced in the region, while higher quality represented the silage quality achieved by the best performing farmers. In the higher quality alternative, the heifer ration included normal quality silage. Silage with high nutrient quality and digestibility is valued highly in NorFor, nutritionally as well as economically (Volden, Reference Volden2011b), which resulted in the proportion of silage in the rations being increased by up to 6% (Table 1).
Feedstuffs
Roughages and to some extent grain are normally grown on the dairy farm, while protein concentrates are purchased. The feed industry offers a number of concentrate products, which mainly consist of protein feedstuffs such as soya meal, rape seed meal, distillers dried grain, dried beet pulp and other by-products from the cereal and fat industry, as well as minerals. Some products (complete concentrate feed) also include a significant proportion of grain (around 40% to 50% of total mass), but these are mainly used in regions where grain cultivation is limited due to the climate or shortage of land (in this study exemplified by the use of North and S East rations, respectively). A total of 14 different concentrate products were used in formulating the rations studied here and their recipes were obtained from the feed manufacturers providing them. Feedstuffs were classified as roughages or concentrate and grain included in concentrate products was withdrawn and presented in the ‘grain’ category, see Table 1.
Crop production
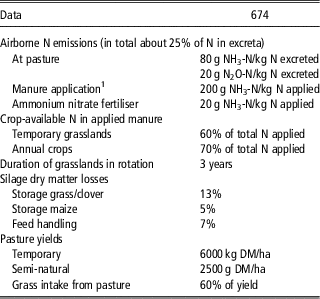
Data of feed production on the farm included all inputs, outputs and processes from cultivation of crops until feed is consumed by cattle, including feed losses. Region-specific data (summarised in Table 2) were obtained from reports and statistics (Johnsson et al., Reference Johnsson, Larsson, Lindsjö, Mårtensson, Persson and Torstensson2008; Jordbruksverket, 2009 and 2011). Manure application rates were adjusted to the area of land used for feed production on the farm and corresponded to normal practice. Total N rates were based on fertiliser guidelines and considered crop species, crop yield, region, manure utilisation rates, N supply from the preceding grass/clover crop and mineralised N from long-term effects of animal production. General data on fossil fuel use in various farm operations were obtained from Wallman et al. (Reference Wallman, Berglund and Cederberg2011). Cultivation data used irrespectively of region are summarised in Table 3. Further detailed descriptions with references can be found in Supplementary material S1.
General data used in CF calculations of on-farm feed production

1 Calculated assuming a crop rotation with grasslands and annual crops variation in application dates and techniques.
Methodology
Estimating feed CF
GHG emissions for individual feedstuffs were estimated with the method of life cycle assessment (LCA) (ISO, 2006b and 2006a). The calculations were partly carried out using the LCA software tool SimaPro 7 (PRé, Consultants bv, 2010). Emissions of CO2, CH4 and N2O were converted to carbon dioxide equivalents (CO2e) using a factor of 1, 25 and 298, respectively (IPCC, 2007).
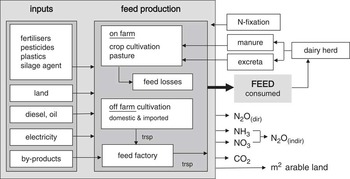
The system boundary was ‘cradle-to-feed consumed by cattle’. A schematic overview of the production system is given in Figure 1. All major emissions of CO2, CH4 and N2O associated with production of input products and processes in feed production were accounted for. GHG emissions from animals (i.e. enteric CH4) and manure in the animal house and storage (i.e. CH4 and N2O) were not included, as feed production was analysed as a separate part of the milk production system. GHG emissions contributing <1% of total emissions were omitted. Emissions associated with construction of agricultural buildings and machinery were not included with the exception of the silage bunker silo, as good data were available (Strid and Flysjö, Reference Strid and Flysjö2007). This exclusion probably had minor effect, as the dominating GHG emissions from agriculture are non-fossil (Frischknecht et al., Reference Frischknecht, Althaus, Bauer, Doka, Heck, Jungbluth, Kellenberger and Nemecek2007). Capital goods for transport and energy were considered, since these are included in existing databases (Ecoinvent). Emissions from land use change (LUC) are presented separately in a sensitivity analysis due to lack of agreed methodology and since the choice of calculation method strongly influences ration CF (Flysjö et al., Reference Flysjö, Cederberg, Henriksson and Ledgard2012). Nor were CO2 lost from or C sequestered in soil included due to methodological difficulties and large uncertainties in estimating them since the process is reversal and largely influenced by initial soil organic carbon stocks (which vary widely) and climate regimes (Kätterer et al., Reference Kätterer, Bolinder, Berglund and Kirchmann2012; Cederberg et al., Reference Cederberg, Henriksson and Berglund2013).
Schematic overview of the feed production system ‘cradle-to-feed consumed by cattle’.

The functional unit used as the reference unit for all flows within the system studied was: feed consumption to produce 1 kg ECM from a cow with annual milk yield of 9 900 kg ECM including replacement animals and feed losses. The calculated CF values for individual feedstuffs were thus added together to give the overall CF of the ration needed to produce 1 kg ECM on the farm. Allocation of GHG emissions among products from the same production system (e.g. rape-seed meal and rapeseed oil) was based on the economic value of the products. No allocation was made between milk and by-products (e.g. meat), as the present study was sought to analyse variations in feed ration CF due to the composition and production of the component feedstuffs.
Direct and indirect N2O emissions from soil management were calculated as a direct function of N applied (Table 2) or deposited to soil according to IPCC (2006) and with emission factors for Tier 1. Nitrogen in plant residues was calculated according to IPCC (2006). Nitrogen deposition was calculated using domestic emissions factors presented in Table 3. Data on GHG emissions from production of energy, synthetic fertiliser and other inputs were obtained from Flysjö et al. (Reference Flysjö, Cederberg and Strid2008) and Wallman et al. (Reference Wallman, Berglund and Cederberg2011), as were data for feed ingredients in purchased concentrate products, see also Supplementary Table S2. By following the concentrate product recipes, a CF was summed up for each product. Emissions from feed transport from industry to farm were added (100 km for all regions except North, where it was 300 km). For some smaller feed ingredients (<1%), for example vitamins, that lack GHG emission data, an average of the total ingredient CF was used.
Modelling the dairy herd
A general dairy herd was modelled to estimate land requirements for the rations and the manure application per unit land area, which was necessary when defining N synthetic fertiliser rates in feed crops on the farm. The dairy herd included 120 lactating cows (where 46 were first calvers), 50 replacement heifers <12 months and 67 heifers 12 to 28 months (based on the used herd performing data). Data on organic matter and nutrients in excreta were obtained from NorFor for each animal category and ration. The indoor system was a loose-housing system with manure handled as slurry and removed daily to outdoor storage. Allocation of excreta between house and pasture was made according to each region’s grazing ration and period (Supplementary Table S1).
Land requirement
All roughage except sugar beet pulp silage was set to be grown on the dairy farm, as was grain in the West, S West and South rations. Horse bean (West ration) was assumed to be cultivated on arable farms in the neighbourhood. Estimates of required cropland and semi-natural grassland were based on total feed consumption by the dairy herd (including feed losses, see Table 3) and regional crop yields (Table 2). Land requirement data for purchased concentrate products were taken from Flysjö et al. (Reference Flysjö, Cederberg and Strid2008) and Wallman et al. (Reference Wallman, Berglund and Cederberg2011) (Supplementary Table S2).
Sensitivity analysis
The impact of crop yield on feed ration CF was analysed for the West, S West and South rations. Yield levels of temporary grassland (silage and pasture) were varied by ±20% and yield levels of horse bean and grain grown on-farm by ±10%. Changes in yield affect the land requirement on the farm and thus manure rates were modified and consequently also synthetic N fertiliser rates. The grass yields were varied by a greater amount in the analysis due to the larger uncertainties in grassland yield statistics (a consequence of yields rarely being weighed at farm level).
The impact of GHG emissions from LUC associated with Brazilian soya production was analysed using two different LUC factors, 7.38 kg CO2 e/kg soya meal (Gerber et al., Reference Gerber, Vellinga, Opio, Henderson and Steinfeld2010) and 2.78 kg CO2 e/kg soya meal (Leip et al., Reference Leip, Weiss, Wassenaar, Perez, Fellmann, Loudjani, Tubiello, Grandgirard, Monni and Biala2010) with feed industry data.
Results
All results refer to the functional unit unless otherwise indicated.
Emissions and variation
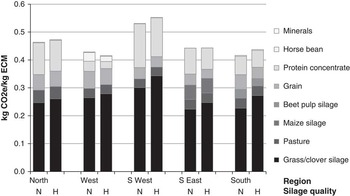
GHG emissions for the rations varied from 417 to 531 g CO2 e/kg ECM when normal quality silage was used and from 479 to 658 g CO2 e/kg ECM when higher quality silage was used (Figure 2 and Supplementary Table S3). Grass/clover silage, the dominant feed component in the rations, contributed more than 50% of total emissions irrespective of region (Figure 2 and Supplementary Table S3). The share of GHG emissions from grass/clover silage was lowest for the S East rations, as maize silage replaced some grass silage in this region. Emissions from the grain and protein concentrate components varied between the rations due to variations in animal DMI and in the emissions intensity of different feedstuffs.
Greenhouse gas (GHG) emissions from the life cycle of regional feed rations per kg energy corrected milk (ECM) (annual milk yield 9900 kg ECM), including heifers and feed losses (land use and land use change not included). Rations include silage with normal (N) or higher (H) nutrient quality. Beet pulp silage is from the sugar industry.

The West and South rations had the lowest CF. For the West region this was a consequence of grass/clover silage with low emissions, in combination with the use of locally produced horse bean replacing part of the protein in purchased concentrate products. For the South region it was the effect of including the by-product pressed sugar beet pulp silage, which had lower emissions intensity than the grass silage it replaced. Moreover, the West and South rations both had a higher proportion of grain than protein concentrate (Table 1) compared with the other regions, and the grain had lower emissions intensity than protein concentrate (Supplementary Table S2). The CF of the S East ration were comparably low due to the maize silage, which had 40% lower GHG emissions per kg DM consumed than the regional grass silage. The protein concentrate in the S East ration had the lowest emission intensity among the regions, which lessened its impact despite its high proportion.
The highest CF was found for the S West and North rations. For the S West ration, this was a consequence of grass silage with high GHG emissions in combination with the highest use of protein concentrate. For the North ration, the comparatively high emissions were a combination of relatively high use of silage and DMI from grazing and lack of available feedstuffs with low emissions intensity that could reduce the overall ration CF, such as horse bean in West, maize silage in S East and pressed beet pulp silage in South.
Impact of silage quality
Replacing normal quality silage with higher quality silage increased the ration CF by up to 5%, except for the West ration (Figure 2 and Supplementary Table S3). This negative effect on GHG emissions was mostly a result of increased emissions from cultivating the higher quality silage, in combination with a simultaneous larger share of silage in the rations. Emissions from the normal quality silage varied between 461 and 545 g CO2 e/kg DMI, while the higher quality silage had 5% to 16% higher emissions per kg DMI with the exception of the West region, where it was unchanged. The higher emissions intensity for the high-quality silage was primarily an effect of larger inputs of N fertilisers and diesel for one extra sward cut, combined with an unchanged yield level. The increased share of higher quality silage in the ration resulted in a reduction in concentrates with relatively high emissions intensity, but not to the extent that it compensated for the increased emissions from the grass silage production. The increased CF of the South ration was also caused by a reduced share of pressed beet pulp silage (Table 1) with low emission intensity when the proportion of high-quality grass silage increased. The decreased CF of the West ration was an effect of unchanged emissions intensity for the higher quality silage, exemplifying a situation where increased silage quality is achieved by improved precision in cutting time and thus no added inputs of N and diesel. The decrease in emissions from the lower share of concentrates was enhanced by a shift to a purchased concentrate product with lower emissions intensity.
Impact of grazing
Rations including DMI from summer grazing by cows (North and West rations) showed no significant difference in CF compared with the other rations where DMI by grazing was minor. Summer grazing contributed on average 5% of ration total CF and in regions where DMI from pasture was minor, its contribution was on average 2.5% of total emissions.
Land requirement
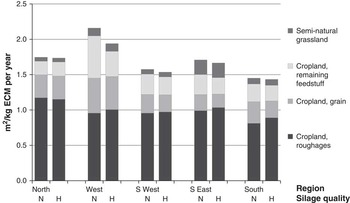
Feed rations with normal quality silage required 1.4 to 2.0 m2 cropland/kg ECM per year, or a total of 1.5 to 2.2 m2/kg ECM per year when semi-natural grasslands was included (Figure 3 and Supplementary Table S4). The greater use of semi-natural grassland in the S East ration was an effect of higher availability of this land type in this region, contributing to high feed intake for heifers during the grazing period. The lowest use of arable land was found for the South and S West rations. For South (1.4 m2/kg ECM per year), this was due to the use of pressed beet pulp silage (Table 1) which is a very land-efficient co-product from the sugar industry. For the S West ration, it was the result of high grass/clover yields. High grain yields in these regions also contributed to lower land use in South and S West. Maize silage contributed to lower use of cropland in S East, as it required half the arable area (0.9 m2/ kg DMI per year) of grass/clover silage produced in the region (1.7 m2/kg DMI per year). The highest use of arable land was found for the West ration, as a consequence of the large cropland area needed to grow horse bean (5.7 m2/kg DM per year) due to its low yield levels in comparison with grain and other protein feedstuffs (Supplementary Table S2). Horse bean occupied more than one-third of the cropland needed to produce the concentrates in the West ration (Figure 3).
Annual use of arable land for regional feed rations per kg energy corrected milk (ECM) (annual milk yield 9900 kg ECM), including heifers and feed waste. Rations include silage with normal (N) or higher (H) nutrient quality. Remaining feedstuffs include protein concentrate and pressed sugar beet pulp silage in South.

Rations with high-quality silage marginally reduced the use of cropland (1.4 to 1.8 m2/ECM per year) due to lower share of concentrates, which were generally less area-efficient than silage. The West ration stood out, with a decrease of 11% (Figure 3), mainly an effect of the reduced share of horse bean when silage quality was improved.
Sensitivity analysis
Impact of crop yield
Varying the yield levels for grassland (±20%) and annual crops (±10%) affected ration CF (West, S West and South), with higher yield levels reducing the overall CF by on average 7%, while lower yields increased the CF by on average 10%. Grass yields accounted on average for 89%, grain for 9% and horse bean (in West) for 6% of the changes in the CF.
Impact of LUC for soya meal
When the GHG emissions from LUC associated with Brazilian soya meal were included in the calculations, feed ration CF increased by 5% to 20% or 15% to 65% on applying an LUC factor of 2.78 and 7.38 kg CO2 e/kg soya meal, respectively Supplementary Table S5). The large variations in increased GHG emissions between the rations was a result of different proportions of soya meal in the concentrate products from the feed industry (3% to 40%) and the amounts of those products used in the rations (Table 1).
Discussion
This study showed that the GHG emissions and land requirement associated with dairy feed rations depend on the composition of the rations, which is determined by, for example, regional availability of various feedstuffs, crop cultivation practices and the nutritional and cost-related characteristics of feedstuffs. This complexity in ration composition makes it difficult to formulate general recommendations on how to reduce GHG emissions and/or increase land use efficiency on farm level. General reduction measures indicated in this study were related to crop cultivation and feed management practices, while the use of special feedstuffs to reduce emissions needs to be evaluated on a regional or farm basis.
Regional availability of feed stuff
Variations in climate conditions for feed production and the availability of by-products from the food industry influence the CF and land requirement of dairy herd rations. The mitigation potential thus differs between regions and possible reduction measures must be based on regional conditions. For example, the North ration in the present study represented a region where growing conditions for feed crops other than grass are limited and there is no availability of by-products with low emissions and land use, so this region does not have the same opportunities as southern regions to use feedstuffs with low emissions intensity and land use. This regional variation illustrates why the use of special feedstuffs cannot be a general measure to reduce GHG emissions in milk production, as exemplified here with, for example, forage maize and beet pulp silage.
The maize silage, with low emissions intensity, included in the S East ration resulted in a relatively low ration CF (Figure 2) as it reduced the use of grass/clover silage, which had a high emissions intensity in this region due to drought risks. Forage maize is cultivated up to about 60° latitude in Sweden, but yield and nutritional quality decrease with increasing latitude (Mussadiq et al., Reference Mussadiq, Hetta, Swensson and Gustavsson2011) and thus the positive effect of maize silage on ration CF and land use varies due to farm geographical location and the CF of the grass forage it replaces. Even if regional climate conditions are favourable for forage maize, the right field conditions also need to be available. It should also be noted that the positive effect found for forage maize is likely to be reduced since cultivation of an annual maize crop presumable causes more soil CO2 emissions compared with cultivation of perennial grassland crops (Vellinga and Hoving, Reference Vellinga and Hoving2011), this was however not captured in present CF estimates due to the exclusion of soil CO2 emissions.
By-products used for feed typically have relatively low emissions intensity and land use compared with feed crops and therefore have a positive effect on feed rations’ CF and land requirements. This is a consequence of the allocation of GHG emissions and land use between main product and by-product and is clearly exemplified here by the positive effect of pressed beet pulp silage from the sugar industry on South ration CF and land use efficiency (Figures 2 and 3). Another by-product with low emission intensity is distiller’s dried grain which in different shares was included in several of the concentrate products used in studied rations. The availability of by-products is however limited to a given quantity defined by the magnitude of the main produce. Unless there is an unused surplus of the by-product, using it as a mitigation option to reduce emissions at farm level will only be a shift of emissions between farms. Using animal edible by-products from food industry is however an important measure for the overall livestock sector as it has a reducing effect on emitted GHG.
Horse bean was another feedstuff that had a positive impact on ration CF in the present study (Figure 2) but, as for forage maize, this effect depended on where it is cultivated, as the yield decrease with latitude together with later maturation dates. However, unlike forage maize, horse bean can be more easily grown in one region and transported to another. A very important characteristic of horse bean is that its potential to lower the emissions associated with feed rations come with the cost of greater land use, for example the West ration had the lowest CF and the highest use of arable land (Figure 3). If horse bean is to be used as a measure to decrease milk CF on an aggregated national basis, its yield levels must be increased, as otherwise it will occupy land at the cost of growing other domestic crops.
Ration composition
The composition of feed rations is highly influenced by the nutritional and economic characteristics of individual feedstuffs. For example, in the present study use of higher silage quality in the NorFor model resulted in an increased share of silage and thereby changed the CF of the ration. Due to the fact that roughage constitutes around 50% of animal DMI and that its nutrient quality determines the concentrate composition, its GHG emission and land requirement will strongly influence the CF and land use efficiency of the overall ration. An increased share of roughage is however generally also associated with increased production of enteric methane emissions (Johnson and Johnson, 1995) but with high-quality silage this might not be the case (Patel et al., Reference Patel, Wredle, Börjesson, Danielsson, Iwaasa, Spörndly and Bertilsson2011; Brask et al., Reference Brask, Lund, Hellwing, Poulsen and Weisbjerg2013).
Overall ration composition is also affected when a particular feedstuff is replaced by another. For example, if a protein feed such as horse bean is substituted for soya meal, as in the West ration, this cannot be done without also changing the proportions and inclusions of other feedstuffs in the ration, as these two protein feeds have different protein qualities (Henriksson et al., Reference Henriksson, Swensson and Cederberg2013b). The positive effect that a particular feedstuff can have on ration CF and land efficiency depends thus on the feedstuff it replaces and the change in ration composition when it is included. These changes in ration composition shows the importance of assessing overall ration CF instead of that of individual feedstuffs when analysing measures to reduce emissions in milk production. The same applies for land use.
The effect of Brazilian soya meal on ration CF is uncertain due to the variation in options to estimate GHG emissions from LUC (Cederberg et al., Reference Cederberg, Henriksson and Berglund2013). The present study clearly showed that the magnitude of emissions from LUC strongly influence soya meal CF and thereby how other protein sources are evaluated in relation to soya meal in the context of GHG emissions. For purchased concentrates GHG emissions and land use vary due to the composition of the feedstuffs included. However there is limited scope at farm level to improve ration CF and land efficiency by choosing concentrate products with low emission and land use, as these are selected to balance other defined feedstuffs and also because CF and land efficiency are likely to change over time, as the relative proportions of ingredients vary due to availability and market price.
Present study estimated required crop land area for each ration as m2 (Figure 3), but the production potential for one m2 crop land varies due to regional conditions for crop cultivation. Another land indicator could thus be to relate area requirement with crop yields for each region. Doing this, the high land area required for the West ration (i.e. 2.2 m2/kg ECM; Figure 3) was estimated to produce the largest amount of spring barley which was 0.78 kg. The lowest land requirements which was found for the South and S West rations (i.e. 1.5 and 1.6 m2/kg ECM, respectively) were estimated to produce 0.59 and 0.58 kg barley, respectively, which were 25% more than production on crop land required for the S East and North rations (1.7 and 1.8 m2/kg ECM, respectively) which corresponded to 0.45 and 0.43 kg barley, respectively. This implies that high land use efficiency is especially important in regions with high yielding crop production.
Feed cultivation practices and management
How crops are grown will influence ration CF and land use efficiency. The general recommendation in Swedish milk production to improve silage quality can have a positive effect on ration CF if it can be achieved without increasing inputs of synthetic N fertiliser or diesel, as exemplified by the West ration (Figure 2). On the other hand, if the high-quality silage is achieved by an extra sward cut and increased N fertiliser rates while yield levels remain the same, the opposite effect can be expected (Henriksson et al., Reference Henriksson, Cederberg and Swensson2013a).
Yield levels of feed crops influence ration CF, especially grassland yields, and if they can be increased without increasing important inputs such as N fertiliser rates and diesel use (or if yields can be unchanged with reduced inputs) that can lower the ration CF. The sensitivity of feedstuff CF to yield and N fertiliser rates has also been shown by others, e.g. Middelaar et al. (Reference Middelaar, Cederberg, Vellinga, Werf and Boer2013). Management practices to improve crop yields (e.g. crop rotation, soil structure and manure management) can thus be used as a general measure to reduce ration CF and improve land use efficiency, as long as N fertiliser rates are adjusted to yields and cultivation conditions. The large influence of grassland yield on ration CF indicates how crucial it is to obtain and use accurate data on yield levels when estimating GHG emissions associated with dairy and beef production.
Another general measure of importance when seeking to improve emissions of GHG and land use efficiency is to reduce all DM losses of feed to a minimum, as they otherwise reduce the shares of harvested yield that are actually used (Henriksson et al., Reference Henriksson, Cederberg and Swensson2013a).
Conclusions
The CF and land requirement of dairy herd feed rations are highly dependent on the regional availability of feedstuffs and conditions for crop cultivation and should thus be considered in a regional context. The overall ration composition influences ration CF and land requirement more than the use of a particular specific feedstuff. However, maize silage and pressed beet pulp silage had a positive effect on ration CF and land requirement in this study. Inclusion of horse bean had the same positive effect on ration CF, but simultaneously increased the land requirement. However, these feedstuffs must be used with caution as general measures to reduce GHG emissions from milk production, since the effects are influenced by actual cultivation conditions and the emissions intensity of the feedstuff they replace. Also increased nutrient quality of grass/silage as a general measure to reduce emissions should be used with caution as the effect depends on cultivation practices for achieving the higher quality. The GHG emissions factor used for LUC is crucial for how soya meal is evaluated in relation to protein from domestic feedstuffs. Since cultivation practices, yield levels and DM losses significantly can influence ration CF and land use, improving input data for these variables should be prioritised in CF estimates of feed and milk.
Acknowledgements
The authors would like to acknowledge the valuable work and help with ration optimisation by Maria Åkerlind and feed advisors at Växa Sverige and the contribution of cultivation data from advisors at Swedish Rural Economy and Agricultural Society (Hushållningssällskapen). The Department of Sustainable Food Production at SIK, Gothenburg, provided good help, access to the feed LCA data base and use of LCA software tools. The study was performed with funding from the Swedish Farmers’ Foundation for Agricultural Research.