Implications
Chickens are incubated commercially in darkness throughout the entire 21 days, which is different from nature incubation. Light exposure is important for embryos development and circadian rhythm establishment. Our results recommend that application of green light during the first 18 days of incubation accelerated hatch of individual chick which may be due to the acceleration of embryo development and the alteration of hormone profiles.
Introduction
Broiler chickens are often incubated commercially in complete darkness. Under natural conditions, however, avian embryos would certainly receive some light stimulation during development. Day–night (light–dark) rhythms, mediated by high concentrations of the hormone melatonin (MT) at night and low levels by day, are a universal feature of living organisms (Schultz and Kay, Reference Schultz and Kay2003). Avian embryos, developing outside the maternal organism and without direct endocrine signals from the mother, may develop early internal circadian systems to cope with the new life outside the egg. The circadian rhythm in birds is indeed established early on in embryonic development and requires external cues (Nichelmann et al., Reference Nichelmann, Hochel and Tzschentke1999; Zeman et al., Reference Zeman, Gwinner, Herichova, Lamosova and Kost’al1999). Chicken pinealocytes, the brain cells that release MT, were shown to be very sensitive to light with an intensity of as little 10 lx in vitro and showed a circadian activity pattern (Faluhelyi and Csernus, Reference Faluhelyi and Csernus2007). Melatonin production starts early on in the incubation period: in chicken embryos from day 10, but no regular rhythm is detected until between day 16 and day 18 provided an external day/night rhythm is imposed. The amplitude of the rhythm increases considerably during the last 2 days of incubation at the time of internal pipping (IP) and external pipping (EP) and the beginning of lung respiration of the embryos (Starck and Ricklefs, Reference Starck and Ricklefs1998). However, in artificial incubation, eggs are handled under (almost) continuous darkness and a previous study showed that the hormone production of the pineal does not become rhythmic between day 15 and day 18 (high levels of MT release were experienced and showed apparently random alterations) (Csernus et al., Reference Csernus, Nagy and Faluhelyi2007). This suggests that no circadian rhythm develops during incubation in completely dark conditions, because of the lack of appropriate environmental signals stimulating the embryo. Establishment of the embryonic circadian rhythm can have impact on the functioning of the circadian clock of prenatal and perinatal chicks. The circadian rhythm established in the embryo determines the timing of hatching and the hatchlings day–night rhythm until at least 3 days after hatching (Zeman and Gwinner, Reference Zeman and Gwinner1993; Zeman et al., Reference Zeman, Gwinner, Herichova, Lamosova and Kost’al1999). The rhythm of MT levels, which is established in the embryo, can also affect behavioural rhythmicity (Archer et al., Reference Archer, Shivaprasad and Mench2009). Melatonin has been shown to act as an anti-stress agent. Melatonin can suppress stress-induced increases in rat plasma corticosterone (CORT) concentrations, and animals subjected to stress showed altered circadian patterns in plasma MT with elevated CORT concentrations (Mocchegiani et al., Reference Mocchegiani, Perissin, Santarelli, Tibaldi, Zorzet, Rapozzi, Giacconi, Bulian and Giraldi1999; Barriga et al., Reference Barriga, Marchena, Lea, Harvey and Rodriuez2002). Melatonin is able to modulate stress at both the central and peripheral levels by exerting its inhibitory role in the hypothalamic–pituitary–adrenal (HPA) axis in chicks and by suppressing CORT production (Saito et al., Reference Saito, Tachibana, Choi, Denbow and Furuse2005).
Melatonin rhythms during incubation can affect the behaviour, stress and hatch performance of poultry. However, there has been relatively little systematic work assessing the pattern and type of light stimulation needed to produce these effects or the mechanism underlying them. In the wild, an incubating hen generally comes off her nest once a day between 1100 and 1400 h, occasionally as early as 0925 h and as late as 1500 h, presumably when the eggs would be least subject to heat loss and are completely exposed to daylight. The time spent off the nest seems fairly consistent and averages 38.7±1.2 min (Duncan et al., Reference Duncan, Savory and Wood-Gush1978). In addition, when turning the eggs, the hen usually stands up, thereby exposing the eggs to more light and to lower ambient temperature. The temporary exposure to light means that the full spectrum of radiation may potentially reach the surface of the avian eggs. Depending on the nest environment, eggs will experience light from the heating IR wavelengths to the potentially mutagenic UV light. However, base colour pigments of eggshell are likely to control the light that reaches the embryo by blocking light of harmful IR and UV wavelengths but admitting beneficial wavelengths (Maurer et al., Reference Maurer, Portugal and Cassey2011). Previous studies have investigated the impact of light in the incubator environment. Exposing eggs to green light (1340 to 1730 lx) from 5 to 15 days of incubation increased embryo growth and hatchability by 4.8% (Shafey and Al-mohsen, Reference Shafey and Al-Mohsen2002). An overall improvement in the embryo/hatchling survival rate was also observed following a near-IR (630 to 1000 nm) light-emitting diode (LED) exposure. There were also increases in mean BW, crown–rump length (CRL), liver weight and decrease in hatchling residual yolk weight (as a function of post-hatch survival time and increased nutrient utilisation during development) (Yeager et al., Reference Yeager, Franzosa, Millsap, Angell-Yeager, Heise, Wakhungu, Lim, Whelan, Eells and Henshel2005). Continuous green light (1340 to 1730 lx) during the first 18 days of incubation accelerated hatching times by about 24 h in meat-type breeder eggs (Hybro). Far-red (670 nm) LED exposure once per day from 0 to 20 days of incubation resulted in chickens pipping (breaking the shell) 2.92 h earlier and there was a 2.91 h shorter duration between pip and hatch. Incandescent light (12L : 12D) accelerates hatching times (P<0.01) without affecting hatchability, weight at hatching, liver or heart growth in turkey eggs (Fairchild and Christensen, Reference Fairchild and Christensen2000; Shafey and Al-mohsen, Reference Shafey and Al-Mohsen2002; Yeager et al., Reference Yeager, Franzosa, Millsap, Angell-Yeager, Heise, Wakhungu, Lim, Whelan, Eells and Henshel2005). Therefore, light intensity can play an important role in the speed of development of the avian embryo and hatchability, at least in the domestic broiler chicken. Furthermore, light exposure and the source of light could prove to be important factors in achieving synchrony or significantly reducing the spread of hatch under artificial rearing conditions. Bird and human perception of colour differs. Human beings have three type of cones and birds have four which are responsible for seeing frequency (colours). Therefore, chicks can see much broader spectrum than human (Osorio et al., Reference Osorio, Vorobyev and Jones1999). A broader range of studies is available for the effect of wavelength, but the average wavelength of the most sensitive light for chicken embryos is about 550 to 560 nm (Rogers et al., Reference Rogers, Andrew and Burne1998) and green light seems to be the most effective in stimulating embryonic growth and development, as well as post-hatch growth in chickens (Halevy et al.,Reference Halevy, Piestun, Rozenboim and Yablonka-Reuveni2006; Rozenboim et al., Reference Rozenboim, El Halawani, Kashash, Piestun and Halevy2013).
It would appear that light can have significant impact on the developing chick embryo, however, it is far from clear what the optimal light intensity for embryonic development in the wild is, thus it is difficult to predict which lighting regimes have the most benefit in the incubator setting. Based on the natural incubation behaviour of mother hens, tightly controlled light intensities and wavelengths and natural patterns of illumination were applied in this study. The purpose was to examine the effect of green light during incubation upon the hatch process and to determine whether a MT rhythm would be established by such light stimulation, and the subsequent impact on thyroid and CORT hormone production which potentially regulates the hatching process.
Material and methods
Eggs and incubation
Animal experiments were performed with the ethics approval from the Royal Veterinary College Animal Ethics Committee. Four incubation trials were conducted. In each trial two incubators swapped between the control and light groups were used and each incubator was able to set 300 eggs in two trays (Petersime NV, Zulte, Belgium). In total, four batches of fertile Ross 308 eggs (600 each batch) were obtained from a local supplier (Henry Stewart & Co. Ltd, Lincolnshire, UK). The eggs were incubated using a standard incubation profile and the incubation conditions were continuously monitored and controlled by the incubator controller (Petersime BIO-IRISTM, Zulte, Belgium). All incubation conditions (machine temperature, humidity, CO2 concentration and ventilation rate) were identical in the two incubators.
Light protocol
A light–dark cycle (12L : 12D) was provided using green light (460 to 580 nm) in the first 18 days of incubation and no light–dark cycle in the last 3 days. The light cycle consisted of 12-h darkness followed by 12-h light period, which was controlled using a mechanical timer. The light period consisted of 4 h of low intensity (100 to 130 lx) green light, followed by 1 h continuous illumination at a high intensity at 1200 to 1400 lx and the remaining 7 h at the low intensity (100 to 130 lx) (Shafey and Al-mohsen, Reference Shafey and Al-Mohsen2002; Shafey et al., Reference Shafey, Al-Batshan, Ghannam and Al-Ayed2005). In the light group, to produce an even spread of illumination on the surface of each egg and no extra heat produced by the light source, the monochromatic light was provided by a total of 204 green low power LEDs (0.5 W Power PLCC4 SMT; AVAGO TECHNOLOGIES, California, US) mounted in a frame which was placed above the eggs. The light intensity at the egg surface was measured using a light meter (Testo luminous intensity measuring instrument 545, GmbH & Co., Lenzkirch, Germany). The light intensity could be guaranteed for the top tray, so only the eggs from top tray were sampled. However, the bottom tray was also set to ensure the other incubation parameters, such as heat production and CO2 concentration were not negatively affected. No light–dark cycle was provided in the control incubator.
Monitoring of hatch window and hatching time
The onset of hatch (IP) and hatch window (HW), of each incubation, was determined by the incubator controller (Petersime BIO-IRISTM) (Tong et al., Reference Tong, Mcgonnell, Romanini, Bergoug, Roulston, Exadaktylos, Berckmans, Bahr, Guinebretière, Eterradossi, Garain and Demmers2015). In total, 10 focal eggs in each incubator from the first two experiments and 20 focal eggs of each incubator from the last two experiments were randomly selected, weighted and individually labelled to determine the individual hatching time. During transfer to the hatchings baskets, each focal egg was placed in a specially constructed area within the top basket (using 8×8×8 cm3 metallic mesh grid). The hatching time of each focal egg was determined using eggshell temperature (EST) as previously described by Romanini et al. (Reference Romanini, Exadaktylos, Tong, McGonnel, Demmers, Bergoug, Eterradossi, Roulston, Garain, Bahr and Berckmans2013). The identification of hatching time is based on a registered EST drop (2°C to 5°C) when the chick emerges from the egg.
Hatch performance, embryo and blood parameters assessment
All eggs were candled on 18 days and 12 h of incubation time and those with evidence of a living embryo were transferred from the turning trays to hatching baskets within 0.5 h. Both incubators were stopped after 512 h (21 days and 8 h) of incubation. Hatchability (the percentage of fertile eggs that hatch), early death (ED) from day 0 to day 7, middle death (MD) from day 8 to day 15, late death (LD) from day 16 to day 21 and mortality were determined at the end of incubation based on breakout results. All the hatched chicks from the top basket of each group were scored for quality using a standardised method (Tona et al., Reference Tona, Bamelis, De Ketelaere, Bruggeman, Moraes, Buyse, Onagbesan and Decuypere2003) and chicks with full score (100%) were considered as first class chicks. Samples of three eggs or chicks were selected randomly from the top tray in each incubator and were collected at eight incubation stages: days 10, 12, 14, 16, 17, 18, 19 (IP), 20 (EP) and take-off (focal chick). Embryos or chicks were euthanized and blood was collected from allantoic vein or the left ventricle, respectively. The chicks and organs (heart, liver and stomach) were dissected and weighed. The length of the beak and third toe as well as the CRL were measured.
The blood of three embryos or chicks was sampled at every 3 h over an 18-h period (from 18:00 h of day 17 to 12:00 h of day 18), at IP on day 19, EP on day 20 and take-off on day 21. Different eggs or chicks were sacrificed at each time point of sampling. The blood sample was collected into a heparin tube and centrifuged at 3000 rpm for 10 min. The plasma was stored at −20°C until hormones measurement. The blood samples from embryos or chicks collected at the same time point were pooled to measure MT and other hatching-related hormones. Plasma hormones levels were measured using a commercial chicken MT ELISA kit, chicken triiodothyronine (T3) ELISA kit, chicken thyroxine (T4) ELISA Kit (CUSABUO BIOTECH CO. Ltd, Wuhan, China) and corticosterone HS EIA kit (IDS Ltd, Boldon, England).
Statistical analysis
Data were analysed using SPSS (PASW statistics 20) and was presented as the mean±SEM. A linear mixed model was used to analyse the effect of light treatments (control and light) on hatchability, mortality (ED, MD and LD), HW, chick quality and chick weight:
 $$Y\,{\equals}\,\mu {\plus}{\rm light}\,{\rm treatment}{\plus}{\rm incubator}{\plus}{\rm batch}{\plus}{\varepsilon}$$
A second linear mixed model was used to analyse the effect of light treatments and incubation stage on embryonic parameters, blood values and plasma hormones concentrations. The model was:
 $$\eqalignno{ Y\,{\equals}\, & \mu {\plus}{\rm light}\,{\rm treatment} {\plus}{\rm incubation}\,{\rm stage}{\plus}{\rm interaction}\, \cr & \left( {{\rm treatment}{\times}{\rm incubation}\,{\rm stage}} \right) {\plus}{\rm incubator}{\plus}{\rm batch}{\plus}{\varepsilon} $$
The µ is the overall mean and ε the residual error term. Light treatment, incubation stage, interaction, incubator were fixed effects; batch was a random effect. The interaction was removed from the original model when it was not significant. When the effect was statistically different (P⩽0.05), the means were further compared using LSD test or non-parametric statistics (only for chick quality).
Results
Hatch performance and embryo development
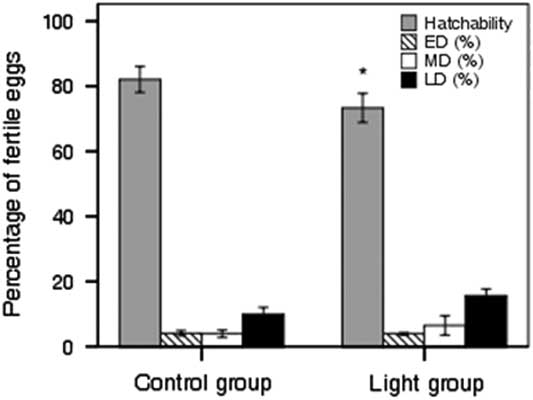
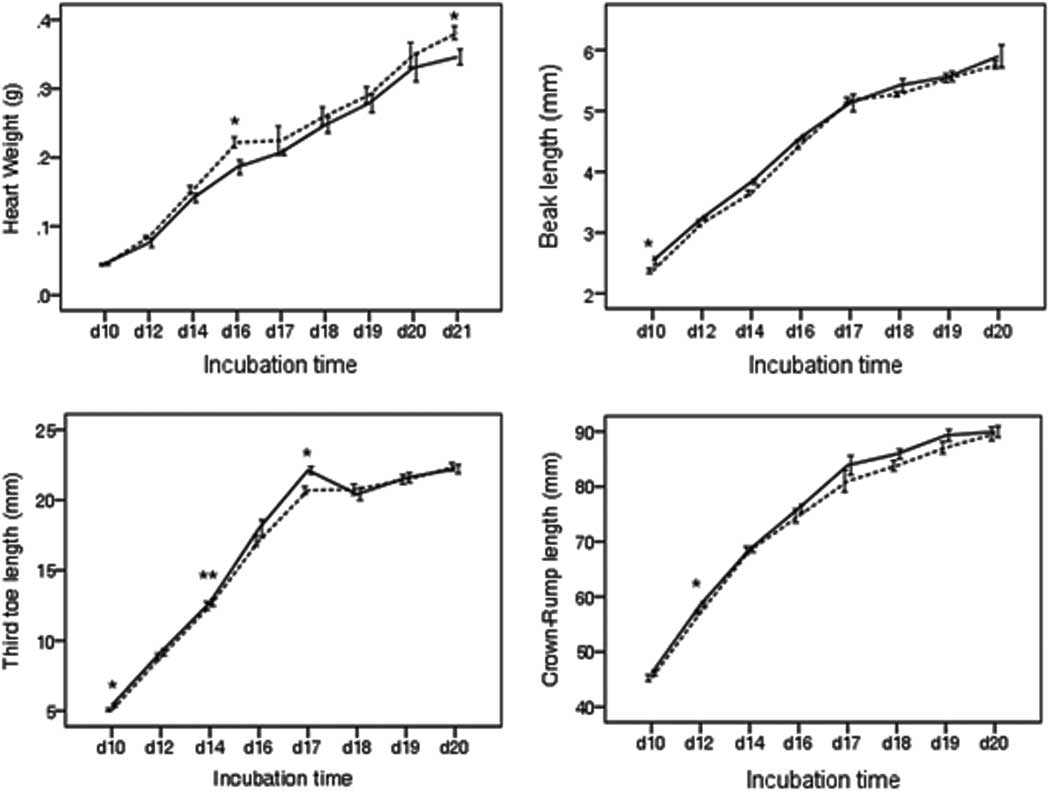
There was no effect of incubator on hatchability and different stages of mortality taking into account the batch effect. However, the hatchability of the control group was significantly higher than the light group because of the combination of mortality from three stages (Figure 1; P=0.03) (78.2% v. 73.7%). No effect of light treatment was found on chick quality and chick weight for four batches. The egg weight at setting for the control and light groups were 59.96±1.7 g and 59.58±1.7 g, respectively. The light treatment had an effect on the heart weight (P=0.001), beak length (P=0.006), third toe length (P=0.024) and the CRL (P=0.005) at specific stages but not throughout the incubation period. The differences in the heart weight, beak length, third toe length and the CRL between the control and light groups at each incubation stage are shown in Figure 2.
Mean of hatchability and mortality in the control group and the light group over four batches (n=1200 eggs at setting of each group, fertility varied from 82% to 96%). ED=early death from day 0 to day 7; MD=middle death from day 8 to day 15; LD=late death from day 16 to day 21. *Means significantly different between the control and light groups at P<0.05.

The heart weight, beak length, third toe length and crown–rump length of the control and light-exposed embryos or chicks from day 10 to day 21 of incubation time. Dashed lines indicate the control group and solid lines indicate the light group. Asterisk indicates significant difference between groups at a given incubation stage (*P<0.05, **P<0.01). Data are presented as mean±SEM (12 samples of each group at each incubation stage).

Hatch window and hatching time
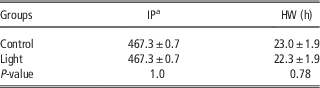
There was no effect of the light treatment and incubator on the initiation and the length of the HW of the entire batch (Table 1). Both groups started pipping around 467 h of incubation time. No difference in the hatching time of the first focal chicks in the control and light groups was observed, which was the same as the IP detected at the group level. However, the majority of focal chicks in the light group hatched earlier than the control focal chicks (P=0.049). The average hatching time of the focal chicks in the control and light groups were 487.4±1.2 h and 484.0±1.1 h, respectively. The focal chicks of the light group hatched 3.4 h earlier than the focal chicks of the control group.
Mean (±SEM) time of onset of internal pipping (IP) and length of hatch window (HW) of the control group and light group from four batches

a Hours of incubation time.
Melatonin and hatch-related hormones
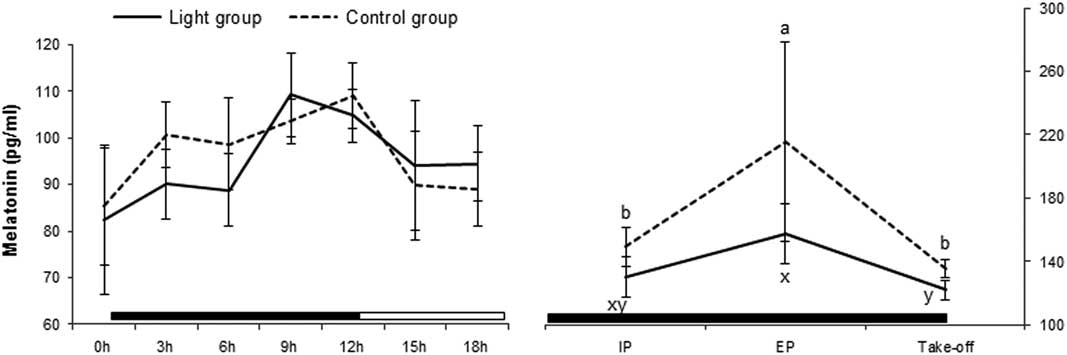
Overall the mixed effects models, taking into account batch effect, showed that there were no effects of light treatment and incubator on MT, T3, T4 and the T3/T4 ratio. However, the individual sampling time point had a significant impact on the plasma hormone levels (P<0.01). The plasma MT in the control and light groups from day 17 to day 21 is shown in Figure 3. There was no statistically significant difference in MT between groups at any time point in the 18-h period between days 17 and 18, however, there were differences in the pattern. In the control (no light group) MT levels increase rapidly in the first 3 h of the dark period (from 85.32 to 100.68 pg/ml) before levelling off at 6 h and experiencing a more gradual increase up to a peak at 12 h (109.07 pg/ml), experiencing an overall 1.28-fold change. In contrast, the light group experienced a much more gradual increase in the first 6 h (from 82.42 to 88.82 pg/ml), followed by a rapid increase at 9 h, which was the peak plasma level (109.23 pg/ml). The total increase was similar at 1.33 times of the base level. The control group showed a rapid decrease in plasma MT levels between 12 and 15 h (from 109.07 to 89.14 pg/ml) before returning to a similar level at 0 h (which was 85.32 pg/ml). In contrast, the light-exposed embryos experienced a gradual drop in MT levels from 9 h, that is, from the beginning of the dark period and continuing to drop to 94.55 pg/ml at 18 h of the light period. This level had not returned to the level seen at 0 h (which was 82.42 pg/ml) suggesting there would be further gradual decrease in plasma MT during the remainder of the light period. Data obtained during days 19 to 21 was at a period when both groups of eggs were in dark conditions. At the beginning of IP the levels of plasma MT had increased in both groups, with the control being higher than the light group (149.18 v. 130.34 pg/ml). These levels increased rapidly during the next 24 h, particularly in the control group (P=0.03), however, the data did not show any significant differences between groups. At take-off (day 21), plasma MT levels decreased significantly and returned to the levels seen at day 19 in both groups.
Plasma melatonin concentrations over an 18-h period from day 17 to day 18, internal pipping (IP) at day 19, external pipping (EP) at day 20 and take-off at day 21 of broilers incubated under the control and light groups. Solid line indicates the light group with a photoperiod of 12 h of light and 12 h of darkness for the first 18 days of incubation and no light–dark cycle for the last 3 days of incubation; the horizontal bars indicate the dark (closed) and light (open) periods of the photoperiod in the light group. Dashed line indicates the control group where eggs were incubated under darkness throughout the incubation. Data are presented as mean±SEM of four samples and each was pooled blood from three embryos or chicks at each time point. a,b/x,yMeans significant difference among the given time points within a group (P<0.05).

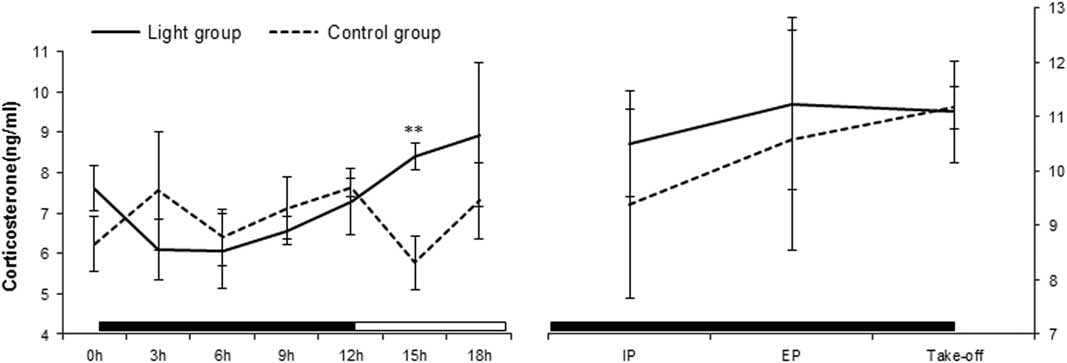
Figure 4 shows the 18-h pattern of the plasma CORT levels. In the control group, CORT varied between 6 and 7.5 ng/ml throughout the dark and light periods; in the light group CORT decreased slightly in the first 3 h of the dark period (from 7.61 to 6.10 ng/ml), followed by a steady increase until peaking at 18 h (8.94 ng/ml). Plasma CORT levels of the control chicks were numerically higher than those of the light-stimulated chicks in the 12-h dark period. This was reversed in the 12-h light period, where the light group had significantly higher CORT than the control group in the first 3 h of illumination (P=0.01). The plasma CORT levels increased in both groups from day 18 to EP. The higher trend was kept in the light group at IP and EP, but not statistically different between groups and then returned to the same level (11ng/ml) as at take-off.
Plasma corticosterone concentrations over an 18-h period from day 17 to day 18, internal pipping (IP) at day 19, external pipping (EP) at day 20 and take-off at day 21 of broilers incubated under the control and light groups. Solid line indicates the light group with a photoperiod of 12 h of light and 12 h of darkness for the first 18 days of incubation and no light–dark cycle for the last 3 days of incubation; the horizontal bars indicate the dark (closed) and light (open) periods of the photoperiod in the light group. Dashed line indicates the control group where eggs were incubated under darkness throughout the incubation. Data are presented as mean±SEM of four samples and each was pooled blood from three embryos or chicks at each time point. Asterisk Indicates significant difference between groups at a given time point (**P<0.01).

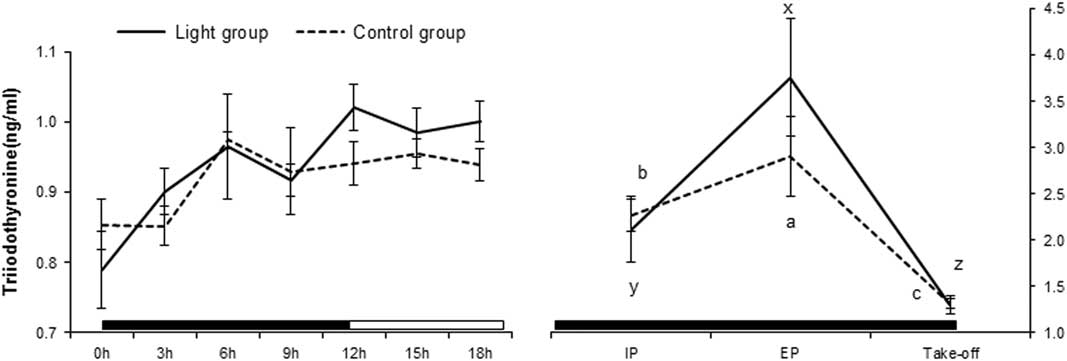
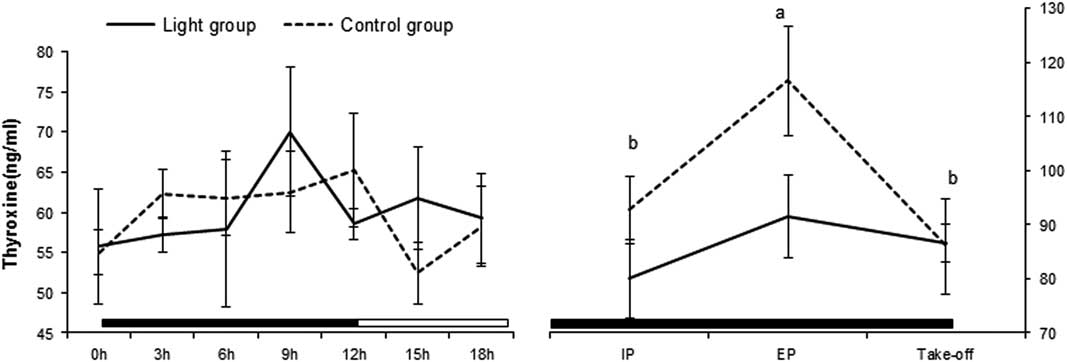
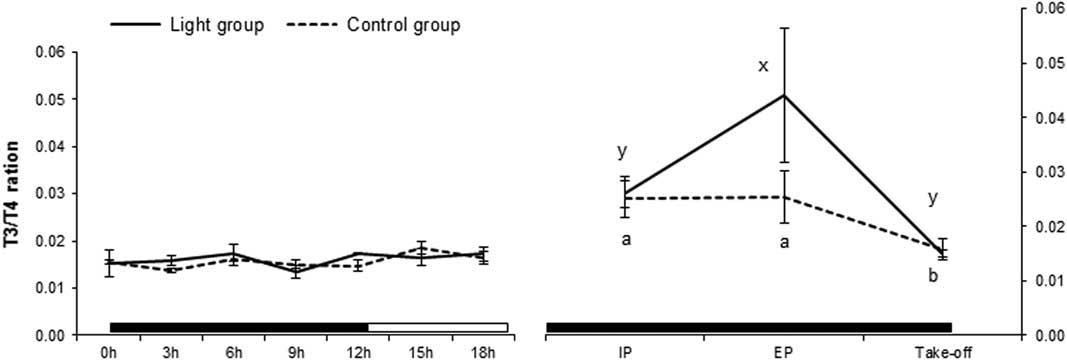
Plasma T3 followed a similar trend to CORT (Figure 5). There was no significant difference between the control and light groups in the dark period. In both groups, T3 levels increased rapidly in the first 6 h of the dark period, reaching the same levels (0.97 ng/ml) before dropping slightly in the next 3 h of the dark period. The light group increased further in the last 3 h of the dark period, peaking at 12 h (1.02 ng/ml), followed by being stable in the light period. The average T3 level in the light embryos was significantly higher than the control embryos (P=0.02) during this light period, indicating that light stimulation had an effect on T3 levels. The T3 levels increased significantly (more than doubled) from day 18 to IP in both groups, followed by another dramatic increase at EP which was the peak level (2.90 and 3.76 ng/ml in the control and light groups, respectively). However, the levels at take-off dropped significantly to the similar levels at days 17 to 18 in both groups. There were no differences in T3 concentrations between the control and light groups at IP and take-off, but the light-stimulated chicks had numerically higher T3 concentration than the control chicks at EP. The plasma T4 concentration is presented in Figure 6 and it showed a similar trend to MT between the control and light groups. The plasma T4 levels of the control embryos had an increase in the first 3 h of the dark period (from 55.03 to 62.24 ng/ml) before being stable over the next 6 h of the dark period and experiencing a slight increase up to a peak at 12 h (65.24 ng/ml). In contrast, the light group had a slight increase in the first 6 h, followed by rapid increase at 9 h, which was the peak plasma level (70.03 ng/ml), and experiencing a large drop at 12 h. The control group showed a rapid decrease in plasma T4 levels between 12 and 15 h (from 65.24 to 52.44 ng/ml) and had an increase at 18 h before returning to the same level at 0 h (58.27 ng/ml). However, the light-exposed embryos experienced a small increase in T4 levels from the beginning of the light period, followed by a minor drop into the same levels of the control group at 18 h. Plasma T4 increased significantly from days 17 to 18 to IP in both groups with the control being higher than the light group (92.79 v. 80.00 ng/ml). These levels kept increasing until peaking at EP, particularly in the control group (P<0.01). In contrast to T3, the control EP chicks tended to have higher T4 than that of the light-stimulated chicks. However, the data did not show any significant differences between groups. At take-off (day 21), plasma T4 levels decreased significantly in the control group (P<0.05) before returning to the same levels of the light group (86 ng/ml). The plasma T3/T4 ratio of the control and light groups for the observed part of the incubation period is shown in Figure 7. The T3/T4 ratio during the 18 h of days 17 and 18 was stable at 0.02 in both groups. However, this ratio started increasing before the onset of pipping and reached the maximum at EP in light group (0.04), whereas it remained at the same elevated level in the control group (0.03). These ratios at take-off in both groups returned to the same figure observed at days 17 and 18.
Plasma triiodothyronine concentrations over an 18-h period from day 17 to day 18, internal pipping (IP) at day 19, external pipping (EP) at day 20 and take-off at day 21 of broilers incubated under the control and light groups. Solid line indicates the light group with a photoperiod of 12 h of light and 12 h of darkness for the first 18 days of incubation and no light–dark cycle for the last 3 days of incubation; the horizontal bars indicate the dark (closed) and light (open) periods of the photoperiod in the light group. Dashed line indicates the control group where eggs were incubated under darkness throughout the incubation. Data are presented as mean±SEM of four samples and each was pooled blood from three embryos or chicks at each time point. a,b,c/x,y,zMeans significant difference among the given time points within a group (P<0.05).

Plasma thyroxine concentrations over an 18-h period from day 17 to day 18, internal pipping (IP) at day 19, external pipping (EP) at day 20 and take-off at day 21 of broilers incubated under the control and light groups. Solid line indicates the light group with a photoperiod of 12 h of light and 12 h of darkness for the first 18 days of incubation and no light–dark cycle for the last 3 days of incubation; the horizontal bars indicate the dark (closed) and light (open) periods of the photoperiod in the light group. Dashed line indicates the control group where eggs were incubated under darkness throughout the incubation. Data are presented as mean±SEM of four samples and each was pooled blood from three embryos or chicks at each time point. a,bMeans significant difference among the given time points within a group (P<0.05).

Plasma triiodothyronine/thyroxine (T3/T4) ratio over an 18-h period from day 17 to day 18, internal pipping (IP) at day 19, external pipping (EP) at day 20 and take-off at day 21 of broilers incubated under the control and light groups. Solid line indicates the light group with a photoperiod of 12 h of light and 12 h of darkness for the first 18 days of incubation and no light–dark cycle for the last 3 days of incubation; the horizontal bars indicate the dark (closed) and light (open) periods of the photoperiod in the light group. Dashed line indicates the control group where eggs were incubated under darkness throughout the incubation. Data are presented as mean±SEM of four samples and each was pooled blood from three embryos or chicks at each time point. a,b/x,yMeans significant difference among the given time points within a group (P<0.05).

Discussion
Green light stimulation during incubation has been reported to accelerate chick embryo development (Zhang et al., Reference Zhang, Zhang, Wang, Wu, Qiao, Yue, Yao and Qi2014). The results shown in this study also indicated that broilers incubated under a 12L : 12D cycle using green light for the first 18 days not only hatch earlier, but grow faster as significant increases in beak length, third toe length and CRL were found at some incubation stages. However, overall BW did not increase. Poultry are usually incubated commercially in complete darkness due to concerns about potential adverse effects of light stimulation on performance and economics, for instance, decreased hatchability due to secondary heating (Archer et al., Reference Archer, Shivaprasad and Mench2009). Previous published studies have reported different effects of light stimulation during incubation on hatchability due to the spectral characteristics of light and the photoperiod. Archer and Mench (Reference Archer and Mench2014) demonstrated that there was no effect on hatchability when different photoperiods were applied using full-spectrum fluorescent light with the intensity of 550 lx throughout incubation. In addition, Zhang et al. (Reference Zhang, Zhang, Wang, Wu, Qiao, Yue, Yao and Qi2014) reported no effect of continuous green light of 15 lx during incubation on hatchability and hatching. However, in the current study a significant decrease in the hatchability was found in the green light incubation. This may be due to the absence of light–dark cycle from day 19 or the reduced heart weight observed in light exposure embryos. This has not been studied or reported before. Another study showed that the heart rate of chicken embryos responded to the injected MT (Höchel and Nichelmann, Reference Höchel and Nichelmann2001). Therefore, the changed pattern of MT in the light incubation may also affect the cardiac function of chicken embryo. It has been reported that the rhythm of MT synthesis in embryos can be synchronised by ambient light–dark cycles and requires a photoperiod longer than 8 h for its proper functioning (Zeman et al., Reference Zeman, Gwinner, Herichova, Lamosova and Kost’al1999). Theoretically, the production of MT by the pineal gland is elevated by darkness and suppressed by the presence of light, respectively, which establishes the circadian rhythms. In the current study, although there were no significant differences, there were still different trends in the patterns of plasma MT levels in 17- and 18-day-old chicken embryos, which were incubated under darkness compared with 12L : 12D. The plasma MT levels of 12 h light-exposed embryos experienced an increase until 9 h of darkness when the increase in MT tailed off and subsequently the MT dropped during the light period. This confirms the theory that the light exposure suppressed the MT release during the light period. The significant rhythmic patterns of plasma MT have also been reported on day 19 or day 20 (Zeman et al., Reference Zeman, Gwinner, Herichova, Lamosova and Kost’al1999; Archer and Mench, Reference Archer and Mench2014) under 12D : 12L incubation. Archer and Mench (Reference Archer and Mench2014) have demonstrated that the plasma MT levels during the light period at day 19 broilers incubated under 12L : 12D were almost identical to dark incubated embryos, but it elevated during the dark period while the control birds still maintained at the same level. Their results confirm that the light period is required to trigger the increase during the dark period. Without this dark–light rhythm there is only a somewhat steady MT concentration in the continuous dark at the same level as in the light condition.
The rhythm of MT release may also influence the rhythms of other hormones (Starck and Ricklefs, Reference Starck and Ricklefs1998). However, little is known of the ontogeny of circadian patterns of secretion of other hormones in birds. A daily rhythm in plasma CORT has only been reported in adult birds and the peak occurs at the transition of dark to light (Sato and George, Reference Sato and George1973). The present study showed that plasma CORT concentrations of 17- and 18-day-old embryos decreased during the dark period and increased during light period. This indicated that light stimulated the secretion of CORT in the embryo which is in agreement with previous reports that CORT response to light is opposite that of MT in broiler and human (de Jong et al., Reference Decuypere and Bruggeman2001; Cutolo et al., Reference Cutolo, Sulli, Pizzorni, Secchi, Soldano, Seriolo, Straub, Otsa and Maestroni2006). The underlying mechanism is the ability of MT is able to inhibit the HPA axis and thus suppresses the concentrations of CORT and ultimately thus reduces stress, potentially a significant factor for the rest/sleep phase in the dark period.
It has been shown that administration of CORT to chicken embryos was followed by an increase of the plasma T3 levels and T3/T4 ratio (Jenkins and Porter, Reference Jenkins and Porter2004). In this study, both plasma T3 and CORT showed the same increasing trend in light-stimulated embryos conforming that CORT may affect T3 or vice versa through light stimulation. This suggested that thyroid hormone concentrations (T3 and T4) were affected by the circadian rhythms of MT via photoperiod. The different opposed rhythmic patterns of T3 and T4, with plasma T3 concentrations decreasing during the night and increasing during the day and plasma T4 concentrations peaking during the night and lower at day, were also found in chicks during the 1st week post-hatch, and were deemed to be controlled by the feeding pattern (Newcomer, Reference Newcomer1974; Klandorf et al., Reference Klandorf, Sharp and Duncan1978). The same patterns of plasma T3 and T4 levels in chicken embryos were also found in our study when they were exposed to a photoperiod of 12D : 12L.
Light stimulation causing the alteration of hormones may in turn affect hatching behaviours. Our results showed that the concentrations of MT, T3, T4 and CORT increased significantly from the onset of pipping. It has been reported that the high plasma T3 levels occur when the pulmonary respiration initiates (Decuypere and Bruggeman, Reference de Jong, Van Voorst, Erkens, Ehlhardt and Blokhuis2007). Here, the T3 levels of embryos increased significantly from IP to EP in both control and light groups. Moreover, the control embryos had higher plasma MT and T4 levels, whereas the light-exposed embryos had higher plasma CORT, T3 levels and T3/T4 ratio at EP. These different patters suggested that the first 18 days light stimulation seems likely to have a consequent impact on hormones levels during hatch. However, all returned to the same levels at take-off. Light-exposed chicks hatched about 3.4 h earlier in this study probably due to the elevated levels of CORT, T3 and T3/T4 ratio which are considered important for stimulating a variety of developmental and metabolic process necessary for hatching (Carsia et al., Reference Carsia, Morin, Rosen and Weber1987). However, it is still unclear that whether the early hatch is directly related to the change in hormones or the strengthened rhythms.
This study was conducted to evaluate the effect of a 12-h light, 12-h dark photoperiod of green light during incubation on embryo growth, hatch performance and the hatch process. At the group level, light stimulation had no effect on chick weight and quality at take-off, the initiation of hatch and HW, but with a reduced hatchability. However, the individual hatching time of the light-stimulated focal chicks was 3.4 h earlier than the control focal chicks. The results of this study indicated that green light accelerated embryo development and altered plasma MT, CORT, T3 and T4 concentrations. Further work is required to understand if and how such altered hormone profiles impact upon hatching time.
Acknowledgements
This research is a part of the BioBusiness Project (FP7-PEOPLE-ITN-2008) which is supported by the EU Commission and Marie Curie Initial Training Network. The authors are grateful to Dr Yumei Chang for statistical advice and the support of Biological Services Unit at the Royal Veterinary College.