


1. Introduction
Mass-balance observations are a key to the validation of models aimed at calculating volume changes of an ice sheet. In recent years, our understanding of accumulation over Greenland has significantly improved (Reference Thomas, Bamber and PayneThomas, 2004). A weak point in the observational evidence for mass-balance changes relates to the ablation area (e.g. Reference Van de Wal, Bamber and PayneVan de Wal, 2004). This is due partly to the large logistical efforts required for fieldwork, but also to the limited possibility of remote-sensing techniques. As a result, time series of mass-balance measurements in the ablation area spanning several decades do not exist for Greenland. Reference ReehReeh (1991) and Reference Van de WalVan de Wal (1996) summarized 1–7 years of surface mass-balance observations from six transects. A more general study of the internannual variability of the mass balance over the entire ice sheet is presented by Reference Six, Letréguilly and ReynaudSix and others (2001). This study indicates spatial homogeneous variations in the ablation area, but not in the accumulation zone. Here, we report on what is, to our knowledge, the longest currently available mass-balance series from the ablation zone.
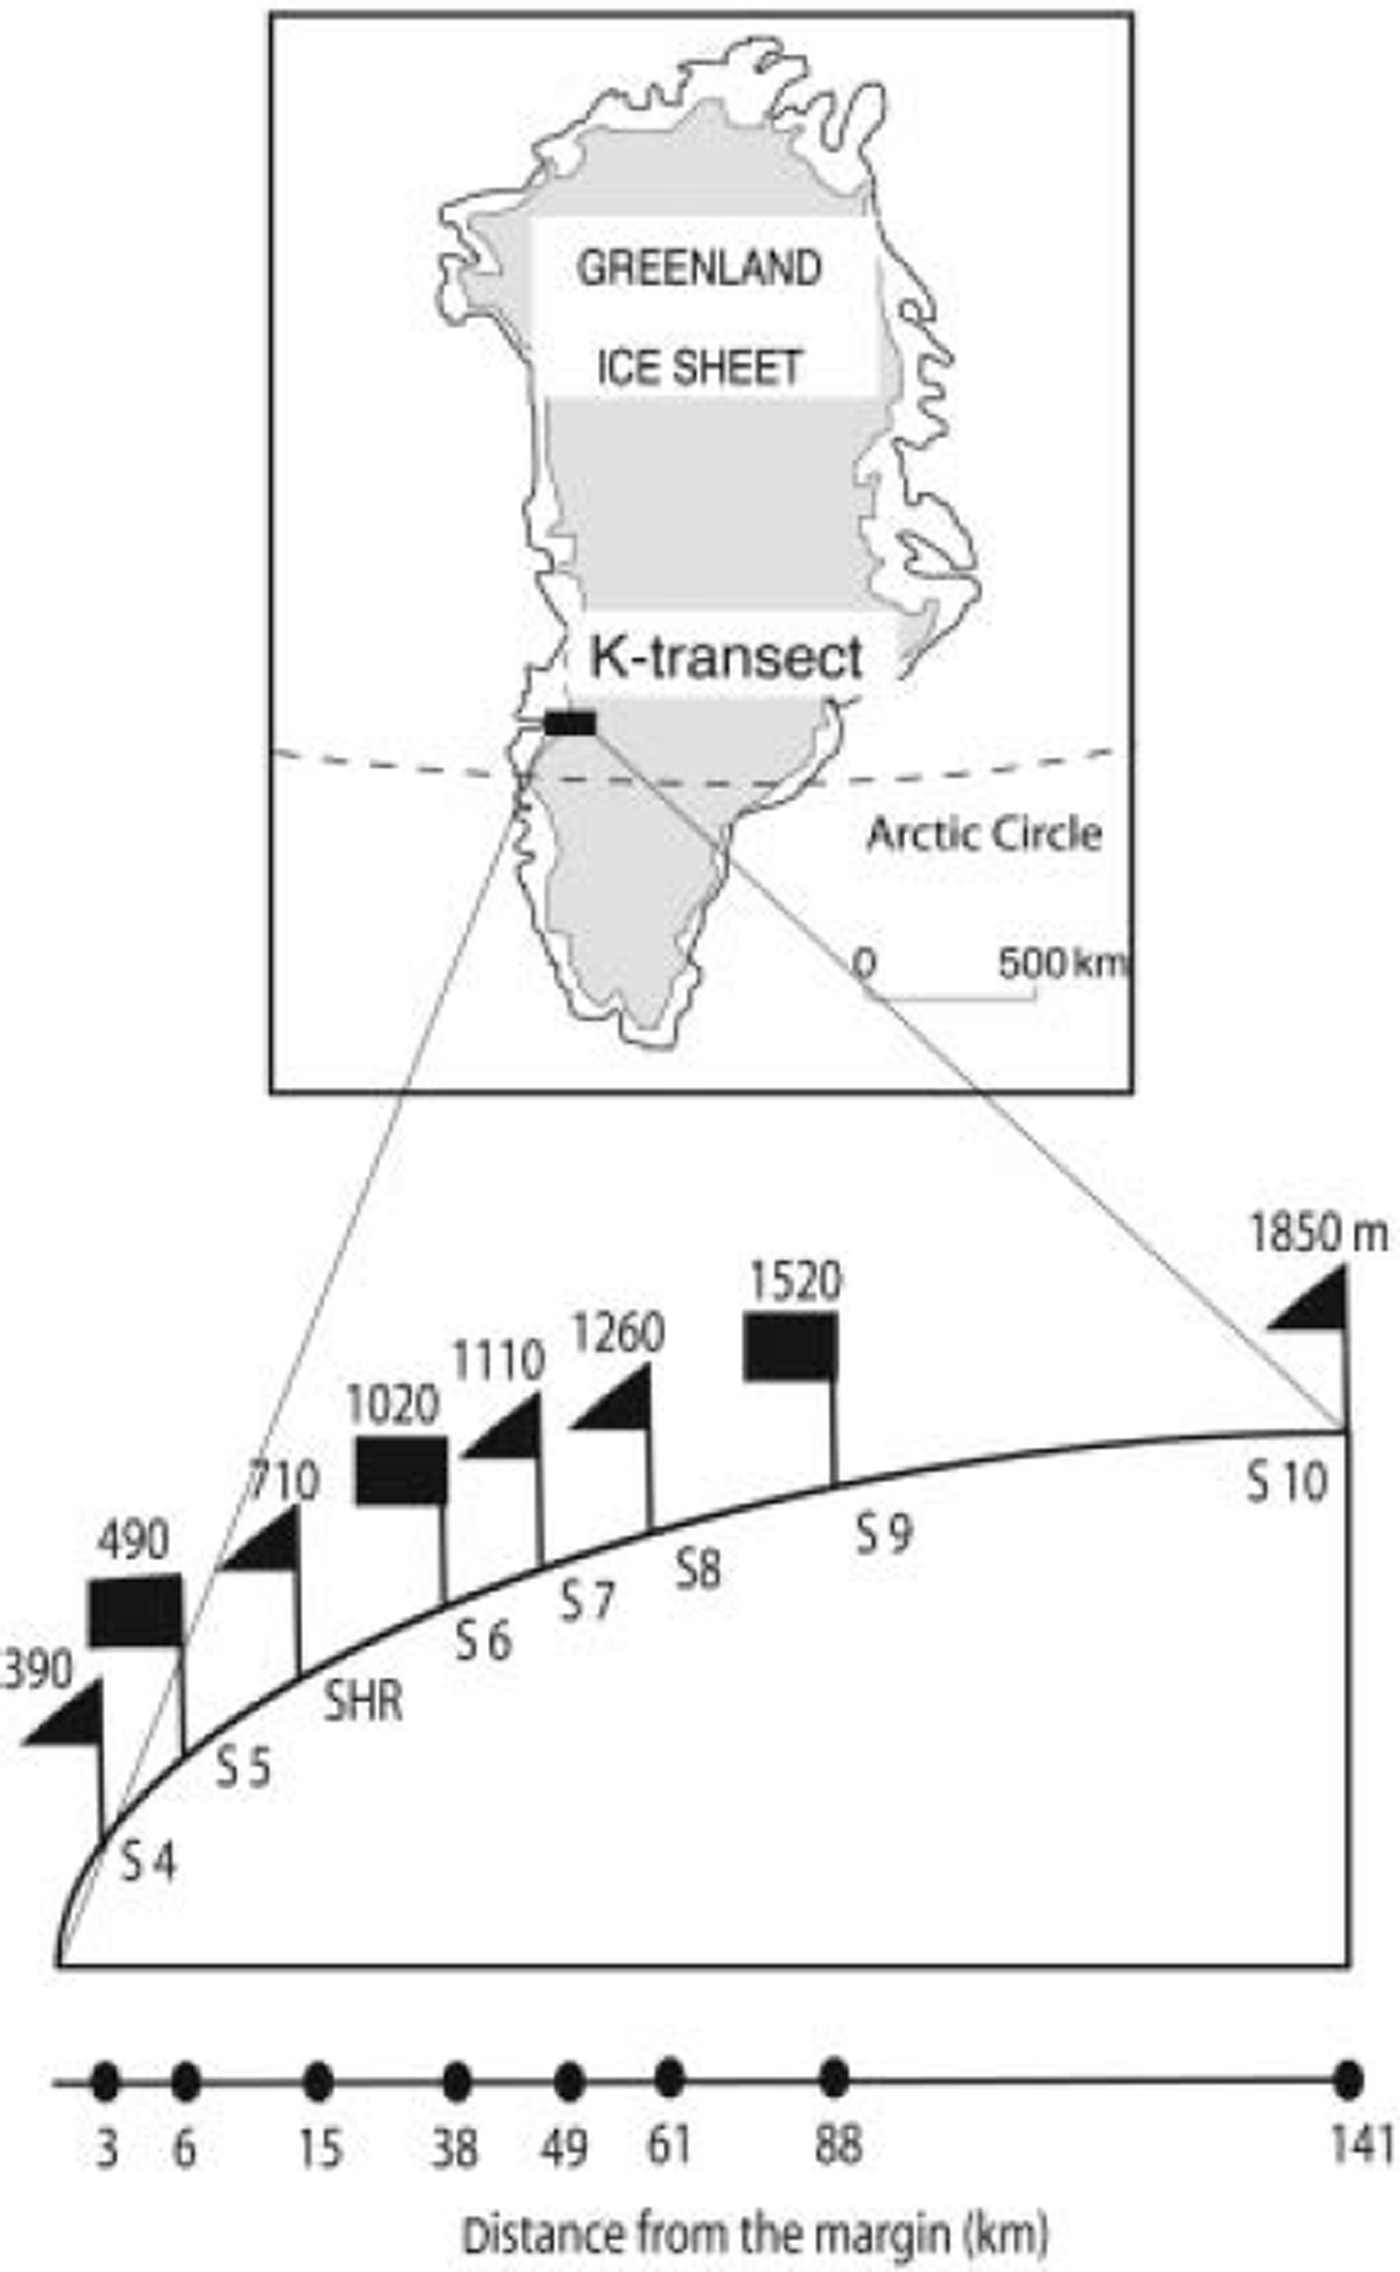
Measurements have been performed since 1990 along a transect near Kangerlussuaq (K-transect) at 67˚ N on the western part of the Greenland ice sheet (Fig. 1). This area is characterized by relatively high ablation (4–5m a–1 near the margin) and low accumulation (0.3m w.e. a–1). The measurements are a follow-up to two micrometeorological experiments carried out in the summers of 1990 and 1991. Results were described in a special issue of Global and Planetary Change (volume 9) in 1994. In addition, we initiated automatic weather station (AWS) measurements in the ablation area in the mid-1990s. Results of the surface mass-balance measurements were presented by Reference Van de WalVan de Wal and others (1996) and Reference Greuell, Denby, van de Wal and OerlemansGreuell and others (2001). Here, we extend the earlier record of surface mass-balance measurements to the period 1990–2003 (section 2) and show some first results from the AWS (1020m a.s.l.) over the last 5 years of the surface mass-balance record (section 3). Sonic height ranger data provide insight into ablation and accumulation processes on an hourly basis over the entire year. These data are used for an energy closure approach in order to explain the interannual variability in the ablation during a summer month (section 4).
The K-transect. The triangles indicate mass-balance sites, the squares AWS sites in August 2004. The elevations are the average elevation over the period 1996–2002 as measured by global positioning system.
2. Surface Mass-Balance Measurements
The transect runs from an elevation of approximately 390 m near the margin to an elevation of 1850 m in the accumulation zone. Altogether, eight sites are used to study the change of the surface mass balance with elevation. Six sites are located in the ablation area, one near the equilibrium line and one in the accumulation zone. Visits to the sites were made by helicopter, usually around 20 August, except in 1990 (21 July), 1991 (5 August) and 1992 (12 August). This means that the first three mass-balance years are slightly longer than a year and that no separate winter balance data are available.
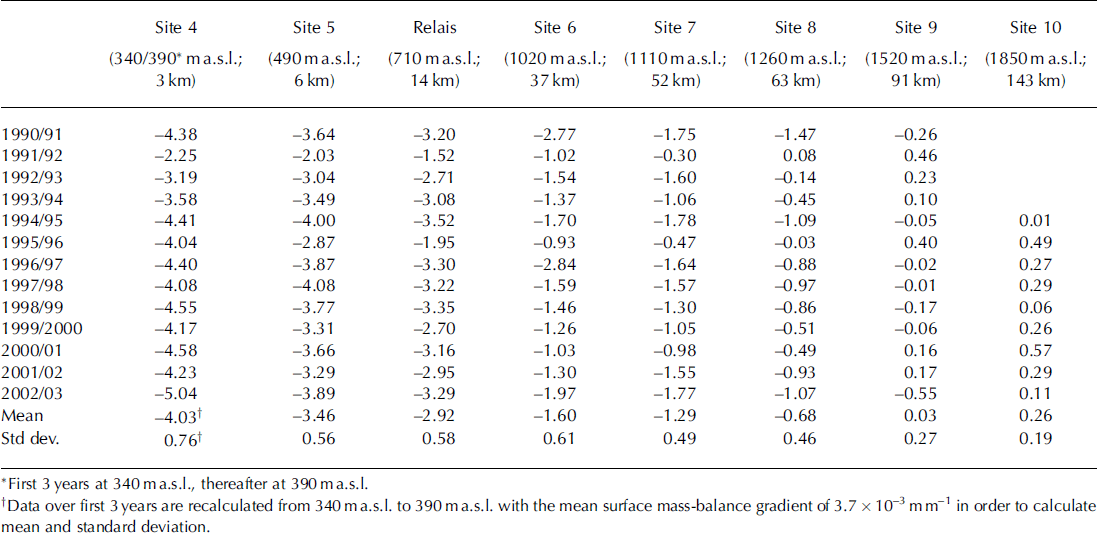
At each site, at least two stakes were maintained throughout the entire period. The data presented in Table 1 and Figure 2 are the mean values of the individual stake readings. Length changes are converted to surface mass balance by assuming an ice density of 900 kg m–3, except at the highest site where the density of the snowpack was measured. Internal accumulation was not measured. Figure 2 shows the surface mass balance as a function of elevation for each individual year. The mean equilibrium-line altitude (ELA) is 1535 ma.s.l, near site 9, and the average surface mass-balance gradient is 3.7×10⁻³mm–1 in the ablation area. This gradient is comparable to that measured at other sites in West Greenland (e.g. Reference ThomsenThomsen, 1987; Reference Braithwaite and OlesenBraithwaite and Olesen, 1989).
Surface mass-balance measurements (in m w.e.) along the K-transect at 67˚ N. Distances are presented in kilometres from the western ice margin
Surface mass-balance measurements as a function of elevation, for the period 1990–2003. The thick line is the mean over the entire period.
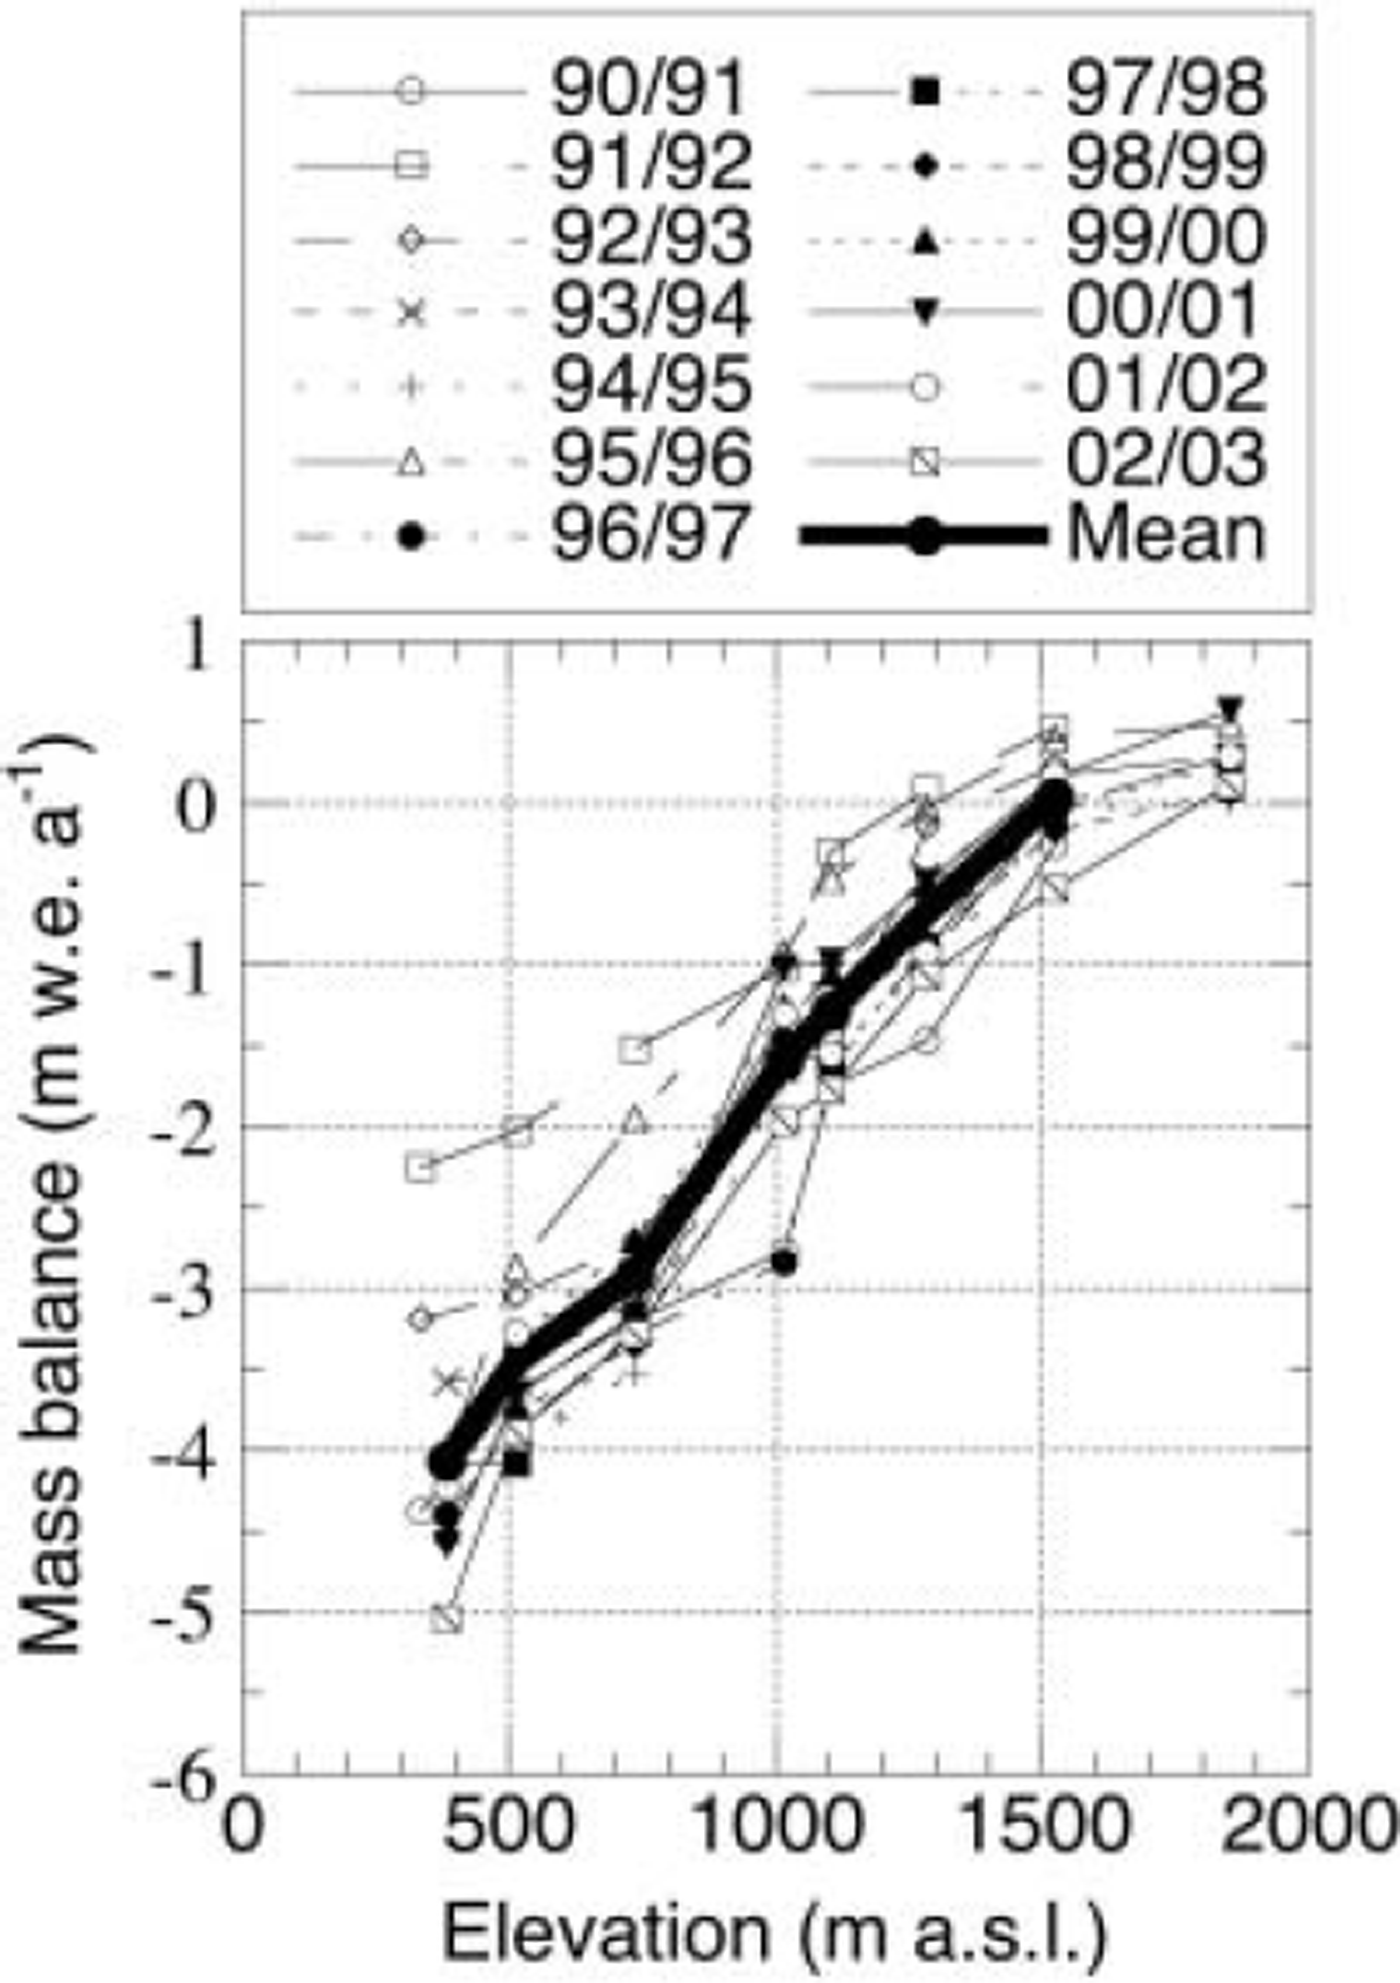
Though the average surface mass balance increases almost linearly with elevation, strong deviations occur in measurements for single years. The deviations are concentrated around an elevation of 1000 m. The years 1990/91 and 1996/97, in particular, show a steepening of the surface mass-balance gradient. The years 1992/93, 1994/95 and 2001/02 show a reversed pattern, with higher ablation rates at 1100 ma.s.l. than at 1000ma.s.l. These deviations are likely caused by changes in the albedo (e.g. Reference Greuell and KnapGreuell and Knap, 2000).
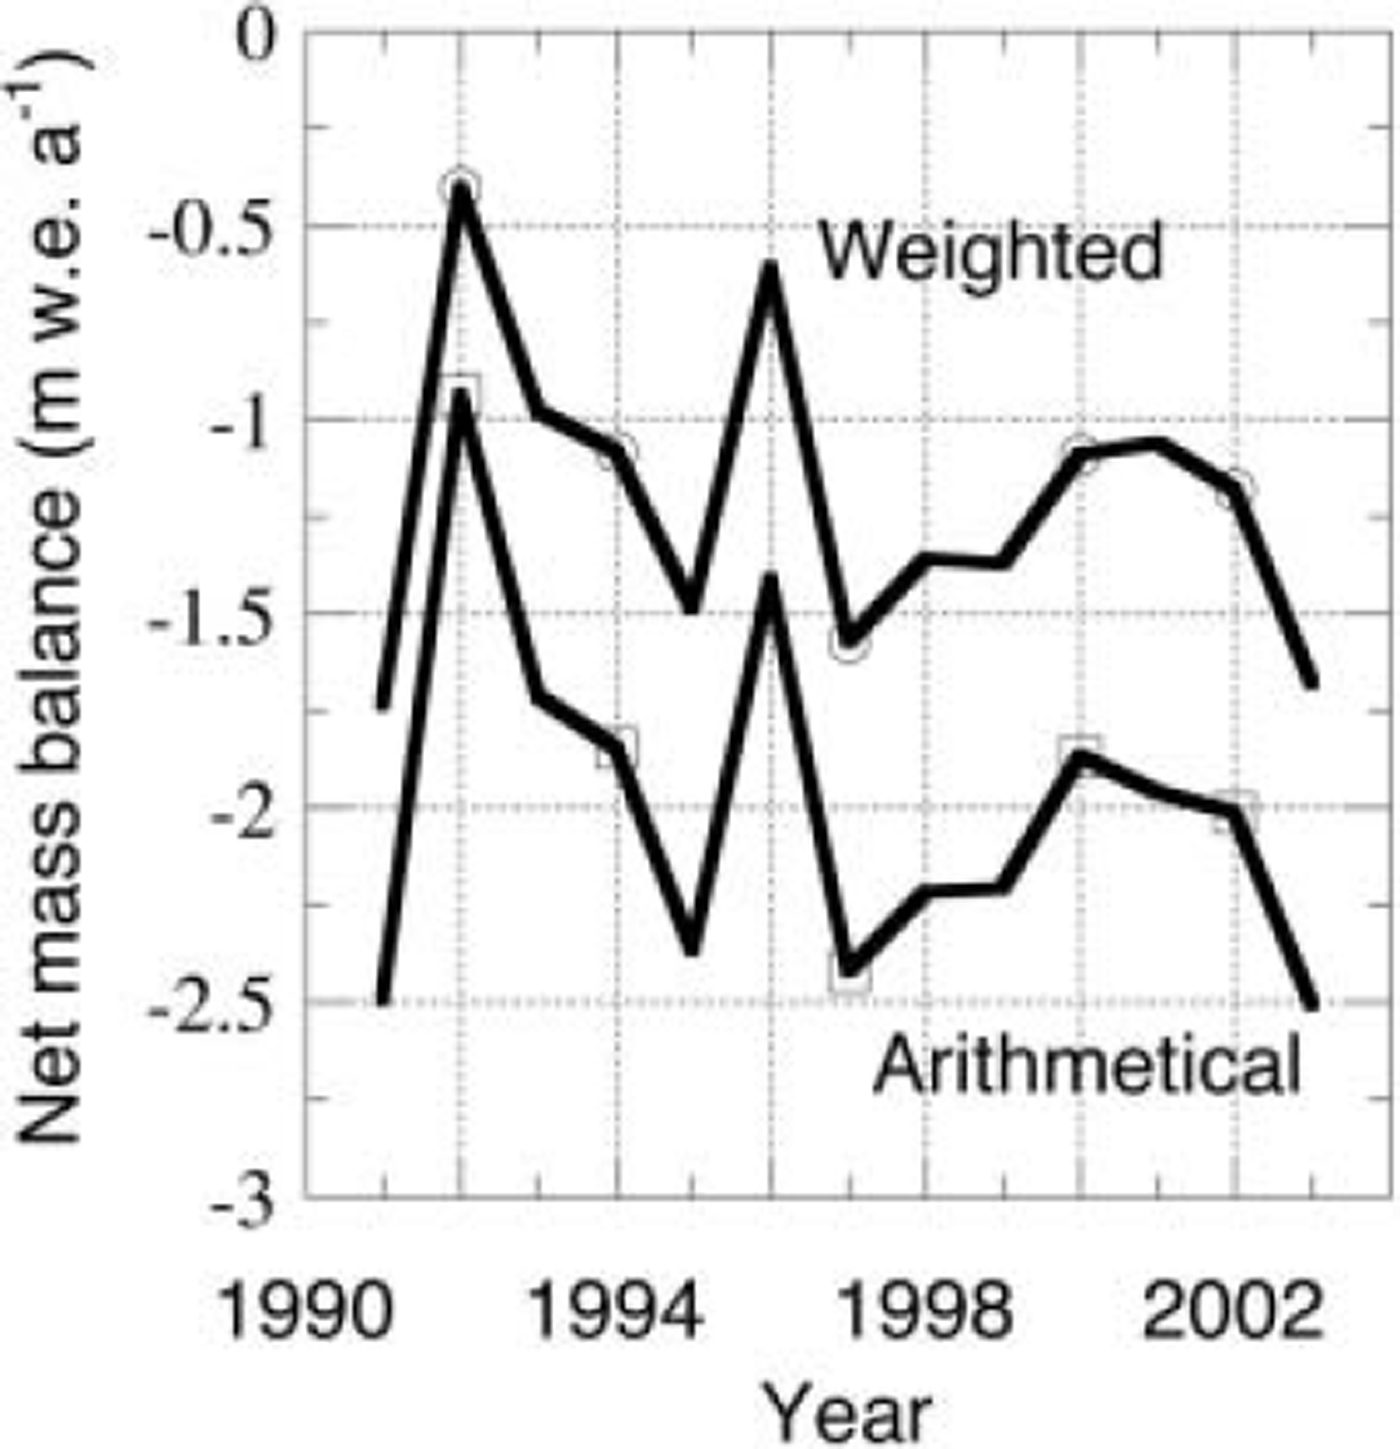
Figure 3 shows the interannual variation of surface mass balance averaged along the transect, calculated both as a weighted average and as an arithmetical average. For the weighted average, the distance between the sites was taken into account. The weighing factor is taken to be proportional to distance between the neighbouring points. Since the distance between the sites increases with elevation, the weight of the individual sites increases with elevation. This opposes to some extent the observation that the interannual variations are largest in the lower parts of the ablation area. For this reason, we also show in Figure 3 the arithmetical average of the sites. The figure shows that there is no trend in the data, but rather some periodicity. A spectral analysis shows a peak at 4years with a significance level of 70%. Here, it should be kept in mind that the entire series is only 13 years long and that the first three mass-balance years are slightly longer than a year, which might cause some bias in the averaged data presented in Figure 3.
Averaged surface mass balance for sites 4–9 over the entire period. The upper curve shows the weighted mean, and the lower curve the arithmetical mean (see text). Spectral analyses show a weak 4 year periodicity. Measurements were done at 340 ma.s.l. for the first 3 years, thereafter at 390 m a.s.l.
3. Automatic Weather Station Measurements
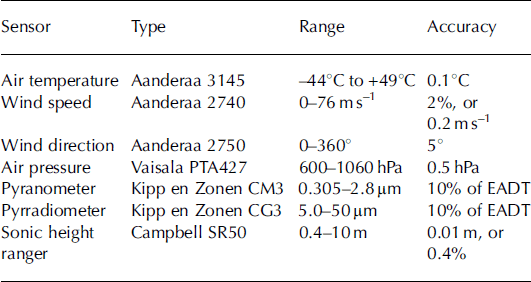
In this study, we also use data from an AWS situated at site 6. Five years of measurements are available covering the period 1997–2002. Measurements of radiation, temperature, wind speed and direction were performed at a height of approximately 4 m above the surface during the period 1997–2000 and at 6 and 2 m above the surface from 2001 onwards. Air pressure was measured in the electronics enclosure close to the surface (Table 2). The mast construction rests on four legs, and sinks with the surface during the ablation period. As a result, the measurement height is more or less constant in time. Data were sampled instantaneously every 6 min (but wind speed is cumulative), then averaged and stored every hour for the period 1997–2001 and every 0.5 hours in 2002 on a Campbell CR10 data logger.
AWS sensor specifications. EADT is estimated accuracy for daily totals
3.1. Meteorological characteristics at 1020 m a.s.l
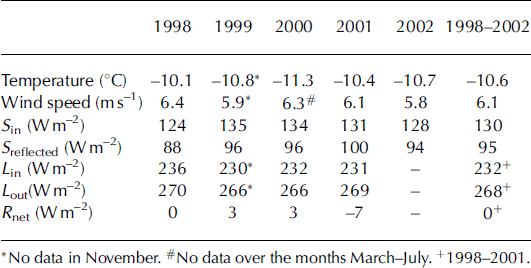
The meteorological conditions are summarized in Tables 3 and 4. In Table 3 we present the annual mean temperature, wind speed and radiation components, and in Table 4 their averages over the summer period. The summer period is defined as the months June–August, during which most of the ablation takes place. It is observed that variations in the different meteorological quantities are limited. If one defines interannual variability as the standard deviation among the different years divided by the mean of a quantity, one finds variations of only 4–5% for wind speed, shortwave incoming radiation, reflected shortwave radiation and incoming longwave radiation. The variation in mean outgoing longwave radiation is even smaller (only 1%). The latter can be attributed to the dominant signature of the temperature, with a flat maximum around melting point during the three summer months at 1020 ma.s.l.
Basic meteorological quantities over the period 1997–2002 at site 6 along the K-transect. Data are mean annual data
As Table 3, but now for the summer period only (June–August)+ 1998-2001.
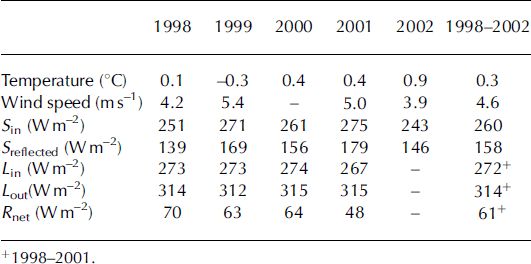
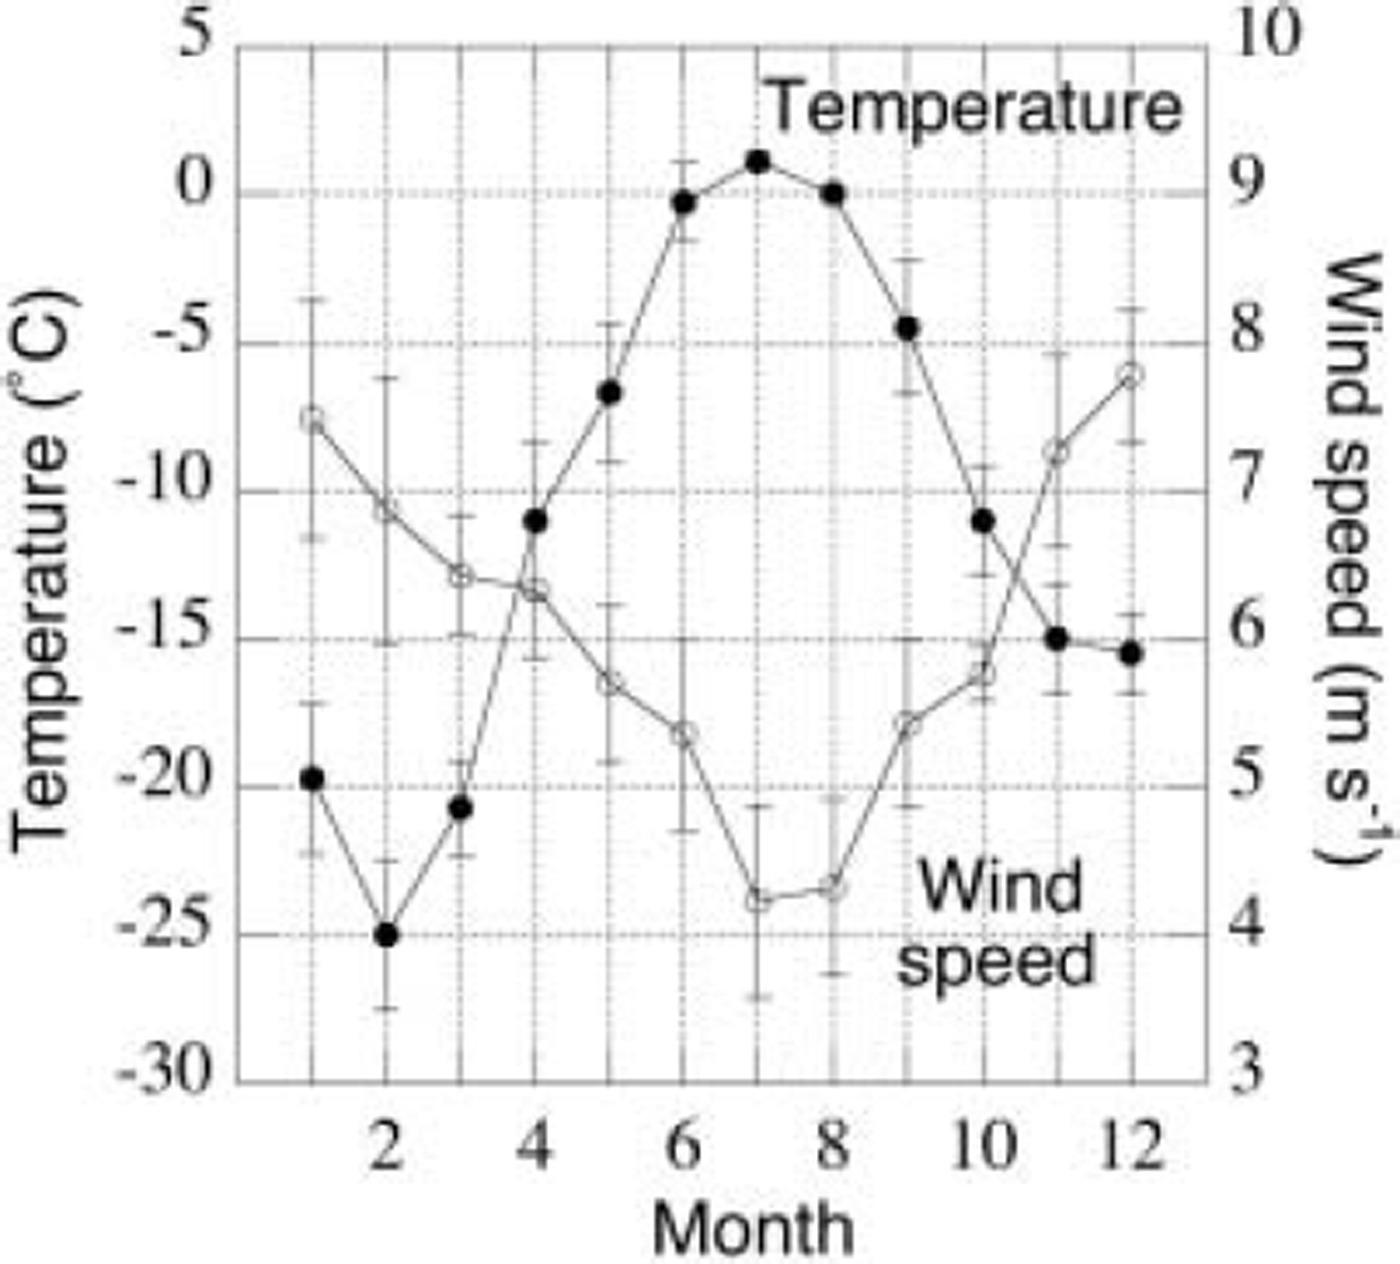
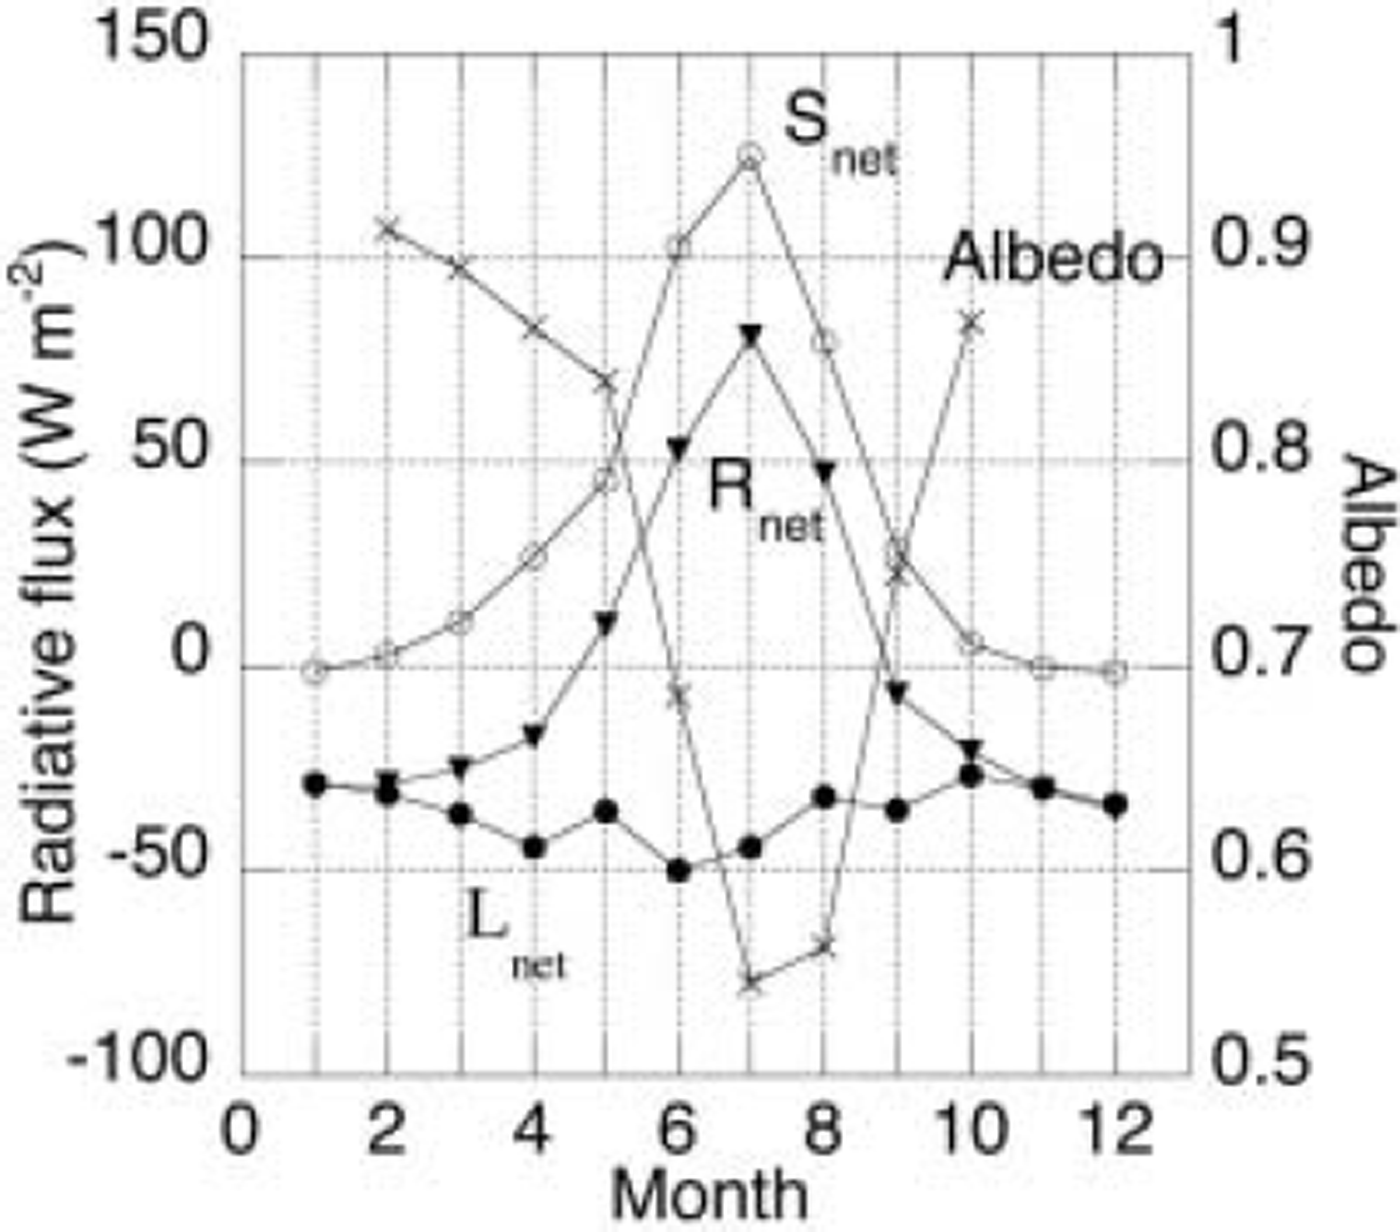
Figure 4 presents the mean yearly cycle for the station temperature and wind speed. Katabatic forcing is strongest in winter, leading to 6m wind speeds of approximately 8ms–1 on average, whereas the mean wind speed in summer is approximately 5 m s–1. The flat temperature maximum leads to a nearly constant outgoing longwave radiation in summer. In summer, variations in the reflected shortwave radiation dominate the interannual variability of the net radiation. The interannual variability in reflected shortwave radiation during the summer is 10%. The absolute interannual variability in incoming and reflected radiation is 14 and 16 W m–2 respectively, both far higher than the absolute interannual variability in the longwave components which is 3 and 1Wm– 2 for the incoming and outgoing components, respectively. This means that variations in ablation from year to year at 1020 ma.s.l. are most likely driven primarily by variations in the shortwave balance (see below).
Average seasonal cycle (1997–2002), based on monthly means, of temperature and wind speed at site 6.
The mean seasonal cycle of the radiative components is shown in Figure 5. This figure shows a large net radiation during the summer months, and a radiative deficit of about 40 W m–2 in winter. The albedo pattern is somewhat asymmetric over the summer. In early summer the winter snowpack has to be melted, leading to intermediate albedo values of 0.7. Bare ice is exposed in July and August, leading to albedo values of 0.55. The first snow arrives in late August, melt ceases and the albedo increases rapidly to values of >0.8.
Average seasonal cycle of the radiation balance (1997– 2002), based on monthly means, of incoming shortwave radiation, reflected shortwave radiation, albedo, incoming longwave radiation and outgoing longwave radiation at site 6.
3.2. Sonic height ranger measurements
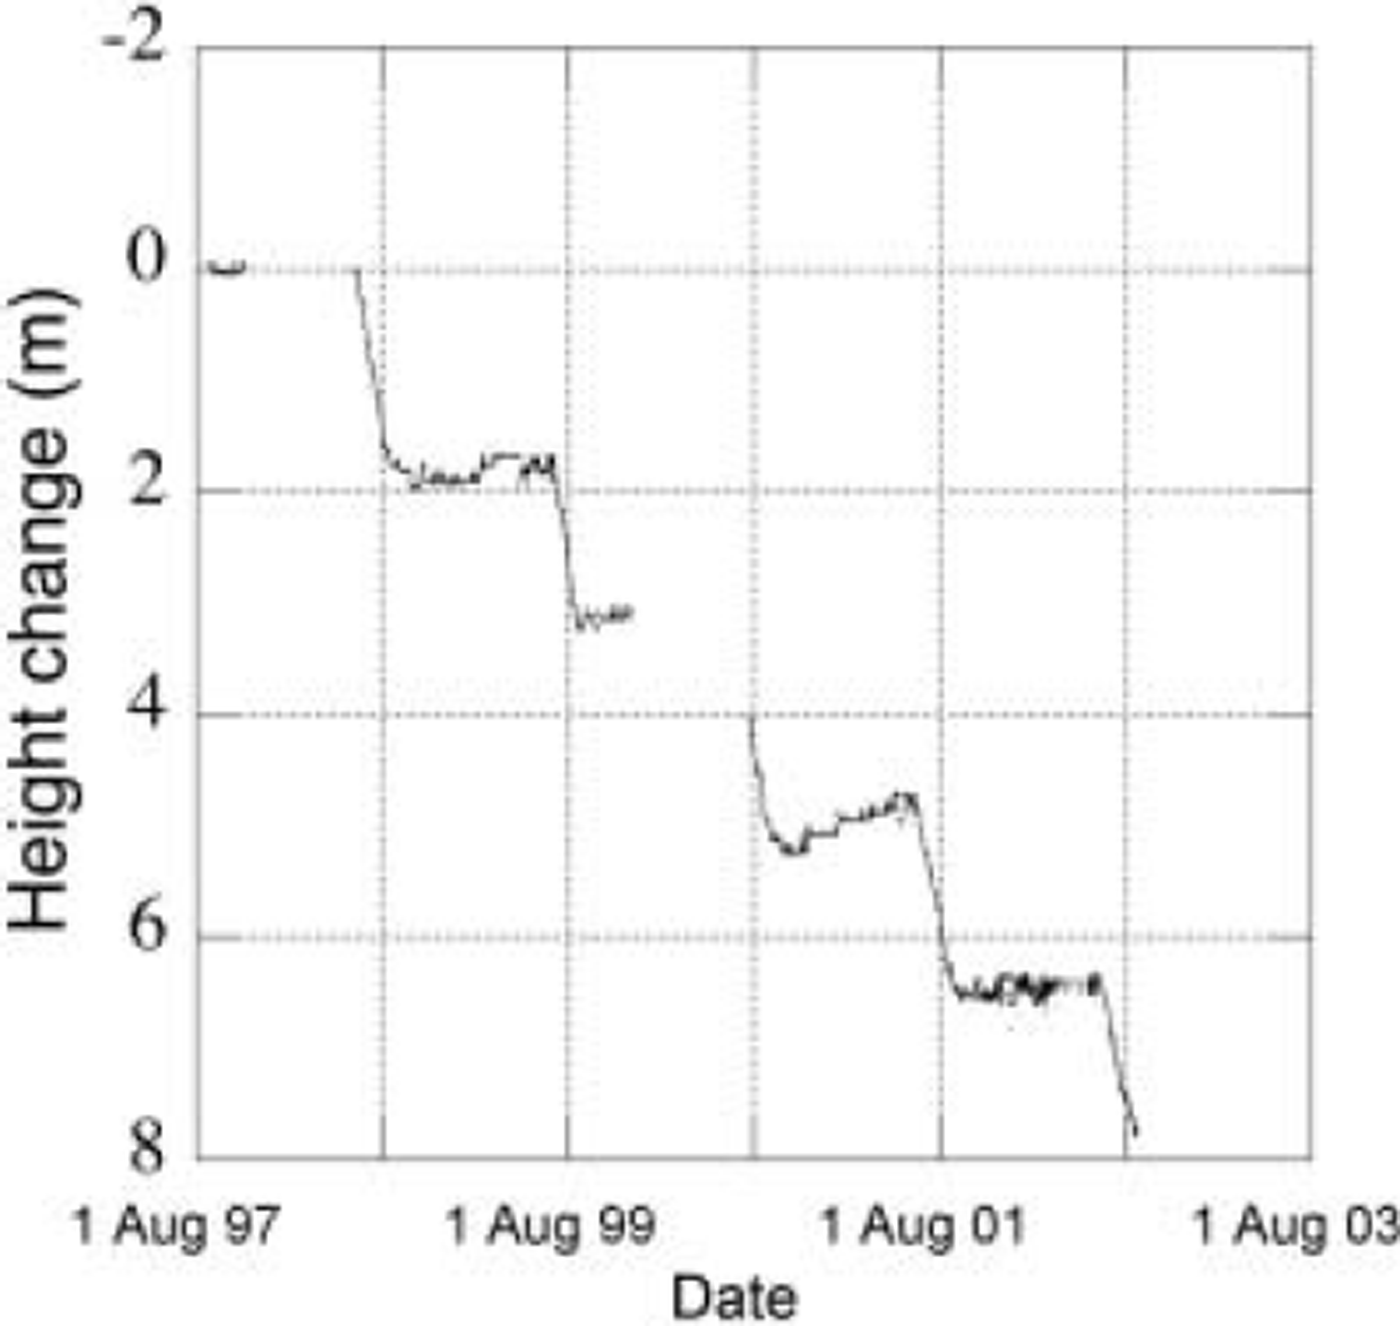
In order to study the ablation process in more detail, we also measured the change of surface height using a sonic ranging device mounted on a tripod. The tripod was drilled into solid ice on a stiff construction to prevent leaning. This implies that we can safely assume that the tripod itself is not sinking relative to the surface, and data need no corrections for leaning. Results of sonic height ranger measurements are presented in Figure 6. Unfortunately there was some data loss over two winter periods because the sensors were too close to the surface. As a result, we do not have a good record of winter accumulation. The three remaining years show winter accumulation, which varies from 20 to 55 cm snow. Note that we have no density data to convert the wintertime data to mass. For the summer period we can use a density of 900 kg m–3, as there is ice exposed at the surface. From the sonic height ranger data it can be concluded that the ablation season starts around 1 July in 1999 and around 10 June in 2001 and 2002. For the two other years no data are available.
Cumulative change of elevation as measured with the sonic height ranger at site 6 over 5 years, with 1 August 1997 chosen as reference level. Data gaps are estimated based on stake readings.
4. Energy Balance and Melt
We can calculate the ablation from the weather station data. However, a full energy-balance calculation over the entire period is not feasible due to the limitations of the dataset. As mentioned, sonic height ranger data are not available for two winter seasons and no density measurements are available. For this reason, we selected the period 22 July– 20 August of each year to calculate the ablation. This is the longest summer period with continuous meteorological and sonic height data over all 5 years. Over this period when ice is exposed and temperatures are near zero, the energy balance reduces to a summation of net radiation and sensible and latent heat.
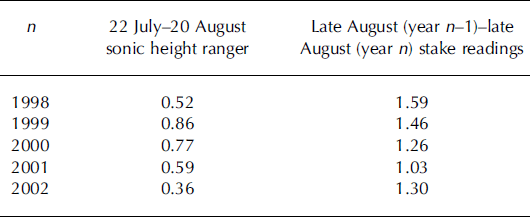
Table 5 lists the ablation over this summer period by individual year according to the sonic height ranger data. It should be noted that as we visit the sites only once a year, these data are not confirmed independently by stake observations. From Table 5 it can be concluded that the melt varies substantially (0.36-0.86 m w.e.) from year to year during this period. This is mainly due to a shift in the timing of the melt to earlier or later parts of the summer. Variations in the surface mass balance as observed by the stake readings over these 4years are clearly smaller, as can be observed in Tables 1 and 5, and indicate that the shift in the timing is indeed responsible for the strong variations over the period 22 July–20 August.
The ablation over a summer month as observed with the sonic height ranger, and the ablation derived from stake readings over a full mass-balance year. Data are converted to mw.e. by assuming a density of 900 kgm–3 for ice
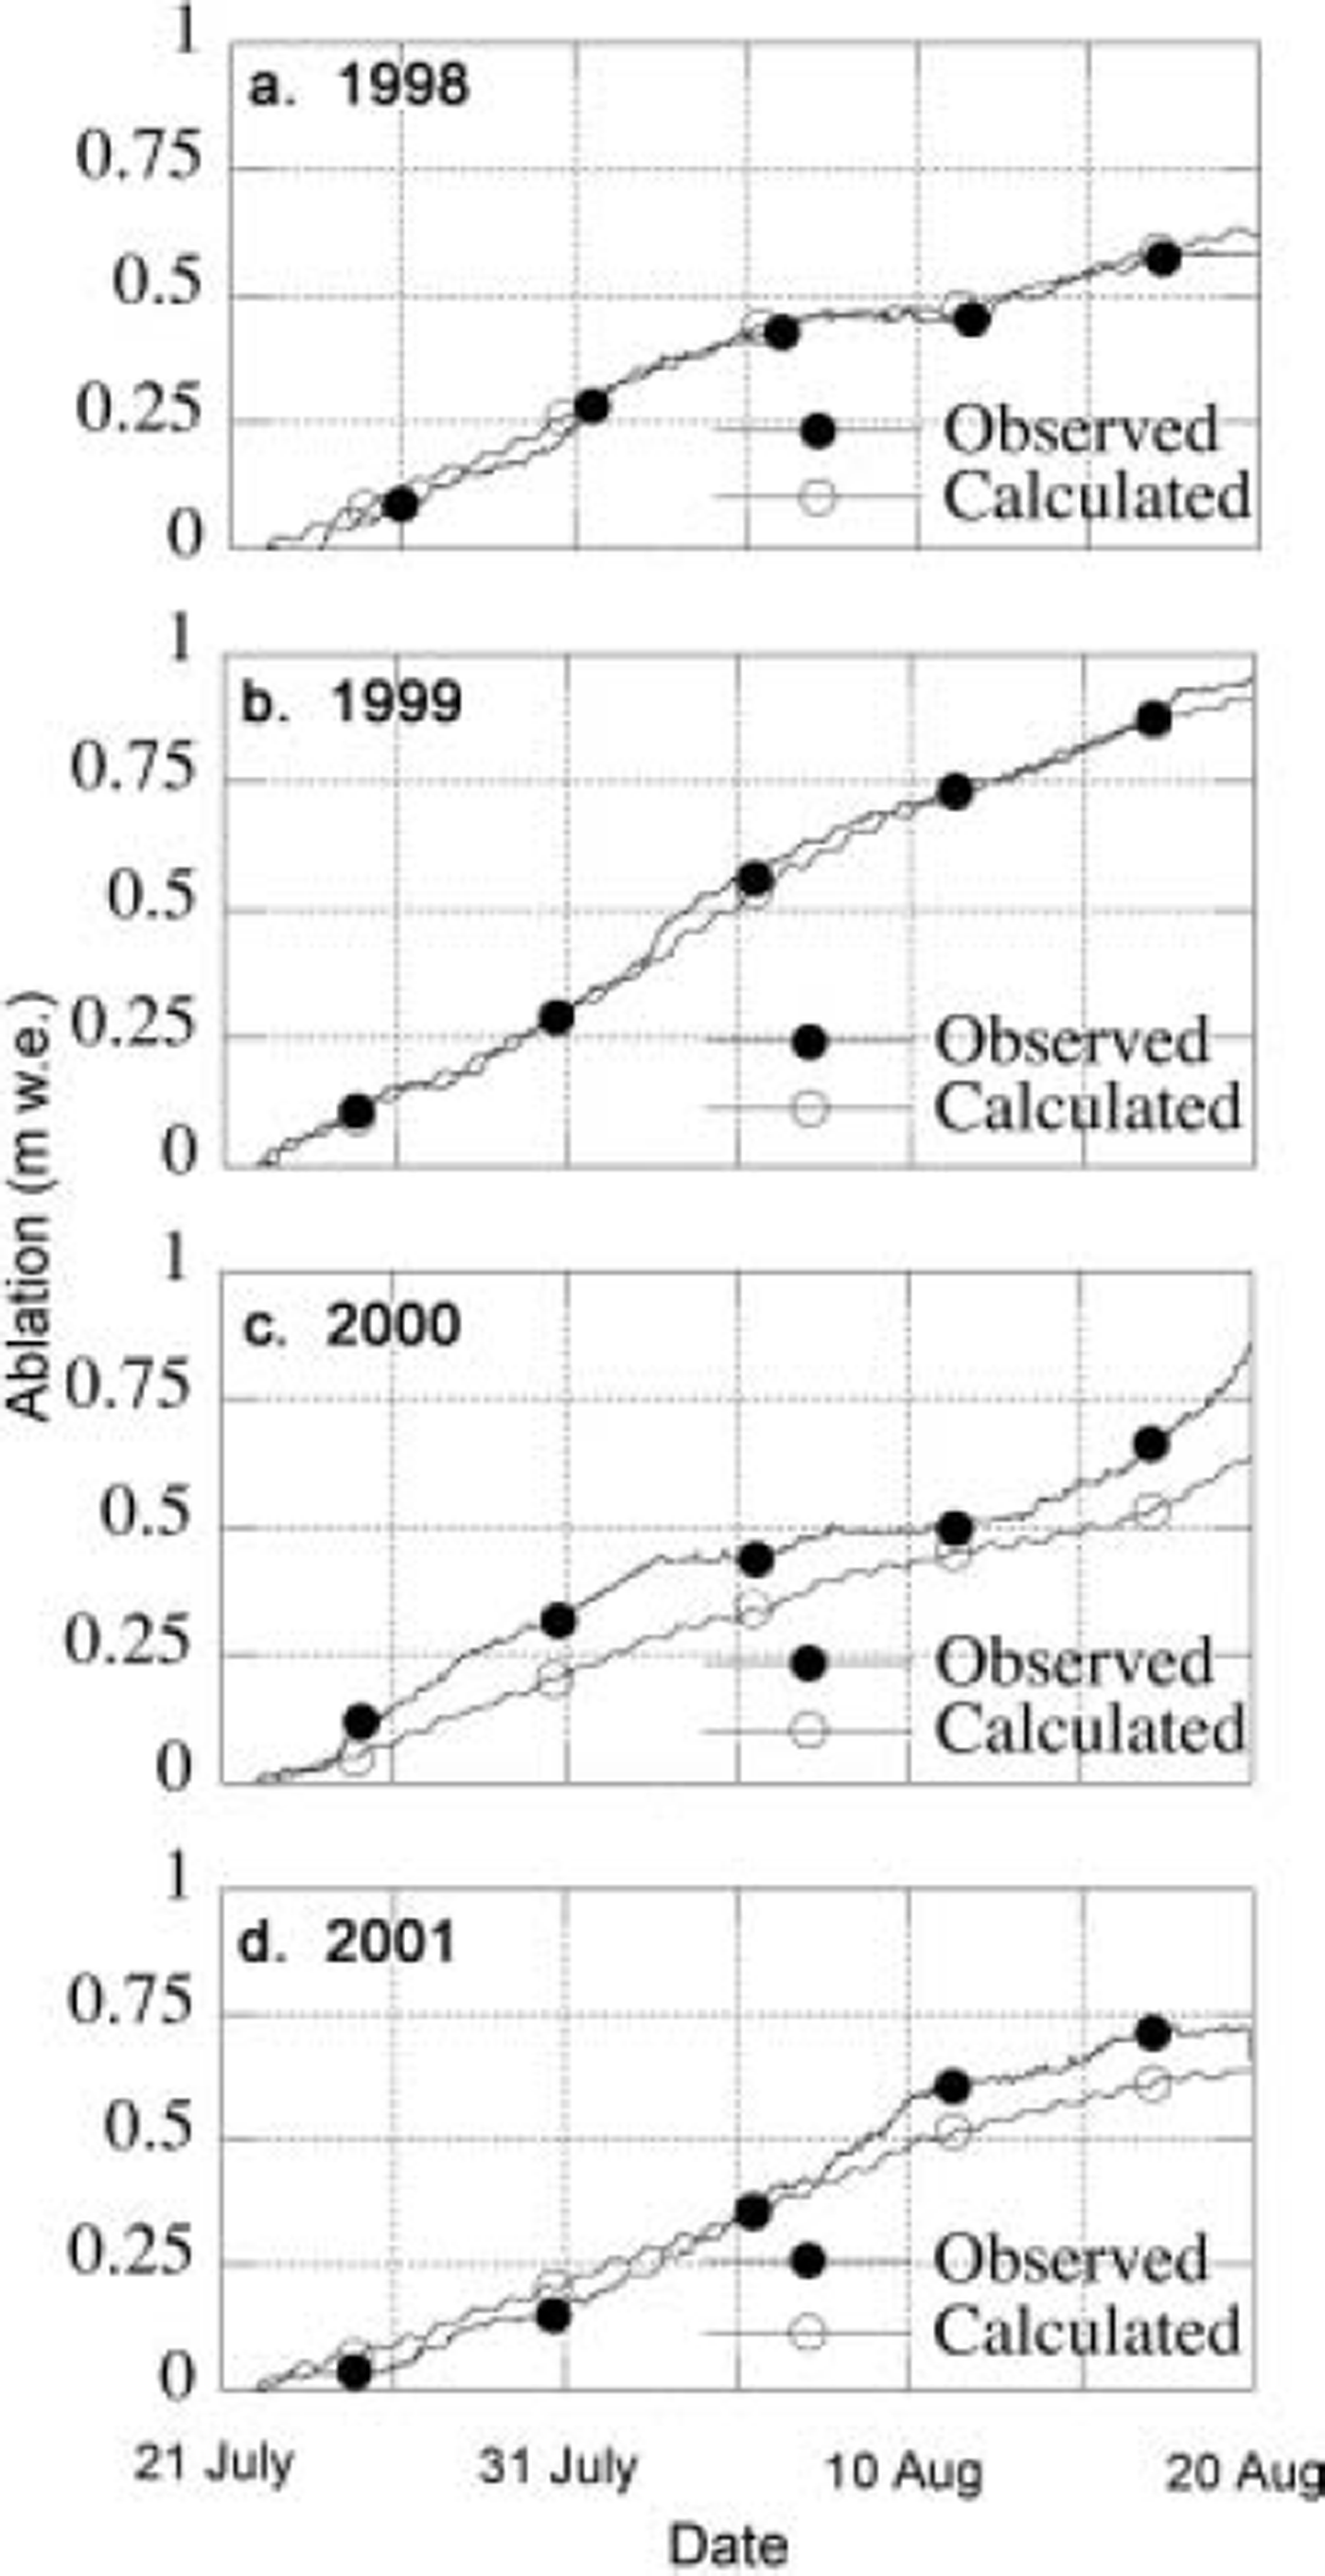
Net radiation is measured, but the turbulent flux has to be calculated. From the radiation measurements it can easily be calculated that on average 84% of the energy needed to explain the observed melt originates from net radiation. For this reason, we used the simplest approach to calculate the turbulent flux. A second justification for the simple approach is the fact that our data are too limited to allow for changing surface roughness conditions and stability corrections. No humidity measurements are available for the first 4years, so we have to assume a constant relative humidity. This implies that the sum of latent- and sensible-heat flux is approximated by a linear function of the temperature difference between surface and measurement height. Therefore, we simply assumed the turbulent flux to be proportional to the product of the temperature and wind speed. By doing so we can minimize the difference between observed and modelled ablation over the 5 years. Results of the best fit are shown in Figure 7 for the individual years. The mean difference between the model and observations integrated over a month is 9 cm w.e., or 13%. Somewhat poorer results are obtained if the variability of the wind speed is neglected and hence only temperature variations are taken into account. The mean difference is then 11 cm w.e., or 15%. Figure 7 shows excellent agreement for the summers of 1997 and 1998, but for parts of the two other summers differences are substantial.
Modelled and observed ablation over the period 22 July– 2 August during 4 years of observations: (a) 1998; (b) 1999; (c) 2000; and (d) 2001.
5. Discussion and Conclusions
We presented a 13 year dataset of surface mass-balance measurements from a transect in West Greenland. Key results are the average annual surface mass-balance gradient of 3.7 × 10⁻³ mm–1, and a mean ELA of 1534 m. There is no trend over the period of observations, but a weak 4 year periodicity is observed.
AWS data from a site in the ablation zone show that interannual variability in the energy balance is caused mainly by fluctuations in shortwave radiation. The nearly constant temperatures close to the melting point in summer limit the outgoing longwave radiation and to some extent the net longwave radiation, though variations due to differences in cloudiness are to be expected. By far the largest term in the energy balance is the net radiation component (61 W m–2), which accounts for 84% of the total energy for melting, leading to ablation rates of typically 2 cm w.e. d–1 in summer at this location.
Ideally one would like to do a full energy-balance calculation over the entire year, which considers a more detailed treatment of the turbulent flux and subsurface processes. For this reason, we installed equipment for year-round turbulence measurements in 2003. These measurements, which are not yet available, will allow us to study in more detail the turbulent fluxes and might help to interpret the differences in Figure 7c and d. At present, we cannot exclude that they are partly explained by errors in the estimated turbulent flux. Another possibility for the observed differences in Figure 7c and d might be local ablation variations as suggested by Reference Braithwaite, Konzelmann, Marty and OlesenBraithwaite and others (1998). However, this does not exclude the use of the meteorological data of the AWS and the mass-balance observations for validation of atmospheric models aiming to simulate the meteorology and ablation of the marginal zone of the ice sheet in West Greenland (e.g. Reference Box, Bromwich and BaiBox and others, 2004).
Acknowledgements
We thank W. Boot, H. Snellen and all the people involved in the data collection. Useful reviews by R. Braithwaite and G. Hamilton helped to improve the clarity of the paper. Additional thanks to the scientific editor T. Murray for her efforts. This project was financed most recently by the Spinoza Program of the Dutch National Research Programme, and a Netherlands Antarctic Program (NAAP) proposal from the Dutch Science Foundation.



