1. INTRODUCTION
Electronic Navigational Chart (ENC) technology has been able to integrate information with Automatic Radar Plotting Aid (ARPA), Global Positioning System (GPS), and Automatic Identification System (AIS) for application to navigation (Pillich et al., Reference Pillich, Pearlman, Chase and GmbH2003; Dawson, Reference Dawson1997; Norris, Reference Norris1998). Nowadays, all the information for the target ships can be displayed on the navigational chart. Thus, the motion of multiple moving-targets is known by an observer. How to assign multiple interceptors or chasers to capture multiple moving-targets on the raster chart (also called the raster plane) or digital map is an intractable and practical problem. In the previous article (Chang et al., Reference Chang, Jan and Parberry2004), it was shown that the shortest, or optimal, routing path from source to destination on the raster chart could be obtained by a higher geometry maze router with linear time complexity. In this article, the destinations of moving-targets are considered to be movable during the path planning. Once multiple interceptors and moving-targets are displayed on the raster, the purpose of the study is to assign multiple sets of specific interceptors to intercept each moving-target, also called multiple one-to-one interceptions, to achieve the minimum required time for all moving-targets to be intercepted. It should be noted that the number of interceptors must be larger than the number of moving-targets.
A great deal of research has been proposed in the area of developing a search theory for situations where the moving-target path is unknown to the searcher (Benkoski et al., Reference Benkoski, Monticino and Weisinger1991; Eagle, Reference Eagle1984; Thomas and Eagle, Reference Thomas and Eagle1995; Eagle and Yee, Reference Eagle and Yee1990). If the moving-targets can be observed by the interceptors, the problem can be simplified to develop interception routing combination between the interceptors and the moving-targets. In the past, the trailblazer search method (Chimura and Tokoro, Reference Chimura and Tokoro1994) used a map to store the path information of the region and reduce the number of search steps in the moving-target search. Later, Ishida and Korf (Reference Ishida and Korf1995) presented an A* search algorithm for a moving-target that is known or periodically known by the searcher. In the proposed work, the paths of the moving-targets are given to the interceptors. The objective is to develop the optimal interception methods for the multiple moving-targets on the raster charts.
For the optimal multiple moving-target interception problem, it becomes complicated if the numbers of interceptors and moving-targets are large. For example, 12 interceptors are assigned to capture 6 moving-targets with a given stochastic process. The mapping between 12 interceptors and 6 moving-targets has 924 different combinations which are too many to optimize the solution for simple one-to-one interception systems (Chimura and Tokoro, Reference Chimura and Tokoro1994; Ishida and Korf, Reference Ishida and Korf1995). In this paper, two optimal path planning methods will be applied to intercept all moving-targets for each interceptor's operation. The minimum-average (MIN-AVG) method is used to intercept all moving-targets in the least amount of time and the minimum-maximum (MIN-MAX) method tries to find the minimum required time for interceptors to reach all moving-targets. Thus, the proposed algorithms are frontier works compared with other interception methods for the multiple one-to-one interceptions, where each moving-target is assigned to exact an interceptor. The concepts of the algorithms can be employed in intercepting multiple moving-targets, police patrol assignments and multi-target chasing schemes on digital maps or computer games.
This article is organized as follows: Section 2 briefly introduces the pre-processing and the novel higher geometry maze router used in this article. Section 3 introduces the basic method of interception for a single moving-target. Section 4 describes the optimal methods for intercepting the known multiple moving-targets and demonstrates examples of the proposed methods. Conclusions are presented in Section 5.
2. THE PRE-PROCESSING AND HIGHER GEOMETRY MAZE ROUTER
An electronic chart can be naturally presented in a pixel-based plane. Therefore, it is better to solve the problem in a grid plane. Otherwise extensive pre-processing is required to convert the chart to adjacency matrices in order to apply the graph-based algorithm. The pre-processing of a raster chart is required to convert the current electronic chart into a cell map that is a matrix-based data structure. The algorithm first reads a raster chart based on pixels. The colours of the raster chart distinguish the navigable areas (also called free space) or landmass (also called obstacle or barrier), including shoals. To confirm the correctness of the pre-processing, free spaces, weighted regions or obstacles are displayed on the cell map and compared with the raster chart. Once the pre-processing is completed, a higher geometry maze router (an 8-geometry maze router is suggested in this article) uses suitable data structures to perform uniform wave propagation (Jan et al., Reference Jan, Chang, Gao and Parberry2005). A detailed description of the required data structures and the 8-geometry maze router are shown in Appendix A. The algorithm is capable of handling the various speeds of multiple ships and finding optimal routes for varied terrain in the raster chart. For the multiple moving-target interception process, the destinations of the moving-targets are considered to be movable for multiple interceptors during the path planning.
3. BASIC METHOD OF INTERCEPTION FOR A SINGLE MOVING-TARGET
In the navigational raster charts, a path routing procedure for dealing with the search and rescue (SAR) of a victim ship or the interception (or encounter) of a moving-target ship is a similar problem. The main difference is that the victim ship usually tries to maintain the same position and wait for rescue during an SAR operation (Ross and Dawson, Reference Ross and Dawson1994), whereas the moving-target ship tries to avoid being detected or intercepted by changing direction and speed during the search and interception process. Thus, the rest of this article uses the terminology of a moving-target in the interception problem to represent a victim ship during a SAR operation or a moving-target ship in the interception process. For a moving-target, the direction and speed of the moving-target are assumed to be known in the interception process. If an interceptor is assigned to intercept one moving-target with a given path, then the interceptor is considered as a chaser to find the optimal path of capturing the moving-target.
Time-Matching Scheme
For a moving-target with a given trajectory, the interceptor starts from the source cell using a higher geometry wave propagation scheme to obtain the AT (Time of Arrival) values for all cells within the outer bounds of the moving-target. Then, the interception process is conducted for a sequence of cells on the moving-target path, which is given by a known stochastic process. The interception path planning is based on a time-matching scheme to obtain an optimal interception location. The concept of this scheme is introduced in theorem 1.
Theorem 1. (Time-Matching Scheme)
Assume  is one of cells' coordinates with index h in the given moving-target path.
 and
 represent the AT values from the source (initial) cell of the interceptor and the moving-target to the cell, , respectively. For each moving-target's cell, the cell, , is a feasible location for the interceptor to intercept the moving-target if
 . Then the cell, , with the minimum AT value is the optimal interception location.
Proof
Suppose and represent the times of arrival from the source cells of the interceptor and the moving-target to the cell, , respectively. It is obvious that the moving-target will be intercepted if the interceptor reaches this cell, , faster than the moving-target. Thus, is a necessary condition for intercepting the moving-target. From the above result, the cell, , with the minimum value of is the optimal interception location since the optimal path means the fastest path for the interceptor to intercept the moving-target.
The concept of the time-matching scheme can be described as follows: Any cell in the given (or predicted) moving-target path that conforms to theorem 1 is a feasible location for capturing the moving-target in the interception process. When the algorithm sequentially compares the AT value of each cell in the predicted moving-target path with the AT value from the source cell of the interceptor to this cell, the first cell conforms to theorem 1, which has the minimum AT value. This location is the optimal location for the interception process.
Algorithm for Optimal One-to-One Interception
The AT value is used as a criterion for the time-matching scheme. In the interception process, it is necessary to divide the distance by the speeds if the interceptor and moving-target have various speeds. To reduce the number of division operations, the AT value of the cell in the cell map maintains the propagation value (distance), which is not the actual time of arrival for each cell. The average speed of the moving-target must be slower than the average speed of the interceptor to guarantee that the interceptor will capture the moving-target. Each cell in the predicted moving-target path must multiply the speed ratio of the interceptor and moving-target to compensate for the difference between the relative AT value and the distance. Once the modification of the predicted moving-target path is completed, the time-matching scheme can be applied to obtain the optimal interception location for the interception process, and the optimal path can be obtained by backtracking from cell, , to the source cell of the interceptor.
The one-to-one interception algorithm based on the higher geometry maze router can be summarized as follows:
Algorithm 1. One-to-One Interception
Step 1: Input data.
Step 1.1: Input the source (initial) position of the interceptor and moving-target.
Step 1.2: Predict the moving path of moving-target by a stochastic process (Markov process).
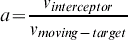
Step 1.3: If the speed of the moving-target,
 is not zero, then compute the speed ratio, a, between the speeds of the interceptor, , and the moving-target, where
Step 2: Compute the AT value of each cell from the source of the interceptor to the outer bound of the moving-target or for all the cells by using the higher geometry maze router.
Step 3: Obtain the optimal interception location for the interceptor.
Step 3.1: Sequentially select one of the cells of the predicted moving-target path from its source and multiply the speed ratio by the distance of the cell.
Step 3.2: Compare the AT value of the cell along the moving-target path with the AT value from the source cell of the interceptor to the current cell.
Step 3.3: If the first AT value of the cell conforms to theorem 1 (Time-Matching Scheme), then obtain the optimal interception location for the interceptor. Otherwise, there is no existing path before the moving-target reaches its given destination.
Step 4: Trace back. Backtrack from the interception cell to the source cell of the interceptor and then obtain the optimal intercepting path.
END {Algorithm for One-to-One Interception}
 is not zero, then compute the speed ratio, a, between the speeds of the interceptor,
 , and the moving-target, where
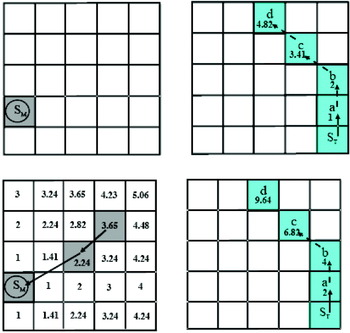
An example to illustrate the concept of the one-to-one interception is shown in Figure 1. In Figure 1(Top), the source cell of the interceptor, S M, and the distance of the predicted moving-target path from the source cell, S T, will be determined. Assume the speed ratio between the interceptor and the moving-target is 2. The relative AT value can then be obtained by using the distance of the predicted moving-target path multiplied by 2 to implement the time-matching scheme. After that, the algorithm sequentially compares the AT value of each cell (S T, a, b, c, and d) until the first cell that conforms to theorem 1. This is the obtained optimal interception cell. Finally, track the interception path from the optimal interception cell until the source cell of the interceptor is reached. Reverse this to obtain the optimal interception path as shown in Figure 1(Bottom). The algorithm is similar to the higher geometry maze router. Thus, the time complexity is obviously O(N), where N is the number of cells on the raster chart. The big O notation is useful for the analysis of algorithm complexity since it captures the asymptotic growth pattern of functions and ignores the constant item where O(N) means linear complexity.
The algorithm process for one-to-one interception on the grid plane. Top left – the source cell of the interceptor; Top right – the moving-target path and distances of each cell; Bottom left – Obtain the interception cell and backtrack to the source cell of the interceptor; Bottom right – AT values of the given moving-target path to obtain the optimal interception path.

4. METHODS OF MULTI-PAIR INTERCEPTIONS FOR MOVING-TARGETS
Given a scenario for the interception of moving-targets in a single mission it is possible to intercept one of moving-targets with the paths of the moving-targets given by stochastic functions. Multiple one-to-one interceptions are able to satisfy the minimum requirements of the MIN-AVG and MIN-MAX methods, to intercept all moving-targets. If the initial conditions of P interceptors and Q moving-targets are known, where P⩾Q, the number of combinations for multiple one-to-one interceptions (|S set|) is equal to  . This assumes that the various speeds of the moving-targets and interceptors are given. The methods for optimal multi-target path planning are based on the one-to-one interception algorithm. Two different optimal path planning methods, MIN-AVG and MIN-MAX (Schuster et al., Reference Schuster, Melnikov and Katsaggelos1999), are developed to emulate the routing. Thus, the algorithms are capable of performing in complicated marine traffic and military defence scenarios.
4.1. MIN-AVG Method
A basic optimal solution for multiple moving-targets with one-to-one interception is to capture all moving-targets within the least amount of time, which also means finding optimal paths for multi-pair interceptors to capture their corresponding moving-targets. The mathematical definitions of moving-targets and interceptors are shown as follows:
Moving-targets (T q): T 1, T 2, …, T Q, where 1⩽q⩽Q and q is the index of moving-targets; Interceptors (V p): V 1, V 2, …, V P, where 1⩽p⩽P and p is the index of interceptors; S set={f: {1, 2, …, Q}→{1, 2, …, P}, one-to-one}, where P⩾Q and 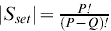
Thus, the function to minimize the total cost (AT value) or the average cost for Q interception pairs of moving-targets can be described as: 
Find optimal paths from interceptors to moving-targets for multi-pair interceptions that require the computation of all the combinations of interceptors and moving-targets. If the number of interception pairs, , is computed sequentially, the time complexity is enormous if the number of interceptors is greater than a certain value. To reduce the computational effort, each interceptor intercepts all moving-targets in a process of wave propagation with linear time complexity. Thus, P interceptors require only P processes and Q times in a time-matching scheme to complete Q number of intercepting missions, which requires much less effort than other algorithms, such as the A* search algorithm (Hart et al., Reference Hart, Nilsson and Raphael1968). The interceptor will keep track of the target by observing the target positions and searching for the leading target. If the average speed of the target is slower than that of the interceptor, then the interceptor is guaranteed eventually to reach the target.
4.2. MIN-MAX Method
In the interception of multiple moving-targets, the minimum required time for interceptors to reach all the moving-targets that satisfy the maximum acceptable AT value is an important issue for some interception problems, such as search and rescue. Delays have hindered rescue efforts in the golden time available for saving survivors. Therefore, just finding all moving-targets in the least amount of time does not always meet the needs of a practical interception problem. The minimum required time for the last moving-target to be captured is another optimization problem. The maximum AT value, D ATmax, for the last moving-target to be captured is the criteria of the MIN-MAX method. The mathematical representation can be confined to a function as:  subject to
 for all l.
The minimum required time for the last moving-target to be captured is selected from |S set|, the number of interception pairs if the AT values of all the selected paths are less than D ATmax. This method is similar to the MIN-AVG method, but the MIN-MAX method includes an extra constraint for the interception problem.
4.3. Optimal Interception Algorithms for Multiple Moving-targets
The fundamental concept for multiple moving-targets interception is based on a one-to-one interception algorithm. First, the AT values for the cells between the source cell of the interceptor and the outer bounds of the moving-target are obtained by a higher geometry maze router. All of the cells in each moving-target path are sequentially stored in a linked list. For each cell in the linked list, we sequentially compare its AT value with that of the interceptor. The optimal intercepting cell for an interceptor is obtained when the first AT value reaches the condition of theorem 1. Thus, all the interception combinations of interceptors and moving-targets are easily obtained. After comparing the AT values of all the combinations, the multiple pairs of interceptors and their corresponding moving-targets are found according to the optimal principle. The optimal paths for multi-pairs are obtained by backtracking individually from the interception cells to the source cells of the interceptors using the higher geometry maze router. Descriptions of the optimization algorithms, the MIN-AVG and MIN-MAX methods, are summarized as follows:
Algorithm 2: Multi-Pair Interceptions based on MIN-AVG Method
Initialization:
1. Input the source cells of P interceptors, where P is the number of interceptors and p is the index of interceptors, where 1⩽p⩽P.
2. Assume the moving path of moving-target q which is constituted by a series of intermediate cells,
, , , …, , …, where 1⩽q⩽Q; Q is the number of moving-targets, q is the index of moving-targets, the h th cell of the predicted path of moving-target q and is the destination cell of the moving-target q.3. Compute the distance (also called the AT value if the speed is one) from the source cell of each moving-target along its moving path by wave propagation. For each moving-target, store the
value and the coordinates of each cell in a linked list.4. Determine the speed ratio, a, for each pair of interceptor and moving-target. The distance of the predicted path for moving-target q should be multiplied by its corresponding speed ratio, a, to obtain the relative AT value,
, by the time-matching scheme.
Step 1: Compute the optimal intercepting cell of each interceptor to all moving-targets.
Step 1.1: Input the source cell,
, of each interceptor, obtain the value of the cell, , from each interceptor to the outer bound of the moving-targets or the entire cell map based on the one-to-one interception algorithm, where is the h th cell of the path for p interceptor and is the AT value of .Step 1.2:For p=1 to P
For h=0 to E T, where E T is the destination of the moving-target.
If
, then break.Else return “unable to intercept the moving-target.”
Next
Next
Step 2: Obtain the combination for the MIN-AVG method.
For Q moving-targets and P interceptions, the number of combination is
. From all of the combinations, find the minimum sum of the AT values.Step 3: For each pair, backtrack from the interception cell to the source cell of the interceptor and reverse the path to obtain the average shortest time for all interceptors.
End {Algorithm for Multi-Pair Interceptions based on MIN-AVG method}
 ,
 ,
 , …,
 , …
 , where 1⩽q⩽Q; Q is the number of moving-targets, q is the index of moving-targets,
 value and the coordinates of each cell
 , of each interceptor, obtain the
 value of the cell,
 , from each interceptor to the outer bound of the moving-targets or the entire cell map based on the one-to-one interception algorithm, where
 , then break.
Algorithm 3: Multi-Pair Interceptions based on MIN-MAX Method.
All steps of the MIN-MAX method are the same as the algorithm for multi-pair interceptions based on the MIN-AVG method except for step 2. Thus, just the substeps of step 2 of this method are introduced here.
Step 2: Obtain the combination for the MIN-MAX method.
Step 2.1: Compute all combinations of P interceptors to Q moving-targets and obtain their corresponding sums for AT values.
Step 2.2: Find the minimum
of the last moving-target to be intercepted by interceptors from the combinations, where 1⩽p⩽P and H is the interception cell for the moving-target.Step 2.3: If the last moving-target to be intercepted with the minimum
has more than one set of combinations, then select the minimum sum of the AT values from the combinations, which is called the optimal MIN-MAX combination.
 of the last moving-target to be intercepted by interceptors from the combinations, where 1⩽p⩽P and H is the interception cell for the moving-target.
To compute the total combination of , two methods, recursive or sorting, can be applied. The recursive method has a larger time complexity, whereas the sorting method has a larger space complexity. However, the results have little difference since the size of N is much larger than P and Q. The two optimal methods may have the same result depending upon the geographical map, speeds, and locations of the moving-targets and interceptors.
4.4 Time Complexities for Optimal Multiple Moving-targets Interceptions
Regarding the performance of the MIN-AVG and MIN-MAX methods, the time complexity can be divided into several parts. The time complexity for initializing the interceptors, moving-targets and the predicted paths of moving-targets is T Set_up. The initialization of all cells requires a time complexity of O(N). For each interceptor, the required time to compute optimal paths to all moving-targets is T Shortest, the total time complexity is O(PN) for P interceptors. For all interceptors to moving-targets, the recursive method is implemented to obtain all combinations with the time complexity of T Recursive. The minimum time to intercept the moving-targets and backtrack from the interception cells to the interceptors is T MIN-AVG and T Path, respectively. Thus, the total time complexity to obtain the combinations of the MIN-AVG method can be summarized as:
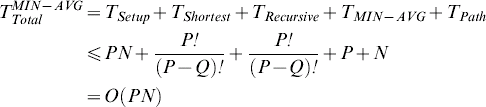
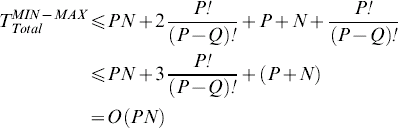
The time complexity of the MIN-MAX method is the same as the above MIN-AVG method except for one condition, the maximum time for the last moving-target to be intercepted, which requires the times. Thus, the total time complexity to obtain the combinations of the MIN-MAX method is described as:
Examples of the Proposed Methods
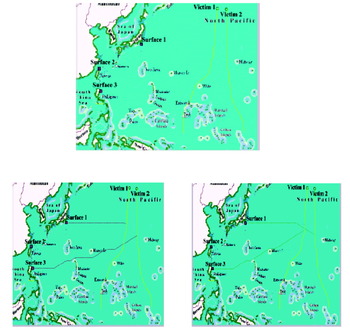
Two optimal path-planning methods are used to verify the performance and correctness. Figure 2 is an example for the multi-pair interceptions of moving-targets. There are two moving-targets, victim 1 and victim 2, and their moving paths are predictable as shown in Figure 2(Top). Three interceptors located in different positions with various speeds are assigned for the interceptions. Assume the initial speed of the interceptor is about twice that of the moving-targets, where the squares and circles are the source positions of the interceptors and moving-targets, respectively. The wind and current speeds can be considered as various terrain problems in the cell map. In order to intercept those moving-targets, two different optimization methods, MIN-AVG and MIN-MAX, are implemented according to their requirements. The optimal result of the MIN-AVG method is shown in Figure 2(Left), where victim 1 is assigned to surface 1 and victim 2 is assigned to surface 3 and the total time to reach the moving-targets is minimal. For the optimal result of the MIN-MAX method in Figure 2(Right), victim 2 is first intercepted by surface 1 and victim 2 is intercepted by surface 3, which satisfies the least time for the last moving-target to be intercepted. For both optimal methods, the interceptor, surface 2, is not chosen since it needs a longer time to reach all the moving-targets. The interception time of this example is only a fraction of one second on a 400×300 raster electronic chart for a modest PC.
Illustration for optimal multi-pair interceptions of moving targets. Top – Source cells of three interceptors and two moving targets. Left – Implementation of MIN-AVG. Right – Implementation of MIN-MAX method.

5. CONCLUSIONS
This article presents optimal methods for a multiple one-to-one interception system based on a higher geometry maze router. In the one-to-one interception algorithm, the time-matching scheme is introduced to obtain an optimal path between the interceptor and the moving-target in any waterway. For the multiple moving-targets interception and path planning problems, the MIN-MAX and MIN-AVG methods are addressed to assign the mission. This multiple one-to-one interception and path planning on raster charts or non-distorted digital maps is very efficient compared with other methods. The concept of the algorithm is simple and easy to combine with geographical information systems. However, the multiple one-to-one interceptions are the minimum requirement for the interception problem to capture all moving-targets without redundancy. In reality, all the paths of moving-targets are dynamic and hard to predict. Therefore, it is required to assign multiple interceptors to capture every single moving-target to increase the interception probability. In future research, these methods will be extended from the two-dimensional raster plane to the three-dimensional volume and all the given paths of moving-targets could be dynamic as well.
ACKNOWLEDGEMENTS
The financial support of this research by the Engineering Division of National Science Council, Taiwan through contract NSC 89-2211-E-019-025 is greatly appreciated.
6. APPENDIX A
A1. THE 8-GEOMETRY MAZE ROUTER
The required data structures for the 8-geometry maze router are mainly a cell data structure, buckets, and linked lists.
A1.1. Cell Map
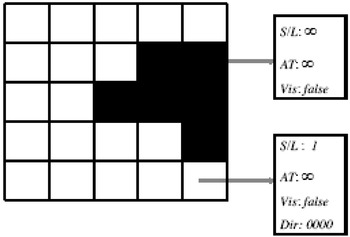
In the formatting of the cell structure of a raster plane, the number of data fields is flexible to meet the requirements of the problem. There are four parameters for cell storage; these are S/L, AT, Vis and Dir. The S/L (Free Workspace or Obstacle) parameter distinguishes whether a cell is an obstacle, the value is infinity, or in the free workspace the value is 1 for smooth terrain. If the S/L parameter of any area has a finite value between 1 and infinity, we are working on the optimal path among weighted regions. The AT (Time of Arrival) parameter stores the time needed to travel from the source cell to the current cell and its initial value is infinity. The third parameter Vis (Visited) distinguishes whether the cell has been visited or not and its initial Boolean value is false. The fourth parameter Dir keeps track of which direction to move to from the previous cell and causes the minimum AT value. There are a total 16 different directions for each single move and its initial value is 0000. The cells' initial values are illustrated in Figure 3, where the black cells represent obstacles and the white cells represent free workspace areas. In an m×n grid plane, any cell C i,j has four parameters S/L i,j, AT i,j, Vis i,j and Dir i,j where 0⩽i⩽m−1, 0⩽j⩽n−1.
Cell map.

Buckets and Linked Lists
For an m×n grid of cells, the first step in the algorithm is to input a source cell and a destination cell. According to the algorithm, the AT value of the source cell is 0 and the indices of the source cell S will be inserted into the first bucket, LL 0. The remaining cells that spread from S will be inserted into their corresponding buckets according to their AT values. For a single terrain problem, the AT value of any cell would be increased at most by  from its neighbouring cell. The number of decimal digits in the irrational numbers,
 and , is determined by the total number of cells on the grid plane.
Therefore, the number of buckets can be reduced to four (LL 0, LL 1, LL 2 and LL 3) for the purpose of recycling since the updated cells would be inserted into one of the next three buckets. In addition, a temporary list TL is applied to the algorithm to store the indices (i, j) of visited cells until all of the cells in the current bucket have updated their neighbouring cells. This data structure enables us to perform uniform propagation for arbitrary cost functions. As a whole, there are mainly three different aspects between our higher geometry algorithm and the other 2-geometry algorithms.
• Buckets are introduced to control the propagation of several non-equal (single-step) cost functions to a uniform propagation without a series of sorting process.
• The Vis parameter is introduced to make sure that each cell is inserted into the TL exactly once. Due to these two aspects, the algorithm keeps a linear time complexity.
• The S/L parameter is introduced for weighted regions problems. For the convenience of understanding the concept of our algorithm, the 8-geometry maze routing algorithm is described as a function with one terrain. This is also for the simplicity of our presentation.
A1.3. The 8-geometry maze routing algorithm
Initialization:
For each cell C i,j (S/L i,j, AT i,j, Vis i,j and Dir i,j) in an m×n grid plane, the initial S/L i,j value is 1 if cell C i,j is in the smooth free space or ∞ if it is in the obstacle. AT i,j=∞ and Vis i,j=false for all cells, where 0 ⩽i ⩽m-1, 0 ⩽j ⩽n-1. The initial value of index is 0.
Input the coordinates of the source cell S and the destination cell D. If the source cell S/L i,j=1, then update AT i,j=0.
Step 1:
Step 1.1: Insert the source cell S into the TL and update the source cell's Vis i,j to true.
Step 1.2: Insert the indices of the source cell into the LL 0.
Step 2: For each cell in the LL index, update the AT i,j values of its neighbouring cells.
Step 2.1: If the destination cell D is removed from the LL index, then break the function.
Step 2.2: Remove the indices of the first cell C i,j from the front end of the LL index.
Step 2.3: Update the time of arrival, AT i,j, of the 8 geometry neighbours of cell C i,j. For each of C i,j's neighbour C i,j, if the cell's S S/L i,j=1 then
Step 2.4: Iterations. If LL index is not empty, then repeat steps 2.
Step 3: Insert the cells’ indices of the TL into their corresponding buckets.
Step 3.1: For all the indices in the TL, remove indices (i, j) from TL into
Step 3.2: If the TL is empty, then update the index value by index=(index+1) mod 4.
Step 4: Iterations. If two consecutive buckets are not empty, then repeat steps 2.
Step 5: Backtrack from the destination cell to the source cell according to the parameter Dir to know which predecessor causes the minimum AT value.
END {Algorithm of the 8-geometry maze routing}.
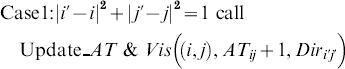


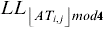
The function Update_AT&Vis((i, j), new_AT i,j, Dir i,j) updates the value of AT i,j and Dir i,j if new_AT i,j is smaller and also inserts the indices of C i,j into the bucket TL if Vis i,j is false also update Vis i,j to true. After executing the 8-geometry maze routing algorithm, the AT i,j values of all the cells between the source cell and the destination cell are uniformly propagated and updated to their minimum values. The time complexity of the algorithm can be easily analyzed to O(N).