Introduction
Depression is one of the most common mental disorders in old age. Moreover, disability that is frequent in old age refer to limitations in basic activities of daily living, such as using the toilet, dressing, or even more complex activities, such as taking medication, handling finances, or shopping. In accordance with Verbrugge and Jette (Reference Verbrugge and Jette1994), limitations in household management behaviors (Instrumental Activities of Daily Living scale (IADL)) are considered as aspects of disability. The use of the different terms is also discussed in Bruce (Reference Bruce2001).
Due to demographic aging, the number of individuals in old age with depressive symptoms and functional impairment is expected to increase considerably in the next decades, highlighting the need for support. Furthermore, both are associated with numerous negative consequences, including admission to nursing home (Hajek et al., Reference Hajek2015).
According to the Disablement Process model that was proposed by Verbrugge and Jette (Reference Verbrugge and Jette1994), acute as well as chronic diseases might ultimately lead to impairment in the body (World Health Organization, 2001). When these impairments increase, functional abilities decrease markedly. According to this model, this disablement process is accompanied by changes in psychological factors, such as depressive symptoms. It is assumed that this relationship is complex and consequently might be bidirectional. Thus far, few recent longitudinal studies have been conducted showing that the relationship between depressive symptoms and disability is complex (Ormel et al., Reference Ormel, Rijsdijk, Sullivan, van Sonderen and Kempen2002; Yang and George, Reference Yang and George2005; Chen et al., Reference Chen, Mullan, Su, Griffiths, Kreis and Chiu2012; Bacon et al., Reference Bacon, Heeren, Keysor, Stuver, Cauley and Fredman2015).
Some studies have found that disability is a predictor of future depressive symptoms (Chang et al., Reference Chang2009; Chao, Reference Chao2014). For example, using a prospective cohort study of individuals aged 65 years and above (two waves) in the United States, Yang and George (Reference Yang and George2005) found that the onset of disability is significantly associated with increasing depressive symptoms. Furthermore, with community-dwelling older adults aged 65 years and older in Taiwan (n = 442, six waves), Chen et al. (Reference Chen, Mullan, Su, Griffiths, Kreis and Chiu2012) found that disability (activities of daily living (ADL), Katz, Reference Katz1963; IADL, Lawton and Brody, Reference Lawton and Brody1969) is a stronger predictor of depressive symptoms (Short Psychiatric Evaluation Schedule; Pfeiffer, Reference Pfeiffer1979) than vice versa. By using structural equation models, Bacon et al. (Reference Bacon, Heeren, Keysor, Stuver, Cauley and Fredman2015) found that greater disability (seven ADL and seven IADL tasks; Katz, Reference Katz1963) predicted increased subsequent depressive symptoms in older non-caregiver women and vice versa (M = 81.5 years).
These results may be explained by the loss of independence and decreased physical health (Brilman and Ormel, Reference Brilman and Ormel2001). It is argued that disability is a stressful experience for individuals, leading to depression (Gurland et al., Reference Gurland, Wilder and Berkman1988; Turner and Noh, Reference Turner and Noh1988). While it is suggested that the adaptation or disruption accompanied by a new disability might contribute to depression (Holmes and Rahe, Reference Holmes and Rahe1967), other authors argue that emotional reactions such as helplessness or worthlessness associated with disability result in depression (Bruce, Reference Bruce2001). Alternatively, it is argued that disability is the first detectable sign of a depression (Bruce, Reference Bruce2001). Disability might indicate an inherent problem, resulting in depression.
Bidirectional associations between physical performance (quantified by gait speed) and depressive symptoms were also found in a national sample of community-dwelling people aged 60 years and older (n = 4,581) in England by using the generalized estimating equation regression model (Demakakos et al., Reference Demakakos, Cooper, Hamer, Oliveira, Hardy and Breeze2013). Using random coefficient growth models, Taylor and Lynch (Reference Taylor and Lynch2004) found that trajectories of disability (ADL; Katz, Reference Katz1963 and IADL; Lawton and Brody, Reference Lawton and Brody1969) and trajectories of depressive symptoms are strongly related.
Ormel et al. (Reference Ormel, Rijsdijk, Sullivan, van Sonderen and Kempen2002) found a strong contemporaneous effect of change in disability (ADL/IADL, Groningen Activity Restriction Scale; Kempen et al., Reference Kempen, Steverink, Ormel and Deeg1996) on depressive symptoms (Hospital Anxiety and Depression Scale; Zigmond and Snaith, Reference Zigmond and Snaith1983) in a community-based cohort (n = 753) of older people by using structural equation models. Moreover, they found a lagged effect of change in depressive symptoms on disability (Katz, Reference Katz1963).
Based on a population-based study (individuals aged 65 years and above, n = 5,306; up to 9 yearly data; Chicago Health and Aging Project), Mendes de Leon and Rajan (Reference Mendes de Leon and Rajan2014) found that depressive symptoms were significantly associated with the onset of disability based on a two-part regression model. However, depressive symptoms were not significantly associated with the progression of disability (disability changes after onset) in ADL. Other studies (Barry et al., Reference Barry, Soulos, Murphy, Kasl and Gill2013) reported that depressive symptoms were significantly associated with subsequent impairments. This effect might be explained by decreased physical activity and social ties (Xue et al., Reference Xue, Fried, Glass, Laffan and Chaves2008). More specifically, it is argued that specific depressive symptoms including appetite disruption, sleep disturbance, or fatigue have direct effects on disability over time (Bruce, Reference Bruce2001). An alternative explanation might be that these effects operate indirectly through health-related behavior. Depressive symptoms such as anhedonia (inability to experience pleasure) might reduce motivation, which in turn might affect health-related behavior such as exercising, alcohol consumption, or use of health services, ultimately resulting in disability (Bruce, Reference Bruce2001).
Standard regression models cannot adequately deal with this aforementioned complex relationship or co-occurrence of disability and depressive symptoms since they focus only on one dependent variable. Complex regression techniques including panel instrumental variables estimations (Cameron and Trivedi, Reference Cameron and Trivedi2005) do not seem to be appropriate in most cases as exogenous instruments are difficult to identify, and endogenous instruments are commonly weak. Consequently, we used a reduced form vector autoregressive (VAR) approach in order to account for the complex relationship of disability and depressive symptoms. Recent studies have also addressed the issues of complex co-occurrence and mutual endogeneity using VAR approaches (Becchetti et al., Reference Becchetti, Pelloni and Rossetti2008; Binder and Coad, Reference Binder and Coad2010, Reference Binder and Coad2011; Bottan and Truglia, Reference Bottan and Truglia2011).
To our knowledge, most of the previous studies attempted to disentangle the relationship between disability and depressive symptoms were limited to observation periods of only few years. Moreover, evidence is missing regarding the complex co-occurrence of disability and depressive symptoms in old age in Germany. In order to close the research gap, using an alternative modeling approach, we aimed at disentangling the complex co-occurrence of disability and depressive symptoms in old age in Germany over a longer time frame. To this end, we used a VAR model with first differences (FD). Thus, first insights in the causal relationship between disability and depressive symptoms in old age can be derived. Based on previous research, we hypothesize that the relation between disability and depressive symptoms is bidirectional.
Methods
Sample
This study used data from the German Study on Ageing, Cognition and Dementia in Primary Care Patients (AgeCoDe), which is a population-based prospective cohort study. General practitioners’ (GP) offices recruited individuals at six study centers in Germany (Leipzig, Hamburg, Dusseldorf, Mannheim, Bonn, and Munich) in 2003/2004 (baseline). From baseline onward, trained staff interviewed participants every 18 months in the follow-up waves 1 to 5.
At baseline, participants were included if they met the following inclusion criteria (n = 3,217): aged 75 years and above, absence of dementia, and at least one contact with the GP during the last 12 months. Exclusion criteria were as follows: Consultations only by home visits, residence in a nursing home, insufficient German language skills, severe illness, deafness, blindness, and lack of ability to provide informed consent.
Lack of follow-up data (follow-up wave 1) was mainly caused by death (n = 137) and refused participation (n = 298), whereas other reasons played a minor role (n = 28). Between follow-up wave 1 and 2, 153 individuals died and 169 individuals refused participation (other reasons: n = 23). Moreover, 201 individuals died and 225 individuals refused participation (other reasons: n = 77) between follow-up wave 2 and 3. Between follow-up wave 3 and 4, 137 individuals died and 83 refused participation (other reasons: n = 65). By the time of wave 5, 135 individuals died and 53 refused participation (other reasons: n = 72).
Depressive symptoms
Depressive symptoms were quantified by using the Geriatric Depression Scale (GDS; Yesavage and Sheikh, Reference Yesavage and Sheikh1986), with values from 0 (no depression) to 15 (severe depression). The internal consistency of this scale was acceptable (Cronbach's α = 0.74).
Disability
Disability was measured by means of the IADL scale (0 = worst score, 8 = best score; Lawton and Brody, Reference Lawton and Brody1969). For reasons of clarity, the IADL scale was recoded in our study with 0 = lowest disability and 8 = highest disability.
This scale is widely used and has good psychometric properties (Graf, Reference Graf2008). For example, inter-rater reliability was 0.85. Moreover, the IADL scale was associated (correlations between 0.40 and 0.61) with four functional status scales (Physical classification; Mental Health Status Questionnaire; Behavior and Adjustment rating scales, and the Physical Self-Maintenance Scale). By using the IADL scale (Cronbach's α = 0.92), we focused on rather complex activities of daily living (e.g. taking medication or preparing meals).
Sociodemographic variables
Sociodemographic variables were included as follows: age, sex, level of education (CASMIN classification (Comparative Analysis of Social Mobility in Industrial Nations; Brauns and Steinmann, Reference Brauns and Steinmann1999) with elementary education, secondary education and tertiary education), and family status (single, married, divorced, widowed). The CASMIN classification proposes a certificate-oriented classification scheme. Elementary education refers to (1a) inadequately completed general education, (1b) general elementary education, and (1c) basic vocational qualification or general elementary education and vocational qualification. Secondary education refers to (2a) intermediate vocational qualification or intermediate general qualification and vocational qualification, (2b) intermediate general qualification, and (2c) full maturity certificates. Tertiary education refers to (3a) lower tertiary education and (3b) higher tertiary education.
Other variables
Dummy coded variables for region and time were included. Moreover, comorbidity (presence/absence of 28 chronic conditions reported by the GP) (follow-up wave 2 upward) was assessed. The GP rated the severity on a 1 (mild) to 4 (severe) scale if a chronic condition was present. A weighted count score was created as the sum of severity rating for conditions scored as present. In all variables, proportion of missing values was below 5%.
Statistical analyses
Time-invariant unobserved heterogeneity
Using the FD-approach, unobserved heterogeneity (e.g. genetic disposition, optimism) can be taken into account. It only exploits within-variation over time. For more details about the FD-approach (e.g. assumptions), please see Cameron and Trivedi (Reference Cameron and Trivedi2005).
VAR model
A VAR model (Stock and Watson, Reference Stock and Watson2001) was used, as it does not impose a priori exogeneity assumptions. In this way, we can take the complex relationship of disability and depressive symptoms in late life into account. In a VAR (1) (also called: first-order VAR) case (which is described for didactic reasons), the equation system is
 $$\begin{eqnarray*}
&&\left[ {\begin{array}{@{}*{1}{c}@{}} {{\rm{\Delta }} \ {{\rm Disability}_{i,t}}}\\ {{\rm{\Delta \; Depressive\ symptom}}{{\rm{s}}_{i,t}}} \end{array}} \right] = \left[ {\begin{array}{@{}*{1}{c}@{}} {{c_1}}\\ {{c_2}} \end{array}} \right] + \left[ {\begin{array}{@{}*{2}{c}@{}} {{\beta _{11}}}&{{\beta _{12}}}\\ {{\beta _{21}}}&{{\beta _{22}}} \end{array}} \right]\\
&&\quad\times\; \left[ {\begin{array}{@{}*{1}{c}@{}} {{\rm{\Delta }} \ {{\rm Disability}_{i,t - 1}}}\\ {{\rm{\Delta \; Depressive}}\ {\rm{symptom}}{{\rm{s}}_{i,t - 1}}} \end{array}} \right] + \left[ {\begin{array}{@{}*{1}{c}@{}} {{\varepsilon _{1,t}}}\\ {{\varepsilon _{2,t}}} \end{array}} \right].
\end{eqnarray*}$$
Explicitly written out
 $$\begin{eqnarray*}
{\rm{\Delta }} \ {{\rm Disability}_{i,t}} &=& {c_1} + {\beta _{11}}{\rm{\Delta\; Depressive\ symptom}}{{\rm{s}}_{i,t - 1}} \\
&&+\, {\beta _{12}}{\rm{\Delta }} \ {{\rm Disability}_{i,t - 1}} + {\varepsilon _{1,t}}
\end{eqnarray*}$$
 $$\begin{eqnarray*}
&&{\rm{\Delta\; Depressive\ symptom}}{{\rm{s}}_{i,t}} \\
&&\quad = {c_2} + {\beta _{21}}{\rm{\Delta Depressive\ symptom}}{{\rm{s}}_{i,t - 1}} \\
&&\qquad+\, {\beta _{22}}{\rm{\Delta }} \ {{\rm Disability}_{i,t - 1}} + {\varepsilon _{1,t}}.
\end{eqnarray*}$$
While the term c is a vector of constants, the error term is defined as ε. Both dependent variables, depressive symptoms and disability, are treated as the dependent variable once: First, the change in disability is the outcome variable and the change in lagged (i) disability and (ii) depressive symptoms are independent variables. Second, the change in depressive symptoms is the outcome variable and, again, the change in (i) lagged disability and (ii) lagged depressive symptoms are independent variables. It is important to note that the lag time is from one wave to the next wave. Moreover, it is worth mentioning that the reduced form VAR corresponds to a series of regressions.
Standard errors were computed that cluster errors at the individual level to allow for arbitrary auto-correlation and heteroscedasticity within individuals (Stock and Watson, Reference Stock and Watson2008). Statistical significance was defined as the p value of 0.05 or smaller. p values between 0.05 and 0.10 were considered as marginally significant. Statistical analyses were conducted using Stata 13.1 (Stata Corp., College Station, Texas). Observations with missing values were dropped (listwise deletion).
While apart from dependent variables (Δ t −1 depressive symptoms, Δ t −2 depressive symptoms, Δ t −1 disability, and Δ t −2 disability), other covariates were not included in our first model (“naive” model without accounting for potential confounders), sociodemographic variables (age, marital status and living situation) as well as dummy coded variables for region and time and comorbidity (weighted score) were included in our second model (all assumed to be exogenous). This stepwise approach was used since we were interested in the impact that potential confounders might have on the relation between depressive symptoms and disability.
Results
Sample characteristics
At baseline, the sample consisted of 3,217 individuals. It is worth mentioning that individuals were also included in our VAR models that did not take part at follow-up wave 1, but participated afterward, resulting in 4,582 observations that were included in VAR analysis. This means that all participants that delivered data at four subsequent measurement points (providing three subsequent difference scores) were included in the VAR (2) analysis.
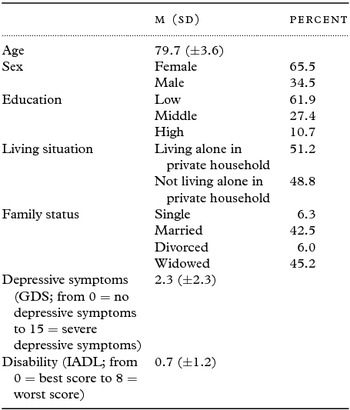
At baseline (Table 1), 65.5% were female and mean age was 79.7 years (±3.6 years), ranging from 75 to 98 years (see Table S1, available as supplementary material attached to the electronic version of this paper at www.journals.cambridge.org/jid_IPG). The majority of participants had elementary education (61.9%) and was living alone in private household (51.2%). Furthermore, widowhood category was the most commonly endorsed category (45.2%). The mean depressive symptoms score was 2.3 (±2.3, ranging from 0 to 15) and the mean disability score was 7.3 (±1.2, ranging from 0 to 8).
Sample characteristics at baseline

n = 3,217; M = Mean; SD = Standard Deviation
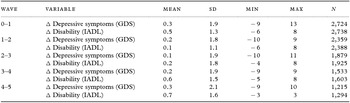
From one wave to the next wave, the mean level of changes was positive in depressive symptoms score and in disability score, both showing deterioration over time (Table 2). In total (results were not shown, but are available upon request), the mean level of change in depressive symptoms score was 0.2 (±1.9) from baseline to follow-up wave 5. In disability score, the mean level of change was 0.4 (±1.5) from baseline to follow-up wave 5.
Mean level of changes in dependent variables

M = Mean; SD = Standard Deviation; from baseline to follow-up wave 5; IADL (from 0 = best score to 8 = worst score); GDS (from 0 = no depressive symptoms to 15 = severe depressive symptoms).
Correlations
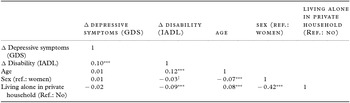
In order to understand our data in more detail, pairwise correlations in differences were depicted (Table 3). A significant positive correlation (r = 0.10, p < 0.001) between change in disability score and change in depressive symptoms score was revealed. Additionally, while age was positively associated with change in disability score (r = 0.12, p < 0.001), living alone in private household was negatively associated with change in disability score (r = −0.09, p < 0.001). Furthermore, pairwise correlation in levels between disability score and depressive symptoms score was moderate (r = 0.16, p < 0.001; results of pairwise correlations in levels were not shown, but are available upon request).
Pairwise correlations in differences

n=13,232.
*p < 0.05.
**p < 0.01.
***p < 0.001.
† p < 0.10.
From baseline to follow-up wave 5; IADL (from 0 = best score to 8 = worst score); GDS (from 0 = no depressive symptoms to 15 = severe depressive symptoms).
VAR analyses
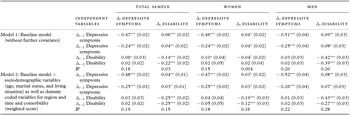
In total, the results of 12 regressions are presented in Table 4. The baseline model (model I) and a second model (model II) were presented. The names of the main predictors are depicted in the second column: a change in depressive symptoms score (first lag: Δ t −1 Depressive symptoms and second lag: Δ t −2 Depressive symptoms) and a change in disability score (first lag: Δ t −1 disability and second lag: Δ t −2 disability), respectively. In the third and fourth columns, the dependent variable is presented for the total sample: change in depressive symptoms score (Δ Depressive symptoms) and change in disability score (Δ disability), respectively. Results for women (fifth and sixth columns) and men (seventh and eighth columns) are depicted in the last columns as separate regressions for women and men were computed. We tested for multicollinearity in all regressions by using the variance inflation criterion. Since the largest variance across all regressions was below 2, we did not have a multicollinearity problem.
Vector autoregressive model: total sample, women, men

n=4,714.
*p < 0.05.
**p < 0.01.
***p < 0.001.
† p < 0.10.
From baseline to follow-up wave 5; Beta-Coefficients were reported; Cluster-robust standard errors in parentheses. Depressive symptoms were measured by using the GDS (from 0 = no depressive symptoms to 15 = severe depressive symptoms). Disability was measured by using the IADL (from 0 = best score to 8 = worst score).
In total sample (4,582 observations), R²-values ranged from 0.16 (model I; women: 0.15; men: 0.20) to 0.19 (model II; women: 0.18; men: 0.22) across both model specifications with change in depressive symptoms score as dependent variable. R²-values ranged from 0.03 (model I; women: 0.004; men: 0.20) to 0.15 (model II; women: 0.16; men: 0.28) across both model specifications with change in disability score as dependent variable.
In the first model, a change in depressive symptoms score (first and second lag) was significantly associated with a change in disability score (model I) in the total sample and in both sexes. In the total sample and in women, a change in disability score (first lag) was significantly associated with a change in depressive symptoms score.
After adjusting for numerous covariates (second model), including sociodemographic variables (age, family status and living situation), comorbidity, region and time, the association between a change (first and second lag) in depressive symptoms score and a change in disability score remained the same in total sample and in men, but was only marginally significant in women (first lag, p < 0.10; second lag, p < 0.10). Moreover, the association between a change in disability score (first lag) and a change in depressive symptoms score was no longer significant in total sample and in women.
It is worth mentioning that significant negative autocorrelation was observed in both dependent variables. To put it differently: If depressive symptoms increased the previous period of time, it is less likely to increase in this time period. This also applied for disability score.
As for control variables, comorbidity was associated with higher depressive symptoms score and disability score. Disability score was positively associated with age. Furthermore, disability score was negatively associated with living alone in private household.
In additional analysis, we redid everything (model I and II) with first-order VARs. In terms of significance, findings were almost the same (results were not shown, but are available upon request).
Discussion
Main findings
In the total sample and in both sexes, we revealed that increased depressive symptoms were associated with subsequent increased disability (first and second lag). No robust association between increased disability and subsequent increased depressive symptoms was detected.
Comparison to previous studies
The strong relation between disability and depressive symptoms has been discussed controversially (Bruce, Reference Bruce2001). While several studies found that depressive symptoms or depression predict changes in disability or the onset of disability (Fauth et al., Reference Fauth, Gerstorf, Ram and Malmberg2012; Mendes de Leon and Rajan, Reference Mendes de Leon and Rajan2014), other existing studies found the reverse relationship. The former findings are at least comparable to our findings (changes in depressive symptoms predict subsequent changes in disability).
Our findings are also comparable to a review, which concluded that longitudinal studies support the relation between depression (baseline and incident) and disability in old age (Schillerstrom et al., Reference Schillerstrom, Royall and Palmer2008). Using an alternative modeling approach, our study support findings found in other research that used other modeling approaches such as traditional growth models (Taylor and Lynch, Reference Taylor and Lynch2004), multiphase growth models (Fauth et al., Reference Fauth, Gerstorf, Ram and Malmberg2012), or two-part regression models (Mendes de Leon and Rajan, Reference Mendes de Leon and Rajan2014).
Moreover, a few studies exist suggesting a bidirectional association between disability and depressive symptoms. Differences between previous findings and our findings might be mainly explained by differences in quantifying disability and the time span between the waves. For example, differences in quantifying disability (impairments in basic activities of daily living vs. impairments in rather complex activities of daily living) might reflect different stages of disability. These different stages of disability might in turn be differently associated with depressive symptoms. More specifically, the current study focused on changes in disability (measured continuously; Lawton and Brody IADL scale). Thus, the present study focused on instrumental (rather complex) activities of daily living. In contrast to other studies focusing on rather basic activities of daily living, our findings suggest that increased disability was not associated with subsequent increased depressive symptoms that mainly corresponds to the findings (no disability changes after onset) reported by Mendes de Leon and Rajan (Mendes de Leon and Rajan, Reference Mendes de Leon and Rajan2014). However, there is also equivocal evidence (Everson-Rose et al., Reference Everson-Rose, Skarupski, Bienias, Wilson, Evans and De Leon2005; Lenze et al., Reference Lenze2005; Van Gool et al., Reference Van Gool, Kempen, Penninx, Deeg, Beekman and van Eijk2005) suggesting that depressive symptoms or depression is associated with changes in disability or physical function, stressing the importance of further investigations. (Van Gool et al., Reference Van Gool, Kempen, Penninx, Deeg, Beekman and van Eijk2005)
More specifically, differences in the time span between the waves might explain differences in findings, because it has been shown that anticipation as well as adaptation effects occurred in estimating the impact of life events (e.g. unemployment, widowhood) on a measure of psychological functioning (12-item General Health Questionnaire, GHQ-12) (Clark and Georgellis, Reference Clark and Georgellis2013). Thus, we think that our findings are in accordance with the theory of hedonic adaptation (Clark et al., Reference Clark, Diener, Georgellis and Lucas2008; Clark and Georgellis, Reference Clark and Georgellis2013) that proposed that well-being is mainly affected in the short-term by life events such as deteriorations in functional status. Consequently, individuals might anticipate future events and get used to certain life events (please see also Alcock et al., Reference Alcock, White, Wheeler, Fleming and Depledge2014). Since the time span between the waves was 18 months in our study, short-term changes in depressive symptoms, which might be present, resulting from previous changes in disability, might be covered due to adaptation processes that means that individuals adapt to various life events. This might explain why initial changes in disability were not associated with subsequent changes in depressive symptoms in our study. However, some studies have found that these factors are actually related: Even though the time span between the waves was rather short (one year) in the study conducted by Ormel et al. (Reference Ormel, Rijsdijk, Sullivan, van Sonderen and Kempen2002), it was quite long in the studies, for example, performed by Chen et al. (Reference Chen, Mullan, Su, Griffiths, Kreis and Chiu2012) (2 years), Bacon et al. (Reference Bacon, Heeren, Keysor, Stuver, Cauley and Fredman2015) (2 years), or Yang and George (Reference Yang and George2005) (6 years). Consequently, our explanation should be treated with caution at present and future studies are required to clarify this longitudinal relationship.
Our findings – the robust association of changes in depressive symptoms and subsequent changes in disability (but not vice versa) – may be explained by several factors. Depressive symptoms might impair social awareness, affect regulation as well as cognitive and motivational capacities (Ormel et al., Reference Ormel, Rijsdijk, Sullivan, van Sonderen and Kempen2002). Furthermore, depressive symptoms might intensify feelings such as pain (Ormel et al., Reference Ormel, VonKorff, Ustun, Pini, Korten and Oldehinkel1994). Even psychobiological mechanisms might play a role in the pathway from depressive symptoms to disability (Penninx et al., Reference Penninx, Guralnik, Ferrucci, Simonsick, Deeg and Wallace1998).
Strengths and limitations
This is the first study examining the complex relationship of disability and depressive symptoms in a large cohort with old age in Germany. A further key strength is that we draw on an almost representative sample of old age participants in Germany as individuals were recruited via GP offices and almost every elderly individual has regular GP visits. Additionally, time span between waves was (i) rather short and (ii) we draw on a long running dataset.
We cannot exclude the possibility that other factors might play a role in the relationship between depressive symptoms and disability (e.g. social ties). When data are available, these factors should be included. Furthermore, a regression to the mean effect concerning negative autocorrelation in our dependent variables cannot be entirely excluded. Nevertheless, extreme negative values for depressive symptoms and disability were rare.
Moreover, even if disability was quantified by using a self-report method, it is proposed to be valid (Yang, Reference Yang2006; Gayman et al., Reference Gayman, Turner and Cui2008). However, it should be kept in mind that this disability scale (Lawton and Brody IADL scale) is rather insensitive to small changes in functional abilities. Moreover, there is evidence that traditional IADLs are more closely related to physical fitness rather than cognitive complexity (Fieo et al., Reference Fieo, Austin, Starr and Deary2011). In addition, the IADL scale is often treated as a continuous variable. However, the definition of the zero point is arbitrary, and it is unclear whether the scale is equidistant or not (Fieo et al., Reference Fieo, Austin, Starr and Deary2011). Furthermore, there was a lack of detailed information about activities of daily living such as adjustments in performance. Thus, it is unknown whether the individuals need more time or effort to perform activities of daily living.
The focus of this study was to discover the complex co-occurrence of depressive symptoms and disability in late life. Knowing this, a first step can be made regarding causality. This means that we concentrated on intertemporal relations, which is similar to “Granger-causality” (Granger, Reference Granger1988). According to this concept, a variable X “Granger causes” another variable Y when the past values of X are useful in forecasting Y and beyond the information contained in past values of Y alone. However, an exogenous stimulus is required to gain deeper insights into the relationship between depressive symptoms and disability.
Besides, future research should clarify the role of changes in social support and physical condition. These factors might affect the relationship of functional disability and depressive symptoms (Taylor and Lynch, Reference Taylor and Lynch2004; Chao, Reference Chao2014). In addition, a problem of difference scores is the low internal consistency reliability (Edwards, Reference Edwards2001). Furthermore, they suffer from some other methodological problems (Edwards, Reference Edwards2001). For example, when difference scores are used as explanatory variables, it does impose constraints decreasing the variance explained.
Moreover, even though several covariates were included in the VAR model, the r-squared values were rather low. Consequently, our findings should be interpreted with caution. For example, due to data restrictions, factors such as self-efficacy or self-esteem could not be included in our study. In addition, the use of listwise deletion might be a limitation of this study. Thus, the use of missing data techniques might be a strategy (Schafer and Graham, Reference Schafer and Graham2002). However, the proportion of missing data are quite low in the present study (with up to 3% in depressive symptoms), suggesting that this bias might be rather small (Langkamp et al., Reference Langkamp, Lehman and Lemeshow2010).
Conclusion
Future longitudinal studies should consider the fact that the relationship between disability and depressive symptoms in late life is by no means simple (Bruce, Reference Bruce2001). Thus, ordinary regression techniques might be inadequate to deal with this relationship. Besides, our findings should be validated by using other models to analyze longitudinal data such as latent change score models (McArdle, Reference McArdle2009). Moreover, our findings highlight the importance of changes in depressive symptoms for future changes in disability in old age.
Future studies should validate our findings by using other measures of depressive symptoms (e.g. Center for Epidemiological Studies Depression Scale; Radloff, Reference Radloff1977) and disability. Additionally, future studies should include younger age groups and more generally should use other prospective cohort studies.
Conflict of interest
None.
Description of author's roles
AH made substantial contributions to conception and design of the study, the analysis and interpretation of data and drafted the manuscript. HHK and SRH made substantial contributions to the analysis and interpretation of data and drafting of the manuscript. CB, DL, ME, SM, SW, JS, TL, WM, HB, KH, MW and MS made substantial contributions to conception and design, and critically revised the manuscript. BW made substantial contributions to conception and design, contributed to the analyses and data interpretation and critically revised the manuscript. JW, EM, AF and MP carried out patient assessments, contributed to the interpretation of data and critically revised the manuscript. All authors read and approved the final manuscript.
Acknowledgments
Members of the AgeCoDe Study Group:
Principal Investigators: Wolfgang Maier, Martin SchererFootnote *
Heinz-Harald Abholz, Christian Brettschneider, Cadja Bachmann, Horst Bickel, Wolfgang Blank, Hendrik van den Bussche, Sandra Eifflaender-Gorfer, Marion Eisele, Annette Ernst, Angela Fuchs, André Hajek, Kathrin Heser, Frank Jessen, Hanna Kaduszkiewicz, Teresa Kaufeler, Mirjam Köhler, Hans-Helmut König, Alexander Koppara, Carolin Lange, Diana Lubisch, Tobias Luck, Dagmar Lühmann, Melanie Luppa, Manfred Mayer, Edelgard Mösch, Michael Pentzek, Tina Posselt, Jana Prokein, Steffi Riedel-Heller, Susanne Röhr, Anna Schumacher, Janine Stein, Susanne Steinmann, Franziska Tebarth, Michael Wagner, Klaus Weckbecker, Dagmar Weeg, Jochen Werle, Siegfried Weyerer, Birgitt Wiese, Steffen Wolfsgruber, Thomas Zimmermann.
We want to thank both all participating patients and their general practitioners for their good collaboration.
Supplementary Material
To view supplementary material for this article, please visit http://doi.org/10.1017/S1041610216002507