





1. Introduction
Air-entraining bubbly flows are relevant to a variety of natural and engineering applications, including liquid metal fast breeder reactors (Patwardhan et al. Reference Patwardhan, Mali, Jadhao, Bhor, Padmakumar and Vaidyanathan2012), sea-surface gas exchange due to breaking waves (Thorpe Reference Thorpe1982), water quality in lakes and rivers, and the wake around ships (Castro, Li & Carrica Reference Castro, Li and Carrica2016). An important characteristic of these flows is the size of bubbles within the fluid, as described by the bubble-size distribution. This distribution is the result of fragmentation, coalescence, dissolution, entrainment and degassing. There has been significant study of the first three mechanisms, especially fragmentation (Liao & Lucas Reference Liao and Lucas2009; Martínez-Bazán et al. Reference Martínez-Bazán, Rodríguez-Rodríguez, Deane, Montaes and Lasheras2010; Qi, Mohammad Masuk & Ni Reference Qi, Mohammad Masuk and Ni2020). In this work, we focus directly on the relationship between turbulent fragmentation and entrainment, the original source of the bubbles, ignoring coalescence, dissolution and degassing. Thus the present results would directly apply to flows with small void fractions (where coalescence is less important), and for relatively short times (before dissolution and degassing play significant roles). For the more general problem, our results provide useful insight into the interaction dynamics between entrainment and fragmentation even in the presence of the other mechanisms.
Direct measurement of entrainment is difficult due to proximity to a necessarily complex free surface. Thus characteristics of entrainment such as the entrainment size distribution  $I(a)$ are often inferred from the bulk bubble-size distribution
 $N(a,t)$ (Yu et al. Reference Yu, Hendrickson, Campbell and Yue2019). (Here the effective bubble radius
 $a$ is typically defined in terms of the bubble volume
 $V$ by
 $a=(3V/4{\rm \pi} )^{1/3}$.) However, the link between
 $I(a)$ and the resulting
 $N(a,t)$ is still not well understood. Recent work (Yu, Hendrickson & Yue Reference Yu, Hendrickson and Yue2020) suggests that entrainment follows a power-law size distribution
 $I(a)\propto a^\gamma$, contrary to the current simplifying assumption,
 $I(a)\propto \delta (a-a_{max})$ (Garrett, Li & Farmer Reference Garrett, Li and Farmer2000), where
 $\delta$ is the Dirac delta function. The objective of the present work is to elucidate the connection between an entrainment process following a general power-law distribution and the resultant bubble-size distribution. Of particular interest are the equilibrium bulk bubble-size distribution
 $N_{eq}(a)$ and the time scale
 $\tau _c$ for this equilibrium to be reached after the initiation of entrainment.
A well-established scale in fragmentation is the Hinze scale  $a_H$ (Hinze Reference Hinze1955), which delineates the length scale where surface tension prevents fragmentation by local turbulent velocity fluctuations. For isotropic homogeneous turbulent (IHT) flows, velocity fluctuations within the Kolmogorov inertial sub-range are described by an energy cascade, and the turbulent Weber number is given by
 ${\textit {We}} = \rho 2 \varepsilon ^{2/3} (2 a)^{5/3} \sigma ^{-1}$, where
 $\rho$ is the density of the surrounding fluid,
 $\sigma$ is the surface tension coefficient and
 $\varepsilon$ is the turbulent dissipation rate. The Hinze scale occurs at the critical turbulent Weber number
 ${\textit {We}}_c \approx 4.7$ (Lewis & Davidson Reference Lewis and Davidson1982; Martínez-Bazán, Montañés & Lasheras Reference Martínez-Bazán, Montañés and Lasheras1999a). For
 $a\gg a_H$ (
 ${\textit {We}}\gg We_c$), velocity fluctuations dominate and, assuming IHT, a mechanistic argument can be used to determine the expected life of a bubble from creation to fragmentation, the reciprocal of which is the expected breakup frequency (Martínez-Bazán et al. Reference Martínez-Bazán, Montañés and Lasheras1999a, Reference Martínez-Bazán, Rodríguez-Rodríguez, Deane, Montaes and Lasheras2010; Garrett et al. Reference Garrett, Li and Farmer2000):
 \begin{equation} \varOmega(a) = C_\varOmega \varepsilon^{1/3} a^{{-}2/3} . \end{equation}
Experiments suggest  $C_\varOmega \approx 0.42$ (Martínez-Bazán et al. Reference Martínez-Bazán, Montañés and Lasheras1999a; Rodríguez-Rodríguez, Gordillo & Martínez-Bazán Reference Rodríguez-Rodríguez, Gordillo and Martínez-Bazán2006).
For bubbles with  $a > a_H$, Garrett et al. (Reference Garrett, Li and Farmer2000) developed a fragmentation (only) cascade model by assuming all bubbles are injected at a single radius
 $a_{max}$,
 $I(a)\propto \delta (a-a_{max})$, and fragment into
 $m$ identical daughter bubbles. Using (1.1), the resulting equilibrium bubble-size distribution
 $N_{eq}(a)$ is
 \begin{equation} N_{eq}(a) \propto Q \varepsilon^{{-}1/3} a^{\beta}, \quad \beta={-}10/3 , \end{equation}
where  $Q$ is the steady volumetric flow rate of air being injected. Bulk bubble-size distributions reasonably described by a power-law slope around
 $\beta \approx -10/3$ for
 $a>a_H$ are observed during entrainment in a variety of air-entraining bubbly flows (Deane & Stokes Reference Deane and Stokes2002; Blenkinsopp & Chaplin Reference Blenkinsopp and Chaplin2010; Deane, Stokes & Callaghan Reference Deane, Stokes and Callaghan2016; Deike, Melville & Popinet Reference Deike, Melville and Popinet2016; Wang, Yang & Stern Reference Wang, Yang and Stern2016; Hendrickson, Yu & Yue Reference Hendrickson, Yu and Yue2020; Yu et al. Reference Yu, Hendrickson and Yue2020; Chan et al. Reference Chan, Johnson, Moin and Urzay2021). Droplet equilibrium distributions following a
 $-10/3$ power law have also been observed due to fragmentation and coalescence (without injection) at high void fractions (Skartlien, Sollum & Schumann Reference Skartlien, Sollum and Schumann2013; Mukherjee et al. Reference Mukherjee, Safdari, Shardt, Kenjereš and Van den Akker2019); however, it is not clear how the effect of coalescence is related to the entrainment we study here.
Recent work by Yu et al. (Reference Yu, Hendrickson and Yue2020) provides an alternative explanation for  $\beta =-10/3$. While studying entraining free-surface turbulence in direct numerical simulations, they observed bubbles being entrained over a broad range of sizes. Comparing the interfacial and gravitational potential energy of newly formed bubbles to the kinetic energy available from nearby turbulence at similar scales, they provide an argument that this entrainment follows a power-law distribution of slope
 $\gamma =-10/3$ for large (Bond number
 ${\textit {We}}/{\textit {Fr}}^2\gg 1$) bubbles. This would cause a bulk bubble-size distribution with power-law slope
 $\beta \approx \gamma$ during some initial time before the effects of fragmentation and other mechanisms come into play.
Considering the fragmentation cascade used by Garrett et al. (Reference Garrett, Li and Farmer2000), Deike et al. (Reference Deike, Melville and Popinet2016) proposed a critical time
 \begin{equation} \tau_c \propto c_{q,m} \varepsilon^{{-}1/3} {a_{max}}^{2/3} \end{equation}
for convergence to the equilibrium described by (1.2), based on the number of identical fragmentation events  $q$ to go from a bubble of radius
 $a_{max}$ to
 $a_H$. Recent work by Qi et al. (Reference Qi, Mohammad Masuk and Ni2020) (also assuming
 $I(a)\propto \delta (a-a_{max})$) suggests
 $\tau _c$ should depend on the daughter bubble-size distribution, and that identical fragmentation only represents a lower bound on
 $\tau _c$. A power-law entrainment distribution
 $I(a)\propto a^\gamma$ as suggested by Yu et al. (Reference Yu, Hendrickson and Yue2020) could also lead to an equilibrium, but neither the resulting
 $N_{eq}(a)$ nor
 $\tau _c$ has been described. By considering the interaction between power-law entrainment and fragmentation, we are able to create a general description of
 $N_{eq}(a)$ and
 $\tau _c$, including a quantification of the effects of different daughter bubble-size distributions.
Section 2 develops a population balance model describing realistic steady injection of bubbles following a power law  $I(a)\propto a^{\gamma }$ and fragmentation for
 $a>a_H$, which allows us to study the interaction between power-law entrainment, such as that proposed by Yu et al. (Reference Yu, Hendrickson and Yue2020), and fragmentation. Section 3 determines the resulting
 $N_{eq}(a)$ with its local slope
 $\tilde {\beta }_{eq}(a)$ dependent on
 $\gamma$ in two regimes, providing insight into what observations of
 $\beta \approx -10/3$ tell us about
 $I(a)$. Section 4 determines the critical time scale
 $\tau _c$ for convergence to
 $N_{eq}(a)$ under power-law injection, including a quantification of its dependence upon the distribution of daughter bubbles. Simulations show the effect of fragmentation quickly becomes important, even at times
 $t\ll \tau _c$. Finally, § 5 shows that the interaction between a realistic entrainment distribution and fragmentation (alone) results in steepening of the bubble-size distribution similar to what has been observed in the literature.
2. Describing injection-driven fragmentation cascades
We consider the population density function  $n(a,\boldsymbol {x},t)$ (dimension
 $L^{-4}$) where
 $n(a,\boldsymbol {x},t)\delta a \delta \boldsymbol {x}$ is the number of bubbles of radius
 $a< a' < a + \delta a$ in a volume
 $\delta \boldsymbol {x}$ around a specified location
 $\boldsymbol {x}$ at time
 $t$. A Boltzmann-type population balance model describes the evolution of
 $n$ (Williams Reference Williams1985, chap. 11):
 \begin{equation} {\partial n}/{\partial t} + \boldsymbol{\nabla}\boldsymbol{\cdot}(\bar{\boldsymbol{v}} n)= s_d+s_b+s_c , \end{equation}
where  $\bar {\boldsymbol {v}}$ is the mean velocity of bubbles of the given radii, and
 $s_d$,
 $s_b$ and
 $s_c$ are respectively the movement of air between bubble sizes due to dissolution, fragmentation and coalescence. For locally uniform flows, integrating
 $n(a,\boldsymbol {x},t)$ over the domain, we define the bulk bubble-size distribution
 $N(a,t)$, of dimension
 $L^{-1}$. Integrating
 $s_b$ over the domain yields the bulk fragmentation contribution
 $S_b$:
 \begin{equation} S_b(a,t) ={-} \varOmega(a) N(a,t) + \int_a^\infty m(a') f(a;a') \varOmega(a') N(a',t) \,\mathrm{d}a', \end{equation}
where  $m(a')$ is the number of daughter bubbles created during the breakup of a parent of radius
 $a'$ and
 $f(a;a')$ is the radius-based probability density function (p.d.f.) describing the radius
 $a$ of daughter bubbles created by that breakup (Liao & Lucas Reference Liao and Lucas2009; Martínez-Bazán et al. Reference Martínez-Bazán, Rodríguez-Rodríguez, Deane, Montaes and Lasheras2010).
For simplicity, we focus on the relationship between entrainment and fragmentation, ignoring coalescence, dissolution and degassing. Thus,
 \begin{equation} {\partial N}/{\partial t}(a,t) = S_b(a,t)+I(a) \end{equation}
defines the population balance model for an injection-driven fragmentation cascade with  $I(a)$ the (steady) inflow of bubbles into the domain due to entrainment. Our interest is for
 $a>a_H$, and, as modelled,
 $N(a,t)$ depends only on scales larger than
 $a$; thus, sub-Hinze-scale mechanisms can be ignored.
2.1. A simple population balance model (S-PBM) for fragmentation cascades
An analytic solution to  $N(a,t)$ requires a simplified description of
 $S_b$. To satisfy volume conservation and the definition of a p.d.f.,
 $f(a';a)$ must satisfy the following (Martínez-Bazán et al. Reference Martínez-Bazán, Rodríguez-Rodríguez, Deane, Montaes and Lasheras2010):
 \begin{equation} m(a) \int_0^a (a'/a)^3 f(a';a) \,\mathrm{d}a' = 1, \quad \int_0^a f(a';a) \,\mathrm{d}a' = 1 . \end{equation}
For simplicity, we assume a bubble breaks up into  $m$ (independent of
 $a$) identical bubbles (Garrett et al. Reference Garrett, Li and Farmer2000). Satisfying (2.4a,b) produces the identical daughter distribution (Valentas, Bilous & Amundson Reference Valentas, Bilous and Amundson1966)
 \begin{equation} f(a';a) = \delta(a'-a m^{{-}1/3}) . \end{equation}
Equation (2.5) makes analytic evaluation in §§ 2.2 and 3.1 possible. §§ 3.2 and 4 consider more realistic daughter distributions from literature. Combining (2.2) and (2.5), and upon integration with a change of variable for the delta function, we obtain
 \begin{equation} S_b(a,t) ={-} \varOmega(a) N(a,t) + m^{1/3} [ m \varOmega( m^{1/3} a) N( m^{1/3} a,t) ] . \end{equation}
Using (1.1) and (2.6), we simplify (2.3) and define the simple population balance model (S-PBM) as
 \begin{equation} {\partial N^*}/{\partial t^*}(a^*,t^*) = {a^*}^{{-}2/3}[{-}N^*(a^*,t^*)+m^{10/9} N^*(m^{1/3} a^*,t^*)] + I^*(a^*), \end{equation}
where  $\cdot ^*$ denotes nondimensionalisation using the characteristic bubble radius
 $L=a_{max}$ and time
 $T=\varOmega (a_{max})^{-1}$.
2.2. Scale-invariant solutions to S-PBM
We consider solutions to (2.7) where  $N^*(a^*,t^*)={a^*}^\beta g(t^*)$ for all
 $a\in (0,\infty )$, defining
 $g(t^*)$ to be only a function of time. Substituting into (2.7) gives
 \begin{equation} {\mathrm{d} g}/{\mathrm{d} t^*} = g {a^*}^{{-}2/3} ({-}1 + m^{\beta/3+10/9}) + {a^*}^{-\beta} I^*(a^*). \end{equation}
For  $g(t^*)$ to be independent of
 $a^*$ and injection to be non-trivial,
 $I^*$ must also be scale-invariant:
 $I^*(a)= h {a^*}^\gamma$ for all
 $a\in (0,\infty )$, where
 $h$ is a constant, and the power-law slope is
 $\gamma$. There are only two admissible solutions for the form of
 $N^*$ we consider. The first is a transient solution in which
 $\beta =\gamma =-10/3$ and
 $\mathrm {d} g/\mathrm {d} t^*=h$, resulting in
 $S_b=0$. This (
 $S_b=0$) is equivalent to the condition imposed by Garrett et al. (Reference Garrett, Li and Farmer2000) to represent an equilibrium for their fragmentation cascade. The second solution is a steady-state solution in which
 $\beta =\gamma +2/3$ and
 $\mathrm {d} g/\mathrm {d} t^*=0$. Both admissible solutions have physical limitations. To describe the commonly observed
 $\beta =-10/3$, they would suggest
 $\gamma =-10/3$ or
 $\gamma =-4$; however,
 $\gamma \ge -4$ implies an infinite rate of volume injection.
3. Equilibrium solutions for cutoff spectral injection
Based on the mechanistic energy argument by Yu et al. (Reference Yu, Hendrickson and Yue2020) and § 2.2, we assume an entrainment size distribution described by a power law of slope  $\gamma$. To ensure a finite rate of volume injection, we introduce a cutoff radius
 $a_{max}$ above which there is no bubble injection. In addition to ensuring finite injected volume if
 $\gamma \ge -4$, physical limits of a flow will necessarily impose some
 $a_{max}$. For example, Yu et al. (Reference Yu, Hendrickson and Yue2020) proposed an
 $a_{max}$ for entraining free-surface turbulence based on bubble Froude number. The cutoff spectral injection model (SIM) is thus
 \begin{equation} I^* = h (a^*)^\gamma \mathcal{H}(1-a^*), \end{equation}
where  $\mathcal {H}$ is the Heaviside step function. Note that (3.1) is a generalization of Garrett et al. (Reference Garrett, Li and Farmer2000), which corresponds to
 $\gamma \rightarrow \infty$ (all bubbles injected at
 $a=a_{max}$). In § 4, we show that under SIM,
 $N(a,t)$ approaches an equilibrium
 $N_{eq}(a)$ in a time scale given by
 $\tau _c$.
SIM allows us to define a new global condition for equilibrium: the volume flux of air injected as bubbles larger than  $a$ must be equal to the volume flux of air from bubbles larger than
 $a$ to bubbles smaller than
 $a$ due to fragmentation; i.e.,
 \begin{equation} \int_{a^*}^\infty I^*(r) r^3 \,\mathrm{d}r = \int_{a^*}^\infty N_{eq}^*(r) \varOmega^*(r) m \int_0^{a^*} {r'}^3 f^*(r';r) \,\mathrm{d}r' \,\mathrm{d}r, \end{equation}
where the integration variables  $r$ and
 $r'$ are dimensionless (scaled by
 $a_{max}$).
3.1. Local power-law slope of the equilibrium bulk bubble-size distribution
Rather than assuming a strict power-law relationship as in § 2.2, we allow the power-law slope to vary continuously with radius, described by  $\tilde {\beta }(a^*)$. We define a local approximation
 \begin{equation} N_{eq}^*(r)\approx\tilde{g}_{eq}(a^*)r^{\tilde{\beta}_{eq}(a^*)} \quad \text{for } r\sim a^* . \end{equation}
Applying this as well as (1.1) and (3.1) to (3.2) produces
 \begin{equation} h \int_{a^*}^1 r^{\gamma+3} \,\mathrm{d}r = \tilde{g}_{eq}(a^*) \int_{a^*}^1 {r}^{\tilde{\beta}_{eq}(a^*)-2/3} m \int_0^{a^*} {r'}^3 f^*(r';r) \,\mathrm{d}r'\,\mathrm{d}r. \end{equation}
We note that for  ${a^*}^{\gamma +4}\ll 1$, the left side of (3.4) approaches the (non-dimensionalised) steady volumetric flow rate of air being injected,
 $Q^*$. As
 $\tilde {g}_{eq}(a^*)$ is a measure of the magnitude of
 $N_{eq}^*(a^*)$, and it will be shown in § 4 that
 $\tilde {g}_{eq}(a^*\ll 1)$ is independent of
 $a^*$, we recover the linear proportionality between
 $N_{eq}(a)$ and
 $Q$ given by (1.2) for
 $a\ll a_{max}$.
To further simplify (3.4), we assume identical fragmentation (2.5). Noting that in this case the inner integral on the right side of (3.4) is only non-zero for  $r < a^* m^{1/3}$, we change the upper limit of integration on the outer integral to
 $a^* m^{1/3}$ and obtain
 \begin{equation} h (\gamma+4)^{{-}1} [1-{a^*}^{\gamma+4}]= \tilde{g}_{eq}(a^*) \frac{{a^*}^{\tilde{\beta}_{eq}(a^*)+10/3}}{\tilde{\beta}_{eq}(a^*)+10/3} [{m}^{\tilde{\beta}_{eq}(a^*)/3+10/9}-1]. \end{equation}
Applying the local equilibrium condition  $\partial N_{eq}(a) / \partial t =0$, (2.7) gives
 \begin{equation} {a^*}^{{-}2/3}[ m^{10/9} N_{eq}^*( a^* m^{1/3})-N_{eq}^*(a^*)] + h {a^*}^{\gamma} = 0 . \end{equation}
Using the local approximation (3.3) about  $a^*$ to approximate
 $N_{eq}^*(a^* m^{1/3})$ gives
 \begin{equation} \tilde{g}_{eq}(a^*) {a^*}^{\tilde{\beta}_{eq}(a^*)-2/3}( m^{\tilde{\beta}_{eq}(a^*)/3+10/9}-1) + h {a^*}^{\gamma} = 0 . \end{equation}
Combining (3.5) and (3.7), we determine the relationship between  $\tilde {\beta }_{eq}(a)$ and the injection power-law slope
 $\gamma$:
 \begin{equation} \tilde{\beta}_{eq}(a) = \frac{\gamma+4}{1-(a_{max}/a)^{\gamma+4}} - 10/3 . \end{equation}
We note that as  $a\rightarrow a_{max}$,
 $\tilde {\beta }_{eq}(a)$ becomes more negative; the equilibrium slope becomes steeper for the largest bubbles. We revisit this point in § 5.
When  $a_H \ll a_{max}$, most of the bubble-size distribution will follow a single power law
 $\beta =\tilde {\beta }_{eq}(a \ll a_{max})$. There are two distinct regimes, which are similar to those in § 2.2. The weak injection regime (
 $\gamma \ge -4$) has injected volume concentrated at large bubbles, and as a result the fragmentation term dominates the injection term of (2.3) at equilibrium. Here, the equilibrium slope is
 $\tilde {\beta }_{eq}(a \ll a_{max})=-10/3$, independent of
 $\gamma$. We note that we can recover Garrett et al. (Reference Garrett, Li and Farmer2000): when
 $\gamma =\infty$,
 $\tilde {\beta }_{eq}(a)=-10/3$ for all
 $a<a_{max}$. The strong injection regime (
 $\gamma < -4$) has injected volume concentrated at small bubbles, and the injection term dominates (2.3) at equilibrium. Yet fragmentation still modifies the equilibrium slope and
 $\tilde {\beta }_{eq}(a \ll a_{max})=\gamma +2/3$. In both regimes,
 $\tilde {\beta }_{eq}(a)\le -10/3$, making it the upper limit of the power-law slope. We conclude by noting that in the weak regime, because
 $\tilde {\beta }_{eq}(a)$ is independent of
 $\gamma$, the equilibrium bubble-size distribution cannot be used to infer information on the underlying entrainment distribution.
3.2. The influence of fragmentation daughter distribution models
We consider here the effect of daughter distributions more realistic than the identical distribution used in § 3.1. Phenomenological daughter distributions are typically categorised as bell-shaped, U-shaped or M-shaped (Liao & Lucas Reference Liao and Lucas2009). We consider a binary-fragmentation ( $m=2$) daughter distribution from each category and a daughter distribution proposed by Diemer & Olson (Reference Diemer and Olson2002) for
 $m\ne 2$. We assume
 ${\textit {We}}=\infty$, so there is no minimum daughter-bubble radius and the daughter distributions become scale-invariant. We describe these daughter distributions using the volume-based p.d.f.
 $f_V^*(V^*)$ based on the relative volume
 $V^*=(a'/a)^3$, which is related to the radius-based p.d.f. by
 $a f(a';a)= 3 {V^*}^{2/3} f_V^*(V^*)$ (Martínez-Bazán et al. Reference Martínez-Bazán, Rodríguez-Rodríguez, Deane, Montaes and Lasheras2010). Table 1 gives the volume-based p.d.f. for each daughter distribution considered.
Volume-based p.d.f.s,  $f_V^*(V^*)$, of daughter distributions used in simulations and corresponding time scaling constant
 $C_f$ calculated using (4.4). Note that a constant to ensure
 $\int f_V^*(V^*)\,\mathrm {d}V^*=1$ is omitted for brevity.

To confirm the validity of (3.8) for general daughter distributions, we perform two types of simulations over a broad range of  $\gamma$ and
 $a_{max}/a$: (a) direct numerical simulations of the S-PBM (2.7); and (b) Monte Carlo (MC) simulations where fragmentation following (1.1) and injection following SIM are modelled as Poisson processes over each fixed
 ${\rm \Delta} t$. Direct simulation of (2.7) is inexpensive because it is deterministic, but it is applicable only for identical daughter distributions (case A in table 1 for
 $m=2$). In these simulations, discretisation of radius is done on a logarithmic scale and Heun's method is used for time marching. MC simulations are computationally more expensive, but capture the stochastic nature of fragmentation and entrainment and are applicable for general daughter distributions. MC simulations are performed for cases in table 1 where the daughter bubbles from each fragmentation event are chosen using random sampling of the respective distributions. Due to the power-law nature of bubble-size distributions, the simulated distributions are averaged over logarithmic intervals based on
 $m^{1/3}$:
 \begin{gather} {\langle{N(a)}\rangle}_m = ( a (m^{1/3} - 1) )^{{-}1} \int_a^{a\,m^{1/3}} N(a') \, \mathrm{d}a', \end{gather}
 \begin{gather}{\langle{\tilde{\beta}(a)}\rangle}_m = 3 \ln( {{\langle{N(a)}\rangle}_m}/{{\langle{N(a\,m^{{-}1/3})}\rangle}_m} ) /\ln(m). \end{gather}
We establish convergence for both simulation types with  $\varOmega (a) {\rm \Delta} t = 1/100$ and
 $30$ bins per
 $m^{1/3}$ interval for the radius discretisation of S-PBM. The results of the S-PBM and MC simulations are compared to (3.8) in figure 1 and show good agreement. These simulations demonstrate that the equilibrium slope predicted by (3.8), although based on the simplifying assumption of identical fragmentation, is, in fact, applicable to general daughter distributions. This is consistent with the observation by Qi et al. (Reference Qi, Mohammad Masuk and Ni2020) that the choice of daughter distribution has no effect on the equilibrium power-law slope for fragmentation cascades.
Comparison of equilibrium local power-law slopes resulting from SIM with a range of injection power-law slopes  $\gamma$, as modelled by (3.8) (—–); case A (
 $\bullet$); case B (
 $+$, blue); case C (
 $\times$, yellow); case D (
 $\square$, red); case E (
 $\circ$, green); case F (
 $\circ$, purple). Case A is calculated using direct numerical simulations, cases B–F using MC simulations. The value of
 $a_{max}/a$ for the reported
 ${\langle {\tilde {\beta }_{eq}(a)}\rangle }_m$ is indicated below each data set. For the MC simulations, the inset shows the equilibrium bubble-size distributions for
 $\gamma =-10/3$ compared to
 $\propto a^{-10/3}$ (- - - -).

4. Time scale of convergence to the equilibrium distribution
We investigate the convergence time  $\tau$ such that
 $N(a,t>t_0+\tau )\approx N_{eq}(a)$, where
 $N(a,t_0)=0$. First, we revisit the global equilibrium condition (3.4). Rewriting it in terms of
 $f_V^*$, we have
 \begin{equation} h \int_{a^*}^1 r^{\gamma+3}\,\mathrm{d}r = \tilde{g}_{eq}(a^*) \frac{m}{3} {a^*}^{\tilde{\beta}_{eq}(a^*)+10/3}\ \int_{{a^*}^3}^1 {u}^{-\tilde{\beta}_{eq}(a^*)/3-19/9} \int_0^{u} v f_V^*(v) \,\mathrm{d}v\,\mathrm{d}u . \end{equation}
For weak injection, we consider the limiting case  $a^*\rightarrow 0$. By (3.8),
 $\tilde {\beta }_{eq}(a^*)=-10/3$ and we can simplify (4.1):
 \begin{equation} \frac{h}{\gamma+4} = \tilde{g}_{eq}(a^*\ll1) \frac{m}{3}\ \int_{0}^1 {u}^{{-}1} \int_0^{u} v f_V^*(v) \,\mathrm{d}v\,\mathrm{d}u . \end{equation}
Rearranging (4.2), we define a new constant  $C_f$ to quantify the effect of
 $f_V^*$ on
 $\tilde {g}_{eq}$ and scale
 $C_f$ so that for an identical daughter distribution, (2.5), it has a value of unity:
 \begin{equation} \tilde{g}_{eq}(a^*\ll1)= \frac{3}{\ln(m) } \frac{h}{\gamma+4} C_f; \quad C_f=\frac{\ln(m)/m}{\displaystyle \int_{0}^1 \int_0^{1} u w f_V^*(u w) \,\mathrm{d}w\,\mathrm{d}u} . \end{equation}
Table 1 shows the numerically calculated values of  $C_f$.
We write the varying power-law slope description of the bubble-size distribution  $N_{eq}$ from § 3.1, now as a function of time:
 $N^*(a^*,t^*)\approx \tilde {g}(a^*,t^*){a^*}^{\tilde {\beta }(a^*,t^*)}$. With the dependence on
 $a^*$ omitted for clarity,
 $\tilde {g}(t)$ has a Taylor approximation to first order:
 $\hat {g}(t) = \tilde {g}(t_0) + (t-t_0) \tilde {g}^{\prime }(t_0)$. Using (2.3) and
 $\tilde {g}(t_0)=0$, we obtain
 $\tilde {g}^{\prime }(t_0)=h {a^*}^{\gamma -\tilde {\beta }(a^*,t_0)}$. Note that we neglected the time dependence of
 $\tilde {\beta }(a^*,t)$ (cf. figure 2), making
 $\hat {g}(t)$ a poor description of the general evolution of
 $N^*(a^*,t^*)$. However for the special case
 $\gamma =-10/3$ and
 $a^*\ll 1$,
 $\tilde {\beta }(a^*,t)=\gamma$ and we can define a critical time
 $\tau _c$ such that
 $\hat {g}(t_0+\tau _c)=\tilde {g}_{eq}(a^*\ll 1)$:
 \begin{equation} \tau_c = (9/2)(\ln m)^{{-}1}({C_f}/{C_\varOmega}) \varepsilon^{{-}1/3} {a_{max}}^{2/3} . \end{equation}
Despite the special case used in deriving (4.4), numerical simulations of S-PBM and MC simulations of realistic daughter distributions (cf. § 3.2) show that  $\tau _c$ provides a general time scaling, with equilibrium reached at
 $\tau \approx 2\tau _c$ for weak injection and
 $\tau \lesssim \tau _c$ for strong injection. Figure 2 shows results from simulations of
 $a_{max}/a=3$ and
 $a_{max}/a=10$. The S-PBM simulations of larger
 $a_{max}/a$ (not shown) demonstrate similar behaviour for weak injection, with
 $\tau /\tau _c$ becoming smaller for strong injection. Figure 2 provides a direct means to validate (4.4) experimentally if the relevant underlying parameters are known or can be measured; and an indirect means to deduce the shape of the daughter distribution if the evolution of the bubble-size distributions can be quantitatively obtained.
Evolution of bubble-size distribution  $N$ (b and d) and local power-law slope
 $\tilde {\beta }$ (a and c) as measured at
 $a_{max}/a=3$ (a and b) and
 $a_{max}/a=10$ (c and d). Numerical simulations of case A (- - - -) and MC simulations (——–) of cases B–F (cf. table 1). Colours based on
 $\gamma$: green,
 $\gamma =-5$; red,
 $\gamma =-10/3$; blue,
 $\gamma =-5/3$; magenta,
 $\gamma =0$; black,
 $\gamma =\infty$ (single-radius injection). Note that
 $\tilde {\beta }(t\ll \tau _c)$ is not reported for MC simulations of
 $\gamma =\infty$ due to significant noise.

We make two comments on (4.4). First, although we consider power-law injection rather than single-radius injection, the dependence of  $\tau _c$ on
 $m$ (disregarding
 $C_f$) is similar to the equation (1.3) proposed by Deike et al. (Reference Deike, Melville and Popinet2016). For
 ${\textit {We}}=\infty$ and small
 $m$,
 $c_{\infty ,m}=1-1/(m^{-1/3}-1)$
 $\sim$
 $(9/2)(\ln m)^{-1}$. Considering a more typical
 $a_H/a_{max}\approx 10$, for binary breakup (
 $m=2$) the coefficient for
 $\tau _c$ in (4.4) is
 $(9/2)(\ln 2)^{-1}\approx 6.5$, and for tertiary breakup (
 $m=3$) the coefficient is
 $(9/2)(\ln 3)^{-1}\approx 4.1$. These values compare well with those obtained from the simulations of Deike et al. (Reference Deike, Melville and Popinet2016). Second, the value of
 $C_f$ provides a new quantification of the dependence of
 $\tau _c$ on
 $f_V^*$ first described by Qi et al. (Reference Qi, Mohammad Masuk and Ni2020): the closer a daughter distribution is to identical fragmentation, the faster the convergence to equilibrium. Through
 $C_f$, observed convergence times now provide a mechanism to evaluate daughter distributions.
We compare  $\tau _c$ to the time scale of entrainment by breaking waves. In laboratory experiments by Deane & Stokes (Reference Deane and Stokes2002),
 $\varepsilon \approx 13$W kg
 $^{-1}$ and
 $a_{max}\approx 10$ mm. The reported time period for entrainment was
 $T_E\approx 1$ s. For illustration, using
 $C_f=1.5$ and
 $m=2$ yields
 $\tau _c\approx 0.5$ s, and thus
 $T_E/\tau _c\approx 2$. This suggests the bulk bubble-size distribution observed by Deane & Stokes (Reference Deane and Stokes2002) at the end of
 $T_E$ would have approached
 $N_{eq}$. The fast convergence of
 $N$ and
 $\tilde {\beta }$ demonstrates that fragmentation quickly obscures the effect of entrainment. In fact, although initially
 $\tilde {\beta }(a,0)=\gamma$,
 $\tilde {\beta }(a,t)$ approaches
 $\tilde {\beta }_{eq}(a)$ approximately exponentially. Thus, even for
 $t\ll \tau _c$,
 $\tilde {\beta }(a,t)$ does not give a reliable measure of
 $\gamma$. Therefore, the commonly observed
 $\beta \approx -10/3$ for
 $a>a_H$ should only be considered evidence of
 $\gamma \geq -4$, not of
 $\gamma =-10/3$ (Yu et al. Reference Yu, Hendrickson and Yue2020). As neither
 $\tilde {\beta }_{eq}(a)$ (cf. § 3) nor
 $\tilde {\beta }(a,t)$ provides reliable insight into
 $\gamma$ for weak injection, further investigation of
 $I(a)$ will likely require new experimental and computational techniques near the free surface to allow direct identification and measurement of entraining bubbles.
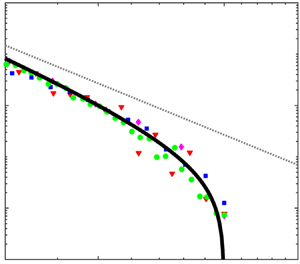
5. Steepening of size distribution due to fragmentation and entrainment
It has been previously noted (Deike et al. Reference Deike, Melville and Popinet2016) that bubble-size distributions deviate from a power law and become steeper for  $a$ around
 $a_{max}$. Figure 3 shows bubble-size distributions from experiments and computational fluid dynamics simulations (scaled by
 $a_{max}$) of different entraining flows that exhibit such steepening. The distributions generally agree for
 $a \lesssim a_{max}$, but are not expected to be good for
 $a$ near
 $a_H$ (different values of
 $a_H/a_{max}$ for the data are listed in the figure caption). As large bubbles rise faster (Thorpe Reference Thorpe1982), the steepening for
 $a$ around
 $a_{max}$ has generally been attributed to degassing (Deike et al. Reference Deike, Melville and Popinet2016; Chan et al. Reference Chan, Johnson, Moin and Urzay2021). Garrett et al. (Reference Garrett, Li and Farmer2000) and Deike et al. (Reference Deike, Melville and Popinet2016) provided models for steepening due to degassing, also shown in figure 3.
Comparison of  $N_{eq}$ prediction from (3.8) (
 $\gamma =-10/3$) (——-) with existing theories: - - -, equation (3.7) of Deike et al. (Reference Deike, Melville and Popinet2016);
 $\cdot\ \cdot\ \cdot\ \cdot\ \cdot\ \cdot$,
 $\propto a^{-16/3}$ (Garrett et al. Reference Garrett, Li and Farmer2000). Experiments: (i)
 $\square$ (blue), figure 5 of Deane et al. (Reference Deane, Stokes and Callaghan2016), case A. Simulations: (ii)
 $\triangledown$ (red), figure 7(e) of Deike et al. (Reference Deike, Melville and Popinet2016); (iii)
 $\diamond$ (magenta), figure 8 of Hendrickson et al. (Reference Hendrickson, Yu and Yue2020),
 ${\textit {Fr}}=0.192$; (iv)
 $\circ$ (green), figure 4d of Chan et al. (Reference Chan, Johnson, Moin and Urzay2021). Values for
 $a_H/a_{max}$ are approximately
 $0.35$,
 $0.15$,
 $0$,
 $0.15$ respectively for (i), (ii), (iii), (iv).

Because of the fast convergence discussed in § 4, we expect to observe  $\tilde {\beta }_{eq}(a)$ given by (3.8) during active entrainment. In figure 3, we include
 $\tilde {\beta }_{eq}(a)$ using
 $\gamma =-10/3$ (Yu et al. Reference Yu, Hendrickson and Yue2020). Note that the shape does not change significantly with moderate variation of
 $\gamma$. From figure 3, we see that (3.8) exhibits the steepening of the bubble-size distribution for
 $a\sim a_{max}$, somewhat corroborated by existing measurements and simulations. Since (3.8) accounts only for fragmentation and cutoff power-law entrainment, this reveals a new mechanism for steepening deviation from a power law independent of other mechanisms such as degassing. The relative importance of these different mechanisms is a subject of current research.
6. Conclusion
We have developed a population balance model for a fragmentation cascade driven by steady injection  $I(a)$, described by power-law slope
 $\gamma$ and large-radius cutoff
 $a_{max}$. Where previous work has either considered fragmentation (Garrett et al. Reference Garrett, Li and Farmer2000) or power-law entrainment (Yu et al. Reference Yu, Hendrickson and Yue2020), this approach allows us to study the interaction between the two and its effect on the equilibrium and evolution of bulk bubble-size distributions for large bubbles in air-entraining bubbly flow.
We first seek the equilibrium bulk bubble-size distribution  $N_{eq}(a)$. We describe its shape using a local power-law slope
 $\tilde {\beta }_{eq}(a)$, which we find is dependent on
 $a_{max}$ and
 $\gamma$. As previously observed (Qi et al. Reference Qi, Mohammad Masuk and Ni2020),
 $\tilde {\beta }_{eq}(a)$ does not depend on the choice of fragmentation daughter distribution. We identify two regimes of injection: weak injection for
 $\gamma \ge -4$, with
 $\tilde {\beta }_{eq}(a\ll a_{max})=-10/3$, and strong injection for
 $\gamma <-4$, with
 $\tilde {\beta }_{eq}(a\ll a_{max})=\gamma +2/3$. For weak injection,
 $\tilde {\beta }_{eq}=-10/3$ agrees with power-law slope
 $\beta =-10/3$ commonly observed for
 $a>a_H$, providing a generalized explanation which builds on that proposed by Garrett et al. (Reference Garrett, Li and Farmer2000). The independence of
 $\tilde {\beta }_{eq}$ on
 $\gamma$ in the weak regime suggests that the observed (equilibrium) slope
 $\beta =-10/3$ may result from different underlying (weak) entrainment mechanisms.
We show that the time scale to reach the equilibrium distribution  $N_{eq}(a)$ (after initiation of entrainment) is given by
 $\tau _c \propto C_f\, \varepsilon ^{-1/3} {a_{max}}^{2/3}$, where
 $C_f$ is a constant expressing the effect of the fragmentation daughter distribution. The latter can thus be elucidated by quantifying
 $\tau _c$ (using figure 2, for example). For small
 $\tau _c$, the bulk bubble-size distribution rapidly evolves away from the initial distribution
 $N(a,0) \propto I(a)$; thus the mechanism of the entrainment itself might not be accessible from bulk measurements. Finally, we show that the reported steepening deviation of
 $N_{eq}(a)$ from a power law for
 $a$ around
 $a_{max}$ happens due to interaction between entrainment and fragmentation alone, even in the absence of mechanisms such as degassing.
Funding
This work was funded by the U.S. Office of Naval Research grant N00014-20-1-2059 under the guidance of Dr W.-M. Lin. The computational resources were funded through the Department of Defense High Performance Computing Modernization Program.
Declaration of interest
The authors report no conflict of interest.



