1. Introduction
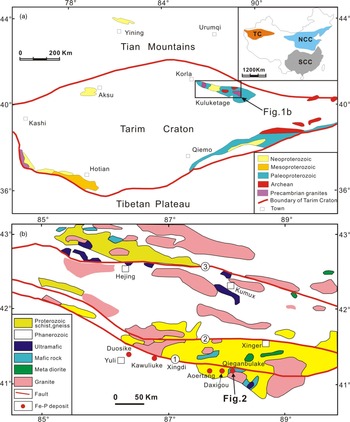
The Tarim Craton (TC), which is considered one of the three major cratonic blocks in China (North China, Tarim and Yangtze), is located in northwestern China (Fig. 1a). The Kuluketage block, located in the northeastern TC, is one of the largest Precambrian blocks (Fig. 1b). During the past 50 years, many geological and ore-deposit investigations have led to the discovery of skarn Cu–Mo deposits (e.g. Dapingliang), a porphyry Cu–Au deposit (Qiongtage) and magmatic Fe–P–(Ti) oxide deposits (e.g. Kawuliuke, Daxigou) (Chen, Reference Chen1989; Feng et al. Reference Feng, Zhou, Chi, Yang, Zhong and Ye1995; Li et al. Reference Li, Xie, Chang, Cai, Zhu and Zhou1998; Yuan et al. Reference Yuan, Pan and Qian2002; Sun & Huang, Reference Sun and Huang2007; Xia et al. Reference Xia, Yuan, Xi, Yan and Han2009, Reference Xia, Xi, Yuan and Luang2011, Reference Xia, Tan, Yang, Yuan, Luang and Xi2012; Cao et al. Reference Cao, Lü, Liu, Zhang, Gao, Chen and Mo2011, Reference Cao, Wang, Lü, Yuan, Wang, Liu and Shen2015; Ye et al. Reference Ye, Li and Lan2013; Yuan et al. Reference Yuan, Lü, Cao, Wang, Yang and Liu2013, Reference Yuan, Cao, Lü, Wang, Yang, Liu, Ruan, Liu and Abdalla Adama2014, Reference Yuan, Zhang, Cheng, Cao, Needham, Zheng and Lü2022; Han et al. Reference Han, Xiao, Su, Sakyi, Ao, Zhang, Wan, Song and Wang2016; Chen et al. Reference Chen, Lü, Cao, Yuan and Wang2019 b, Reference Chen, Lü, Yuan, Huang and Cao2022). Among those deposits, the Fe–P–(Ti) oxide deposits (Kawuliuke, Qieganbulake, Aoertang, Daxigou and Duosike) were discovered in the southern Kuluketage block along the Xingdi fault (Fig. 1b), hosted in layered mafic–ultramafic–carbonatite complexes (Xia et al. Reference Xia, Tan, Wu, Li, Yuan and Xi2008, Reference Xia, Xi, Yuan and Luang2011; Yuan et al. Reference Yuan, Lü, Cao, Wang, Yang and Liu2013, Reference Yuan, Zhang, Cheng, Cao, Needham, Zheng and Lü2022; Cao et al. Reference Cao, Wang, Lü, Yuan, Wang, Liu and Shen2015; Han et al. Reference Han, Xiao, Su, Sakyi, Ao, Zhang, Wan, Song and Wang2016; Chen et al. Reference Chen, Lü, Cao, Yuan and Wang2019 b, Reference Chen, Lü, Yuan, Huang and Cao2022; W. Chen, unpub. Ph.D. thesis, China Univ. Geosciences, 2021). However, most of the documentation of these Fe–P–(Ti) oxide deposits has been reported in the Chinese literature, for which reason the international geological community knows little about these deposits until now.
(a) Tectonic framework of the TC and adjacent areas (after Wu et al. Reference Wu, Xiao, Bonin, Ma, Li and Zhu2018). NCC – North China Craton; SCC – South China Craton; TC – Tarim Craton. (b) Regional geological map of the Kuluketage area in northeastern Tarim (after Shu et al. Reference Shu, Deng, Zhu, Ma and Xiao2011; Han et al. Reference Han, Xiao, Su, Sakyi, Ao, Zhang, Wan, Song and Wang2016), showing the Fe–P–Ti oxide deposits. 1 – the Xingdi fault forming the southern boundary of the Kuluketage domain; 2 – the Korla Xinger fault forming the northern boundary of the Kuluketage domain; 3 – the Kumux–Hejing fault between the Palaeozoic central Tianshan and southern Tianshan belts.

The Qieganbulake deposit is not only the world’s second-largest vermiculite deposit, but also a medium-size carbonatite-related phosphate deposit (Chen, Reference Chen1989; Yin, Reference Yin1992; Huang et al. Reference Huang, Sun, Gu, Wang and Cao2001, Reference Huang, Wu, Lei, Chen, Xiong, Qin and Gu2012; Zhou et al. Reference Zhou, Sun, Wang, Zhang, Zhang, Wang and Liao2012; Chen et al. Reference Chen, Lü, Cao, Yuan and Wang2019 b; W. Chen, unpub. Ph.D. thesis, China Univ. Geosciences, 2021). A large number of field investigations and research studies have focused on the Qieganbulake vermiculite ores and Qieganbulake mafic–ultramafic–carbonatite complex (QMC) (Chen, Reference Chen1989; Huang et al. Reference Huang, Sun, Gu, Wang and Cao2001, Reference Huang, Wu, Lei, Chen, Xiong, Qin and Gu2012; Jiang et al. Reference Jiang, Lu, Bai, Zhang, Ye, Feng and Chen2005; Sun & Huang, Reference Sun and Huang2007; Zhang et al. Reference Zhang, Li, Li, Lu, Ye and Li2007; Fu et al. Reference Fu, Q, Li and J2013; Han et al. Reference Han, Xiao, Su, Sakyi, Ao, Zhang, Wan, Song and Wang2016; Q. Yuan, unpub. Ph.D. thesis, China Univ. Geosciences, 2016), but the petrogenesis and origin of the QMC are still disputed, and the metallogenic mechanism of the carbonatite-related phosphate ore has never been discussed. Previous research highlighted an important debate about the origin of the QMC: it was either derived from the partial melting of enriched-mantle sources (Jiang et al. Reference Jiang, Lu, Bai, Zhang, Ye, Feng and Chen2005; Huang et al. Reference Huang, Wu, Lei, Chen, Xiong, Qin and Gu2012; Fu et al. Reference Fu, Q, Li and J2013; Q. Yuan, unpub. Ph.D. thesis, China Univ. Geosciences, 2016) or the ‘primitive’ mantle components played an important role in its origin (Huang et al. Reference Huang, Sun, Gu, Wang and Cao2001; Sun & Huang, Reference Sun and Huang2007; Zhang et al. Reference Zhang, Li, Li, Lu, Ye and Li2007; Han et al. Reference Han, Xiao, Su, Sakyi, Ao, Zhang, Wan, Song and Wang2016). In addition, there are three major hypotheses for the formation process of the QMC, namely, liquid immiscibility of the parental magma (Fu et al. Reference Fu, Q, Li and J2013; Q. Yuan, unpub. Ph.D. thesis, China Univ. Geosciences, 2016), fractional crystallization of the parental magma (Sun & Zhou, Reference Sun and Zhou2008; Huang et al. Reference Huang, Wu, Lei, Chen, Xiong, Qin and Gu2012; Han et al. Reference Han, Xiao, Su, Sakyi, Ao, Zhang, Wan, Song and Wang2016) or multi-stage magma intrusion (Chen, Reference Chen1989; Huang et al. Reference Huang, Sun, Gu, Wang and Cao2001; Zhang et al. Reference Zhang, Li, Li, Lu, Ye and Li2007). It is noteworthy that previous studies of the QMC relied predominantly on bulk whole-rock geochemical and isotopic analyses. Bulk analyses provide an integrated, average composition of rocks, and are less sensitive at distinguishing sources and petrogenetic processes (e.g. magma mixing or crustal contamination). In this study, we carried out an integrated investigation of whole-rock major and trace elements, in situ zircon Hf isotopes, in situ zircon and apatite U–Pb dating, in situ apatite geochemistry and Sr–Nd isotopes, in situ silicate mineral geochemistry, in situ pyrite and chalcopyrite S isotopes as well as whole-rock Sr–Nd isotopes for the QMC and carbonatite-related phosphate ores, with aims to: (1) precisely date the different rock types and provide robust constraints on their temporal relationships, (2) characterize the nature of their mantle sources, (3) shed new light on the petrogenesis of the complex, in particular, the genetic relationships between the carbonatites and associated silicate rocks, and (4) clarify the metallogenic mechanism of the carbonatite-related phosphate ores.
2. Geological background
The TC records the Precambrian evolutionary history of NW China (Lu et al. Reference Lu, Li, Zhang and Niu2008 a; Zhao & Cawood, Reference Zhao and Cawood2012), which covers an area of 530 000 km2. The Kuluketage block is located in the northeastern TC (Fig. 1a). This block preserves the Precambrian basement, which comprises Archaean, Palaeoproterozoic, Mesoproterozoic and lower Neoproterozoic lithologies, and a middle Neoproterozoic to Phanerozoic sedimentary cover (Fig. 1b; Gao et al. Reference Gao, Chen, Lu, Peng and Qin1993; Cheng, Reference Cheng1994; Feng et al. Reference Feng, Zhou, Chi, Yang, Zhong and Ye1995; Lu et al. Reference Lu, Li, Zhang and Niu2008 a,b). Precambrian magmatic activities were pulsed, and magmatic rocks are widely distributed in the Kuluketage block (Cao et al. Reference Cao, Lü, Lei, Chen, Wang, Du, Mei, Gao and Du2010; Zhang et al. Reference Zhang, Zou, Wang, Li and Ye2012 b; Ge et al. Reference Ge, Zhu, Wilde and He2014 a,b; Q. Yuan, unpub. Ph.D. thesis, China Univ. Geosciences, 2016; Chen et al. Reference Chen, Lü, Cao and Ai2019 a). Archaean rocks are well exposed to the north of the Kuluketage block. The oldest rocks are known as the Tuoge complex derived from tonalite–trondhjemite–granodiorite (TTG)-type granites, which yielded a zircon multigrain U–Pb thermal ionization mass spectrometry (TIMS) age of 2582 ± 11 Ma and a Pb–Pb zircon evaporation age of 2488 ± 10 Ma (Lu, Reference Lu1992). The latest sensitive high-resolution ion microprobe (SHRIMP) and laser ablation inductively coupled plasma mass spectrometry (LA-ICP-MS) geochronology studies have shown that the 2.65–2.53 Ga TTG rocks and K-rich granites are widely distributed (Hu & Wei, Reference Hu and Wei2006; Long et al. Reference Long, Yuan, Sun, Xiao, Zhao, Zhou, Wang and Hu2011 b; Shu et al. Reference Shu, Deng, Zhu, Ma and Xiao2011; Zhang et al. Reference Zhang, Li, Santosh, Li, Zou, Wang and Ye2012 a). Palaeoproterozoic metamorphic rocks are also widespread in the Kuluketage block and are known as the Xingditage Group. This group is mainly distributed in the western Kuluketage block and consists of older metamorphic mafic rocks, felsic intrusions and high-grade metamorphic supracrustal rocks. Mesoproterozoic to early Neoproterozoic granitoids and diabasic dykes are widespread in the area (Feng et al. Reference Feng, Zhou, Chi, Yang, Zhong and Ye1995; Lu et al. Reference Lu, Li, Zhang and Niu2008 a,b). Middle Neoproterozoic to Phanerozoic rocks consist of lower mafic dyke swarms, bimodal intrusions, bimodal volcanic rocks and granitoids (Zhang, C. L. et al. Reference Zhang, Li, Li, Lu, Ye and Li2007, Reference Zhang, Li, Li and Ye2009; Xu et al. Reference Xu, Kou, Song, Wei and Wang2008, Reference Xu, Xiao, Zou, Chen, Li, Song, Liu, Zhou and Yuan2009, Reference Xu, Zou, Chen, He and Wang2013; Zhu et al. Reference Zhu, Zhang, Shu, Lu, Sun and Yang2008; Long et al. Reference Long, Yuan, Sun, Kröner, Zhao, Wilde and Hu2011 a; Cao et al. Reference Cao, Lü and Gao2012; Ge et al. Reference Ge, Zhu, Zheng, Wu, He and Zhu2012; Han et al. Reference Han, Xiao, Su, Sakyi, Ao, Zhang, Wan, Song and Wang2016; Chen et al. Reference Chen, Chen, Ripley, Li, Deng, Yue, Zheng and Fu2017, Reference Chen, Lü, Cao and Ai2019 a). A diverse set of Neoproterozoic magmatic rocks have been documented in the Kuluketage block, including: (1) c. 1000–860 Ma metamorphic rocks; (2) c. 840–810 Ma mafic–ultramafic–carbonatite complexes; (3) c. 810 Ma and 760–730 Ma bimodal intrusive complexes; (4) c. 830–735 Ma voluminous granitoids; (5) c. 810 Ma, 760–735 Ma and 650–630 Ma mafic dykes; and (6) c. 735 Ma volcanic rocks (Cao et al. Reference Cao, Lü, Liu, Zhang, Gao, Chen and Mo2011; Zhu et al. Reference Zhu, Zheng, Shu, Ma, Wan, Zheng, Zhang and Zhu2011; Zhang et al. Reference Zhang, Zou, Wang, Li and Ye2012 b; Lü, Reference Lü2017; Chen et al. Reference Chen, Lü, Cao and Ai2019 a,b).
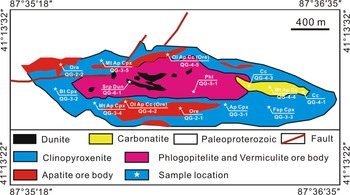
The mafic–ultramafic rocks in the Kuluketage area are mainly distributed along the south of the Xingdi fault. Luo et al. (Reference Luo, Yang, Zhu, Luo and Zhang1998) divided the mafic–ultramafic rocks along the Xingdi fault into two rock belts according to their spatial distribution, petrology, formation age and metallogenic specificity. Among them, the mafic–ultramafic complexes (c. 760–735 Ma) in the southern rock belt of the Xingdi fault were formed in a continental rift setting and were derived from enriched mantle or metasomatized continental lithospheric mantle, with the metallogenic specificity of Cu–Ni sulfide deposits (Zhang et al. Reference Zhang, Yang, Wang, Takahashi and Ye2011; Wang, Reference Wang2012; Qin, Reference Qin2012; Cao et al. Reference Cao, Lü and Gao2012, Reference Cao, Wang, Lü, Yuan, Wang, Liu and Shen2015). The mafic–ultramafic–carbonatite complexes (c. 840–810 Ma) in the northern rock belt of the Xingdi fault were the products of the differentiation of mantle-derived alkaline olivine basaltic magma and carbonatitic magma related to mantle plume activities, with the metallogenic specificity of Fe–P–(Ti) oxide deposits (e.g. Kawuliuke, Qieganbulake) (Fig. 1b; Cao et al. Reference Cao, Lü and Gao2012, Reference Cao, Wang, Lü, Yuan, Wang, Liu and Shen2015; Xia et al. Reference Xia, Tan, Yang, Yuan, Luang and Xi2012; Yuan et al. Reference Yuan, Lü, Cao, Wang, Yang and Liu2013; Han et al. Reference Han, Xiao, Su, Sakyi, Ao, Zhang, Wan, Song and Wang2016; Chen et al. Reference Chen, Lü, Cao, Yuan and Wang2019 b, Reference Chen, Lü, Yuan, Huang and Cao2022). Among those discovered Fe–P–(Ti) oxide deposits, only the Qieganbulake deposit contains carbonatites (Ye et al. Reference Ye, Li and Lan2013; Q. Yuan, unpub. Ph.D. thesis, China Univ. Geosciences, 2016; Chen et al. Reference Chen, Lü, Cao, Yuan and Wang2019 b). The Qieganbulake vermiculite–apatite deposit is located in Yuli County, c. 200 km southeast of Korla City, Xinjiang Province (Fig. 1b). The QMC occurs as an elliptical, concentrically zoned structure elongated within an WNW–ESE fracture (Fig. 2), with a total exposed area of 1.5 km2 (Chen, Reference Chen1989; Sun & Huang, Reference Sun and Huang2007; Ye et al. Reference Ye, Li and Lan2013). Rocks present in the QMC are mainly carbonatite, dunite, clinopyroxenite and phlogopitelite (Chen, Reference Chen1989; Huang et al. Reference Huang, Sun, Gu, Wang and Cao2001, Reference Huang, Wu, Lei, Chen, Xiong, Qin and Gu2012; Zhang et al. Reference Zhang, Li, Li, Lu, Ye and Li2007; Ye et al. Reference Ye, Li and Lan2013). The curved and crenellated borders among these rocks suggest that they were in a molten state during emplacement (Ye et al. Reference Ye, Li and Lan2013; Q. Yuan, unpub. Ph.D. thesis, China Univ. Geosciences, 2016; W. Chen, unpub. Ph.D. thesis, China Univ. Geosciences, 2021). Vermiculite ores in the Qieganbulake deposit are mainly hosted in clinopyroxenite and serpentinized dunite, while phosphate ores with minor Fe–Ti oxide mineralization are mainly hosted in carbonatite (Huang et al. Reference Huang, Wu, Lei, Chen, Xiong, Qin and Gu2012; Zhou et al. Reference Zhou, Sun, Wang, Zhang, Zhang, Wang and Liao2012; Yuan, 2016; Chen et al. Reference Chen, Lü, Cao, Yuan and Wang2019 b).
Simplified geological map of the Qieganbulake vermiculite–apatite deposit (after Yin, Reference Yin1992), showing the sample locations and sample types. Ap Cpx – apatite-bearing clinopyroxenite; Bt Cpx – biotite-bearing clinopyroxenite; Cc – carbonatite; Ol Ap Cc – olivine- and apatite-bearing carbonatite; Mt Ap Cc – magnetite- and apatite-bearing carbonatite; Phl – phlogopitelite; Fsp Cpx – feldspar-bearing clinopyroxenite; Srp Dun – serpentinized dunite.

3. Geology of the Qieganbulake deposit
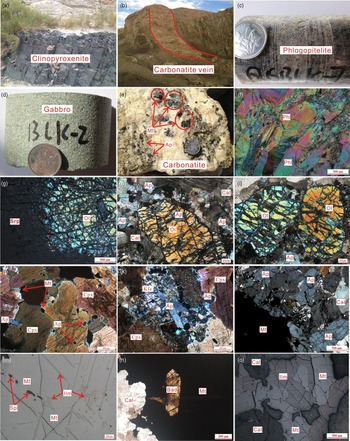
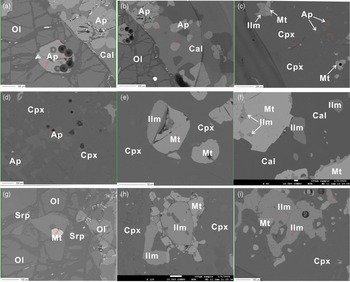
Different rock types of the QMC are shown in Figure 3. The clinopyroxenite (Fig. 3a), cropping out mainly at the outer part of the QMC and constituting ∼40 % of the total complex, includes apatite-bearing clinopyroxenite, biotite-bearing clinopyroxenite, coarse-grained phlogopite clinopyroxenite, feldspar- and/or apatite-bearing clinopyroxenite, minor magnetite- and apatite-bearing clinopyroxenite, and coarse-grained clinopyroxenite. Rock-forming minerals include 65–90 % cumulus clinopyroxene, 3–25 % phlogopite, 10–15 % feldspar, 1–15 % apatite and 1–5 % Fe–Ti oxides (magnetite and ilmenite) (Fig. 3j, k), with a few per cent of titanite, biotite, zircon and rutile. The euhedral to subhedral magnetite, ilmenite and apatite grains of 100–500 μm in length from the apatite- and/or magnetite-bearing clinopyroxenite mainly occupy the interstitial regions between clinopyroxene crystals (Fig. 4d, h, i), and a few of them are enclosed in clinopyroxene crystals (Fig. 4c, i). The dunite, accounting for ∼15 % of the complex and mainly cropping out in the central complex, is strongly serpentinized and vermiculized. The least-metasomatized part is deep green or brown in colour with a fibriform network or replacement textures. It is composed of 70–90 % fibriform serpentinite, 0–15 % serpentinophite and 1–10 % magnetite with minor olivine, diopside and phlogopite. Residual olivine can be observed in the thin-sections (Fig. 3g). The phlogopitelite, accounting for ∼5 % of the complex, consists almost entirely of cumulus phlogopite (Fig. 3c, f). The gabbro (Fig. 3d), accounting for ∼3 % of the complex, is made up of 30–40 % clinopyroxene, 40–50 % plagioclase and minor biotite and magnetite. The carbonatite (Fig. 3b), accounting for ∼15 % of the complex, crops out mainly as veins or lumps of 0.5–20 m × 2.5–40 m. It has a typical coarse-grained granular texture (Fig. 3e), consisting of calcite carbonatite, apatite-bearing carbonatite, olivine- and apatite-bearing carbonatite, magnetite- and apatite-bearing carbonatite and subordinate dolomitic carbonatite with 75–90 % calcite, 1–5 % dolomite, 1–2 % olivine, 1–10 % Fe–Ti oxides and 1–20 % apatite (Fig. 3h, i). Accessory minerals include baddeleyite (Fig. 3n), rutile and phlogopite. Calcite grains show banded structures with Fe–Ti oxides and apatite clusters (Fig. 3e).
Geological features of the Qieganbulake vermiculite–apatite deposit. (a) Clinopyroxenite intruded into Palaeoproterozoic formations. (b) Carbonatite veins intruded into Palaeoproterozoic formations. (c) Phlogopitelite; (d) gabbro; and (e) disseminated carbonatite-related phosphate ore. Photomicrographs of (f) phlogopitelite; (g) serpentinized dunite; (h) apatite and olivine grains enclosed in calcite crystals; (i) olivine grains enclosed in calcite crystals; (j) apatite- and magnetite-bearing clinopyroxenite, with apatite grains enclosed in clinopyroxene crystals; (k) apatite-bearing clinopyroxenite; (l) disseminated phosphate ore; (m) ilmenite and spinel crystals dissolved in magnetite crystal; (n) baddeleyite grain enclosed in magnetite crystal of carbonatite; (o) ilmenites symbiotic with magnetites in the form of lamellae crystals. Cpx – clinopyroxene; Pl – plagioclase; Ol – olivine; Phl – phlogopite; Srp – serpentine; Cal – calcite; Mt – magnetite; Ap – apatite; Ilm – ilmenite; Spl – spinel; Bad – baddeleyite. Diameter of the coin for scale is 19 mm.

Textural relationships between apatite and/or magnetite-bearing clinopyroxenites and disseminated ores from the QMC. (a) Apatite grain is enclosed in olivine, and apatite grains display typical cumulate texture. (b) Apatite grains are enclosed in calcite crystals. (c) Apatite grains are enclosed in clinopyroxene crystals, with the symbiotic texture of magnetite and ilmenite. (d) Apatite grains occupy the interstitial regions between clinopyroxene crystals. (e) Magnetite and ilmenite grains are enclosed in clinopyroxene crystals, with the symbiotic texture of magnetite and ilmenite. (f) Magnetite and ilmenite grains occupy the interstitial regions between calcite crystals, and magnetite and ilmenite grains are enclosed in calcite crystals. (g) Magnetite grain is enclosed in olivine crystal. (h) Magnetite and ilmenite grains occupy the interstitial regions between clinopyroxene crystals. (i) Magnetite and ilmenite grains occupy the interstitial regions between clinopyroxene crystals, and magnetite and ilmenite grains are enclosed in clinopyroxene crystals. Cpx – clinopyroxene; Ol – olivine; Srp – serpentine; Cal – calcite; Mt – magnetite; Ap – apatite; Ilm – ilmenite.

At present, 20 phosphate orebodies have been explored, and they are 100–900 m in length and 20–54 m in width, with a stretch of more than 400 m. The phosphate orebodies are spindle shaped as a whole, and a single orebody is lenticular in the plane (Fig. 2). Two ore types, massive and disseminated structure ores, are recognized. The mineralization mainly consists of apatite with minor Fe–Ti oxides. Apatite grains from the disseminated ores are mainly enclosed in calcite crystals displaying a typical cumulate texture (Figs 3l, 4a), and a few of them are enclosed in olivine crystals (Fig. 4a, b). Apatite crystals from the ores are euhedral to subhedral, ranging from 0.2 to 2.0 cm. There are two crystal shapes of ilmenites in the ores: one is symbiotic with magnetite in the form of lamellae crystals (Fig. 3o), and the other is in the form of sub-solid phase dissolved crystals in magnetite (Fig. 3m). Fe–Ti oxides and apatite crystals are mainly symbiotic or show an intergrowth texture in the form of mineral aggregates (Fig. 3e, l). Magnetite and ilmenite crystals from the disseminated ores mainly occupy the interstitial regions between calcite crystals (Figs 3o, 4f), and a few of them are enclosed in olivine and calcite crystals (Fig. 4f–g). In this study, apatite-bearing carbonatites with P2O5 content greater than 3.4 wt % are considered as phosphate ores, and those with P2O5 content less than 3.4 wt % are only considered as carbonatitic rocks.
4. Analytical techniques and samples
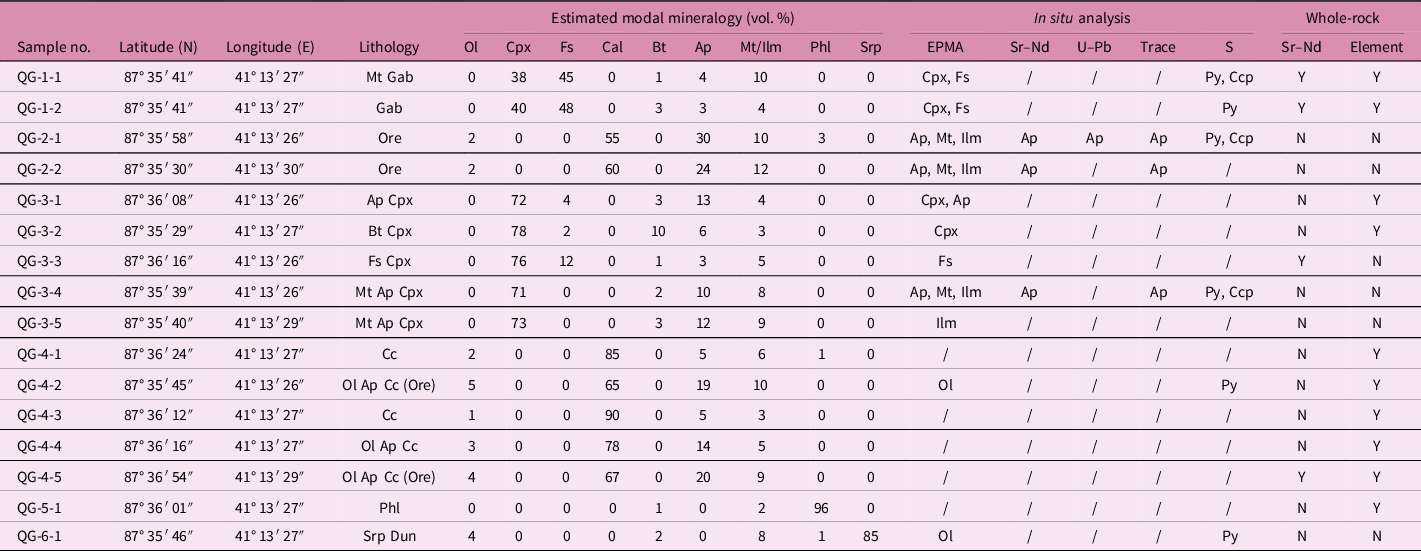
In this study, we have selected 15 unaltered or least altered samples from the Qieganbulake complex. Most samples were collected from the outcrop of the QMC, and only three samples were collected from a drilled borehole (borehole number ZK18-1), all of which were completed by surface sampling. Their locations are indicated in Figure 2, and coordinates are reported in Table 1. The exposed portions and weathered surfaces of the samples were carefully removed, and polished thin-sections were made from all samples.
Samples and brief description

Ol – olivine; Cpx – clinopyroxene; Fs – feldspar; Cal – calcite; Bt – biotite; Ap – apatite; Mt – magnetite; Ilm – ilmenite; Phl – phlogopite; Srp – serpentine; EPMA – electron-probe microanalysis; Ap Cpx – apatite-bearing clinopyroxenite; Bt Cpx – biotite-bearing clinopyroxenite; Cpx – clinopyroxenite; Cc – carbonatite; Ol Ap Cc – olivine- and apatite-bearing carbonatite; Mt Ap Cpx – magnetite- and apatite-bearing clinopyroxenite; Mt Gab – magnetite-bearing gabbro; Gab – gabbro; Phl – phlogopitelite; Fs Cpx – feldspar-bearing clinopyroxenite; Ol Ap Cc – olivine- and apatite-bearing carbonatite; Srp Dun – serpentinized dunite; N – no; Y – yes.
4.a. In situ zircon U–Pb isotope and trace-element analysis
The gabbro sample (QG-1) was selected for zircon U–Pb dating, and was collected from the exploration drillhole (ZK18-1, 145 m) of the QMC. Zircon grains were separated from the sample by conventional magnetic and density techniques at the laboratory of the Langfang Regional Geological Survey Institute in Hebei Province, China. Then, the prepared zircon grains were handpicked, embedded in epoxy resin and polished to expose the grain centres. Zircons that were free of visible inclusions and fractures were selected for cathodoluminescence (CL) imaging in the electron microprobe laboratory at the State Key Laboratory of Geological Processes and Mineral Resources (GPMR), China University of Geosciences (CUG), Wuhan. Measurements of U, Th and Pb isotopes and trace elements in the zircons were performed synchronously by using an LA-ICP-MS at GPMR. Laser sampling was conducted by using a GeoLas 2005 with a beam diameter of 32 μm, and an Agilent 7500a ICP-MS instrument was used to acquire ion-signal intensities. Helium was used as a carrier gas, while argon was used as a makeup gas. The two gases were mixed before entering the ICP. We analysed the standards 91500 and GJ-1 for U–Pb dating and NIST 610 as an external standard for trace-element analyses. Each analysis incorporated a background acquisition of 20 s followed by 60 s of data acquisition from the sample. The detailed work conditions for the laser ablation system and the ICP-MS instrument were described by Liu et al. (Reference Liu, Gao, Hu, Gao, Zong and Wang2010). The software ICPMSDataCal was used for the offline selection and integration of background and analytical signals, and time-drift correction and quantitative calibration were applied for the trace-element analyses and U–Pb dating (Liu et al. Reference Liu, Gao, Hu, Gao, Zong and Wang2010). Concordia diagrams and weighted mean calculations were conducted by using Isoplot version 3.75 (Ludwig, Reference Ludwig2012).
4.b. In situ apatite U–Pb isotope analysis
Apatite grains chosen for radiometric dating were collected from the disseminated phosphate ore sample QG-2-1. The sample analysed in this study was cast on polished sections of the microprobe slice. Before analysis, apatite grains were imaged by CL of a CL8200 MK5 (England) instrument at GPMR. U–Pb geochronology was conducted on the LA-ICP-MS instrument at GPMR. Laser ablation was accomplished using a 193 nm ArF excimer laser (RESOlution-S155), and the ablation protocol employed a spot diameter of 50 μm at 10 Hz repetition rate for 40 s. Helium gas was used as a carrier gas to transport the ablated sample to a Thermo iCAP Qc ICP-MS. During each analysis, the signals of 202Hg, 204(Pb + Hg), 206Pb, 207Pb, 208Pb, 232Th and 238U were collected. The Madagascar apatite (Thomson et al. Reference Thomson, Gehrel, Ruiz and Buchwaldt2012) was used as the external standard to monitor instrumental drift and laser induced elemental fractionation via a ‘standard-sample-standard bracketing’ technique. Apatite is an accessory U-bearing mineral that contains a significant amount of common Pb (Chew et al. Reference Chew, Petrus and Kamber2014). The common Pb correction method adopted in this study was similar to that described in Chen & Simonetti (Reference Chen and Simonetti2013). The common Pb isotopic composition was determined by plotting the uncorrected data on a Tera-Wasserburg diagram. Then it was used to apply a common lead correction to the measured 206Pb/238U ratios. The Tera-Wasserburg diagram and weighted mean 206Pb–238U ages reported here were determined with Isoplot software.
4.c. Electron microprobe major-element measurement
In this study, we chose 13 rock and ore samples from the QMC to analyse the major elements of olivine, pyroxene, feldspar, apatite and Fe–Ti oxides in the thin-sections. Major-element contents of minerals (e.g. olivine, pyroxene, apatite and magnetite) were determined by a JEOL JXA-8230 electron microprobe at the Wuhan Sample Solution Analytical Technology Co., Ltd, Hubei, China. The analyses were performed with the following analytical conditions: an electron beam of 3–5 μm diameter with an accelerating voltage of 20 kV and a probe current of 10 nA. The analyses were refined using the ZAF online correction program.
4.d. Whole-rock major- and trace-element analysis
Five carbonatite and/or ore samples (QG-4-1 to QG-4-5), two clinopyroxenite samples (QG-3-1 to QG-3-2) and one phlogopitelite sample (QG-5-1) selected from the exposed QMC and two gabbro samples (QG-1-1 to QG-1-2, the most evolved rock type within the QMC) selected from the drillhole (ZK18-1) of the QMC were analysed for their major and trace elements. Samples chosen for whole-rock geochemical analysis were trimmed to remove the weathered surfaces, before being crushed and powdered to 200 mesh. Major elements were analysed in a PANalytical Axios X-ray fluorescence spectrometer (XRF) at ALS Chemex (Guangzhou) Co. Ltd. Prior to analysis, a calcined or ignited sample (0.9 g) was added to 9 g of lithium borate flux (50–50 % Li2B4O7–LiBO2), mixed well and fused in an auto-fluxer at between 1050 and 1100 °C. A flat molten glass disc was prepared from the resulting melt; this disc was then analysed via XRF spectrometry. The precision of the XRF analyses at ALS Chemex is better than 5 %.
Trace-element concentrations were determined in an Elan 9000 at the same lab. A prepared sample (0.2 g) was added to lithium metaborate flux (0.9 g), mixed well and fused in a furnace at 1000 °C. The resulting melt was then cooled and dissolved in 100 mL of 4 % HNO3/2 % HCl3 solution. This solution was then analysed via ICP-MS. The precision of the ICP-MS analyses at ALS Chemex is better than 10 % for all elements. Data for whole-rock chemistry are reported as weight per cent (wt %), while trace-element and rare earth element (REE) values are reported in parts per million (ppm).
4.e. Whole-rock Sr–Nd isotope analysis
One carbonatite (ore) sample (QG-4-5), one clinopyroxenite sample (QG-3-3) and two gabbro samples (QG-1-1 to QG-1-2) were analysed for their Sr and Nd isotopes, and the ϵNd(t) and (87Sr/86Sr)i values were calculated at 811 Ma. Sr and Nd isotopic analyses were performed on a Micromass Isoprobe multi-collector (MC)-ICP-MS at the State Key Laboratory of Isotope Geochemistry (SKLIG), Guangzhou Institute of Geochemistry (GIG), Chinese Academy of Sciences (CAS), using analytical procedures described by Li et al. (Reference Li, Li, Wingate, Chung, Liu, Lin and Li2006). Sr was separated using cation columns, and Nd fractions were further separated by HDEHP-coated Kef columns. Measured 87Sr/86Sr and 143Nd/144Nd ratios were normalized to 86Sr/88Sr = 0.1194 and 146Nd/144Nd = 0.7219, respectively. The reported 87Sr/86Sr and 143Nd/144Nd ratios were adjusted to the NBS987 standard 87Sr/86Sr = 0.710262 ± 10 (2σ) and the Shin Etsu JNdi-1 standard 143Nd/144Nd = 0.512101 ± 4 (2σ).
4.f. In situ zircon Hf isotope analysis
In situ Lu–Hf isotopes analyses were conducted on dated zircon grains in a gabbro sample (QG-1) with identical sampling spots to the U–Pb analyses or within the same oscillatory zones. A Neptune Plus MC-ICP-MS (Thermo Fisher Scientific, Germany) equipped with a GeoLas 2005 excimer ArF laser ablation system (Lambda Physik, Göttingen, Germany) was used at GPMR. The sampling-spot size was 44 µm, and the energy density was 15–20 J cm−2 during the analyses. The standards 91500 and GJ-1 were simultaneously analysed (Hu et al. Reference Hu, Liu, Gao, Liu, Zhang, Tong, Lin, Zong, Li, Chen, Zhou and Yang2012). The obtained Hf isotope compositions were 0.282315 ± 0.000014 (1σ) for 91500 and 0.282019 ± 0.000013 (1σ) for GJ-1. The offline selection and integration of analytical signals and mass-bias calibrations were conducted using ICPMSDataCal (Liu et al. Reference Liu, Hu, Gao, Günther, Xu, Gao and Chen2008).
4.g. In situ trace-element analyses of apatite
In this study, we chose three samples, QG-2-1, QG-2-2 and QG-3-4, to analyse the trace elements of apatite in the thin-sections. Trace-element analysis of apatite was conducted by LA-ICP-MS at the Wuhan Sample Solution Analytical Technology Co., Ltd, Wuhan, China. The samples analysed in this study were cast on polished sections of the microprobe slice. Before analysis, apatite grains were imaged by scanning electron microscope. Detailed operating conditions for the laser ablation system and the ICP-MS instrument and data reduction are the same as the description by Zong et al. (Reference Zong, Klemd, Yuan, He, Guo, Shi, Liu, Hu and Zhang2017). Laser sampling was performed using a GeoLasPro laser ablation system that consists of a COMPexPro 102 ArF excimer laser (wavelength of 193 nm and maximum energy of 200 mJ) and a MicroLas optical system. An Agilent 7700e ICP-MS instrument was used to acquire ion-signal intensities. Helium was applied as a carrier gas. Argon was used as the makeup gas and mixed with the carrier gas via a T-connector before entering the ICP. A ‘wire’ signal-smoothing device is included in this laser ablation system (Hu et al. Reference Hu, Zhang, Liu, Gao, Li, Zong, Chen and Hu2015). The spot size and frequency of the laser were set to 44 µm and 5 Hz, respectively, in this study. Trace-element compositions of minerals were calibrated against various reference materials (BHVO-2G, BCR-2G and BIR-1G) without using an internal standard (Liu et al. Reference Liu, Hu, Gao, Günther, Xu, Gao and Chen2008). Each analysis incorporated a background acquisition of ∼20–30 s followed by 50 s of data acquisition from the sample. An Excel-based software ICPMSDataCal was used to perform offline selection and integration of background and analysed signals, time-drift correction and quantitative calibration for trace-element analysis (Liu et al. Reference Liu, Hu, Gao, Günther, Xu, Gao and Chen2008).
4.h. In situ Sr–Nd–S isotope analyses of minerals
In this study, we also chose three samples, QG-2-1, QG-2-2 and QG-3-4, to analyse the Sr–Nd isotopes of apatite in the thin-sections. In situ Sr isotope ratios of apatite were measured by a Neptune Plus MC-ICP-MS (Thermo Fisher Scientific, Bremen, Germany) in combination with a GeoLasHD excimer ArF laser ablation system (Coherent, Göttingen, Germany) at the Wuhan Sample Solution Analytical Technology Co., Ltd, Hubei, China. In the laser ablation system, helium was used as the carrier gas for the ablation cell. For a single laser spot ablation, the spot size and frequency of the laser were set to 90 µm and 8 Hz, and the laser fluence was kept constant at ∼10 J cm−2 in this study. A new signal-smoothing device (Hu et al. Reference Hu, Zhang, Liu, Gao, Li, Zong, Chen and Hu2015) was used downstream from the sample cell to eliminate the short-term variation of the signal. All data reduction for the MC-ICP-MS analysis of Sr–Nd isotope ratios was conducted using Iso-Compass software (Zhang et al. Reference Zhang, Hu and Liu2020). The interference correction strategy was the same as the one reported by Tong et al. (Reference Tong, Liu, Hu, Chen, Zhou, Hu, Xu, Deng, Chen, Yang and Gao2016) and Zhang et al. (Reference Zhang, Hu, Liu, Wu, Deng, Guo and Zhao2018). Following the interference corrections, mass fractionation of Sr isotopes was corrected by assuming 88Sr/86Sr = 8.375209 (Tong et al. Reference Tong, Liu, Hu, Chen, Zhou, Hu, Xu, Deng, Chen, Yang and Gao2016; Zhang et al. Reference Zhang, Hu, Liu, Wu, Deng, Guo and Zhao2018) and applying the exponential law. Two natural apatites, Durango and MAD, were used as the unknown samples for in situ Sr isotope analysis of the apatites. The chemical and Sr isotopic compositions of Durango and MAD have been reported by Yang et al. (Reference Yang, Wu, Yang, Chew, Xie, Chu, Zhang and Huang2014).
In situ Nd isotope analysis was performed on a Neptune Plus MC-ICP-MS (Thermo Fisher Scientific, Bremen, Germany) equipped with a GeoLasHD excimer ArF laser ablation system (Coherent, Göttingen, Germany) at the Wuhan Sample Solution Analytical Technology Co., Ltd, Hubei, China. In the laser ablation system, helium was used as the carrier gas within the ablation cell and was merged with argon (makeup gas) after the ablation cell. For a single laser spot ablation, the spot size and frequency of the laser were set to 90 µm and 8 Hz, and the laser fluence was kept constant at ∼8 J cm−2 in this study. A new signal-smoothing device was used downstream from the sample cell to efficiently eliminate the short-term variation of the signal and remove the mercury from the background and sample aerosol particles (Hu et al. Reference Hu, Zhang, Liu, Gao, Li, Zong, Chen and Hu2015). The Neptune Plus was equipped with nine Faraday cups fitted with 1011 Ω resistors. Isotopes 142Nd, 143Nd, 144Nd, 145Nd, 146Nd, 147Sm, 148Nd and 149Sm were collected in Faraday cups using static mode. The mass discrimination factor for 143Nd/144Nd was determined using 146Nd/144Nd (0.7219) with the exponential law. The 149Sm signal was used to correct the remaining 144Sm interference on 144Nd, using the 144Sm/149Sm ratio of 0.2301. The mass fractionation of 144Sm/149Sm was corrected by 147Sm/149Sm normalization, using the 144Sm/149Sm ratio of 1.08680 and exponential law. All data reduction for the MC-ICP-MS analysis of Nd isotope ratios was conducted using Iso-Compass software (Zhang et al. Reference Zhang, Hu and Liu2020). Two natural apatite megacrysts, Durango and MAD, were used as the unknown samples to verify the accuracy of the calibration method for in situ Nd isotope analysis of the apatites. The chemical and Nd isotopic compositions of Durango and MAD have been reported by Xu et al. (Reference Xu, Hu, Zhang, Yang, Liu and Gao2015).
In this study, we chose six samples, QG-1-1, QG-1-2, QG-2-1, QG-3-4, QG-4-2 and QG-6-1, to analyse the S isotopes of pyrite and chalcopyrite in the thin-sections. In situ sulfur isotope analyses of pyrite and chalcopyrite were performed on a Neptune Plus MC-ICP-MS (Thermo Fisher Scientific, Bremen, Germany) equipped with a GeoLasHD excimer ArF laser ablation system (Coherent, Göttingen, Germany) at the Wuhan Sample Solution Analytical Technology Co., Ltd, Hubei, China. In the laser ablation system, helium was used as the carrier gas for the ablation cell and was mixed with argon (makeup gas) after the ablation cell. The single spot ablation mode was used. Then a large spot size (33 μm) and slow pulse frequency (8 Hz) were used to avoid the downhole fractionation effect that has been reported by Fu et al. (Reference Fu, Hu, Zhang, Yang, Liu, Li, Zong, Gao and Hu2016). One hundred laser pulses were completed in one analysis. A new signal-smoothing device was used downstream from the sample cell to efficiently eliminate the short-term variation of the signal, especially for the slow pulse frequency condition (Hu et al. Reference Hu, Zhang, Liu, Gao, Li, Zong, Chen and Hu2015). The laser fluence was kept constant at ∼5 J cm−2. A standard-sample bracketing method was employed to correct for instrumental mass fractionation. To avoid the matrix effect, a pyrite standard PPP-1 and a chalcopyrite standard GBW07268 (a pressed pellet) were chosen as reference materials for correcting the natural pyrite samples and the natural chalcopyrite samples, respectively. The reference values of δ34Sv-CDT in these standards have been reported by Fu et al. (Reference Fu, Hu, Zhang, Yang, Liu, Li, Zong, Gao and Hu2016). More details of the in situ S isotopic ratio analysis were described in Fu et al. (Reference Fu, Hu, Zhang, Yang, Liu, Li, Zong, Gao and Hu2016). All data reduction for the MC-ICP-MS analysis of the S isotope ratios was conducted using Iso-Compass software (Zhang et al. Reference Zhang, Hu and Liu2020).
5. Analytical results
5.a. Zircon U–Pb age and trace elements
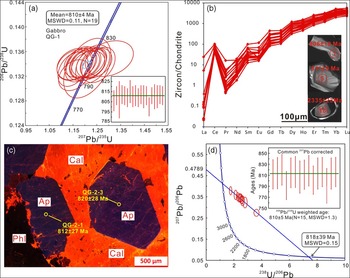
The zircon U–Pb isotope and trace-element analysis results are listed in online Supplementary Material Tables S1 and S2, respectively. Zircon grains in the gabbro sample can be divided into two groups under CL imaging (Fig. 5b). Group A is euhedral, colourless and transparent with a length of 80–110 μm and length-to-width ratios of 1:1–1.2:1. Group A contains 19 grains, which are bright in the CL images with clear oscillatory zoning, indicating their magmatic origin (Andersson et al. Reference Andersson, Miller and Johansson2002; Wu & Zheng, Reference Wu and Zheng2004). In Group A, almost all zircons show low La contents and high (Sm/La)N and Ce/Ce* values (Fig. 5b), which are similar to those of typical magmatic zircons. Distinct positive Ce (Ce/Ce* = 77 on average) anomalies and obvious negative Eu (Eu/Eu* = 0.33 on average) anomalies are also observed. Nineteen analyses on 19 grains with clear oscillatory zoning yielded a group of 206Pb–238U ages ranging from 806 to 812 Ma. This group of ages yielded a weighted mean 206Pb–238U age of 810 ± 4 Ma (MSWD = 0.11, n = 19; Fig. 5a). The measured U, Th and Th/U values for these zircon grains range from 214 to 1005 ppm, from 106 to 748 ppm, and from 0.37 to 0.96, respectively. This weighted mean 206Pb–238U age of 810 ± 4 Ma was interpreted as the crystallization age of the gabbro. Group B contains one zircon grain (QG-1-18), which is characterized by a dark inherited core cut by a newly grown rim in the CL images. One significantly older 207Pb–206Pb age of the dark inherited core is 2335 Ma. This zircon is believed to have been captured from the source area or wall rock.
(a) Zircon U–Pb concordia diagrams and (b) chondrite-normalized (Sun & McDonough, Reference Sun, McDonough, Saunders and Norry1989) zircon REE patterns and cathodoluminescence (CL) images of zircons for the dated gabbro. (c) Photomicrograph of apatite grains imaged by CL, with the circles showing the locations of LA-ICP-MS 206Pb–238U dating. Ap – apatite; Cal – calcite; Phl – phlogopite. (d) Apatite U–Pb concordia diagrams for the dated phosphate ores.

5.b. Apatite U–Pb age
Apatite U–Pb dating results are listed in online Supplementary Material Table S3. Some apatite grains in a disseminated ore sample contain slightly higher common Pb and varying Pb/U, and choosing an initial Pb isotopic composition to calculate the age may not be appropriate (Banerjee et al. Reference Banerjee, Simonetti, Furnes, Muehlenbachs, Staudigel, Heaman and van Kranendonk2007; Li et al. Reference Li, Li, Wu, Yin, Ye, Liu, Tang and Zhang2012; Chen & Simonetti, Reference Chen and Simonetti2013). Thus, we use the 207Pb-correction method to calculate the apatite age (Chen & Simonetti, Reference Chen and Simonetti2013). The uncorrected data are plotted in the Tera-Wasserburg diagram, and these analyses yielded a lower intercept age that approximates the apatite age. The y-intercept initial 207Pb/206Pb can be used to obtain the individual 207Pb-corrected 206Pb–238U ages, which can be used to calculate the weighted average age of the apatite (Grunenfelder et al. Reference Grunenfelder, Tilton, Bell and Blenkinsop1986; Chen & Simonetti, Reference Chen and Simonetti2013).
Apatite grains from the disseminated ore sample are colourless and predominantly prismatic euhedral crystals, and the CL images (Fig. 5c) show that the compositions of the apatites are homogeneous. All 15 analyses on 10 apatite grains (Fig. 5c) contain a significant amount of common Pb, deviating from the U–Pb age concordia line. All analyses plot on a line on the Tera-Wasserburg concordia diagram, yielding a lower intercept age of 818 ± 39 Ma (Fig. 5d). 206Pb–238U ages after correction of common Pb (Chen & Simonetti, Reference Chen and Simonetti2013) vary from 820 to 791 Ma, yielding a weighted mean age of 810 ± 5 Ma (MSWD = 1.3, n = 15; Fig. 5d). This weighted mean 206Pb–238U age of 810 ± 5 Ma was interpreted as the crystallization age of the apatite.
5.c. Mineral major-element compositions
5.c.1. Olivine
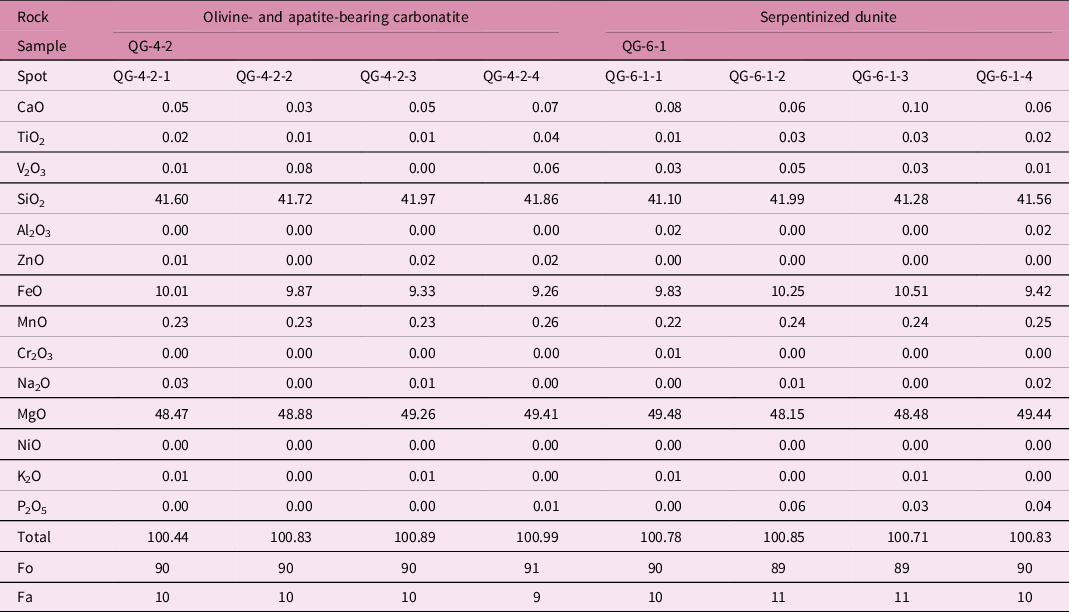
Major-element compositions of eight olivine grains, four from sample QG-4-2 (Fig. 3h, I; Table 1) and four from sample QG-6-1 (Fig. 3g; Table 1), are listed in Table 2. The major-element contents of the olivine grains from these samples are basically the same, and all the analysed olivine grains are chrysolite according to their ratios between forsterite and fayalite. Forsterite percentages and CaO contents of the olivines are consistent from 89 % to 91 % and 0.03–0.10 wt %, respectively. The high forsterite percentages of the olivines indicate the ultrabasic deep source of the parental magma forming the QMC, and the consistent compositions of the olivines in the two lithologies might indicate the same magmatic source.
Major-element compositions (wt %) of olivines from the QMC

5.c.2. Pyroxene
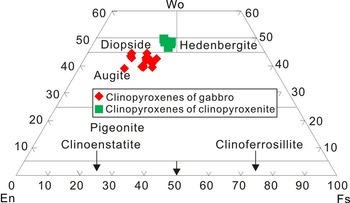
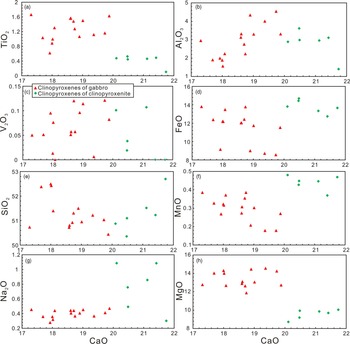
Major-element compositions of 21 pyroxene grains, 15 from samples QG-1-1 and QG-1-2 (Table 1) and 6 from samples QG-3-1 and QG-3-2 (Table 1), are listed in online Supplementary Material Table S4 and are illustrated in Figures 6 and 7. The major-element data for 21 pyroxene grains from these samples exhibit large compositional ranges, i.e. SiO2 = 50.35–53.45 wt %, CaO = 17.31–21.74 wt %, MgO = 8.71–16.52 wt %, FeO = 8.55–14.69 wt % and Al2O3 = 1.40–4.54 wt %. Clinopyroxenes of the clinopyroxenites have relatively low Mg no. values (53–57) and plot into the field of diopside in the Wo–En–Fs diagram, while clinopyroxenes of the gabbros have relatively high Mg no. values (61–76) and all plot into the field of augite in the Wo–En–Fs diagram (Fig. 6). As CaO contents increase, SiO2 and Al2O3 contents of the clinopyroxenes in the gabbros and clinopyroxenites show opposite trends (Fig. 7b, e), which should be related to the occupation of Si and AlIV (Al in the tetrahedral sites) in the clinopyroxene structure due to the formation of the two lithologies at different pressures. Compared with the clinopyroxenes of the clinopyroxenites, the clinopyroxenes of the gabbros have lower CaO and FeO contents (Fig. 7d) and higher MgO and TiO2 contents (Fig. 7a, h). The lower CaO contents of the clinopyroxenes in the gabbros might be related to the crystallization of apatite, clinopyroxene and calcite in the early stage of magma evolution, and the lower TiO2 contents of the clinopyroxenes in the clinopyroxenites could be related to the earlier or simultaneous crystallization of ilmenite rather than clinopyroxene (Fig. 4e; Pang et al. Reference Pang, Li, Zhou and Ripley2009).
Wo–En–Fs diagram showing the compositions of clinopyroxenes from the QMC.

(a–h) Binary variation diagrams (TiO2, Al2O3, V2O3, FeO, SiO2, MnO, Na2O and MgO versus CaO) for clinopyroxenes from the QMC.

5.c.3. Feldspar
Major-element compositions of 12 feldspar grains, nine from samples QG-1-1 and QG-1-2 (Table 1) and three from sample QG-3-3 (Table 1), are listed in online Supplementary Material Table S5. The major-element data of 12 feldspar grains from these samples exhibit large compositional ranges, i.e. SiO2 = 53.84–66.21 wt %, Al2O3 = 19.36–29.49 wt %, CaO = 0.00–12.72 wt %, Na2O = 0.03–5.90 wt %, K2O = 0.13–15.24 wt % and FeO = 0.04–0.81 wt %. The analysed feldspars of the feldspar-bearing clinopyroxenite are K-feldspar (Or = 99 to 100), and the feldspars of the gabbros are andesine and labradorite (An = 43 to 62, Ab = 37 to 55). From the feldspar-bearing clinopyroxenite to gabbro, the obvious change of feldspar type should be related to the obvious decrease of K and Ca contents in the magma due to the crystallization of abundant phlogopite, clinopyroxene, apatite and calcite in the process of magma evolution (Fig. 3f, h, j).
5.c.4. Apatite
Major-element compositions of 31 apatite grains, 20 from samples QG-2-1 and QG-2-2 (Figs 3e, 4a, b; Table 1) and 11 from samples QG-3-1 and QG-3-4 (Figs 3k, 4c, d; Table 1), are listed in online Supplementary Material Table S6 and are illustrated in online Supplementary Material Figure S1. Apatite grains from these samples are rich in F (0.68–2.71 wt %) but depleted in Cl (<0.03 wt %), indicative of crystallization at a high temperature. These apatites define a relatively narrow range of CaO contents (54.33–56.85 wt %), whereas P2O5 contents vary significantly (36.82–42.16 wt %). The collective term apatite refers to a series of hexagonal and monoclinic phosphates whose idealized formula can be expressed as Ca5(PO4)3(F,OH,Cl). Prefixes fluor-, hydroxyl- or chlor- are added to the root name to indicate the predominant anion located in structural channels parallel to [0001] (Hughes et al. Reference Hughes, Cameron and Crowley1989, Reference Hughes, Cameron and Crowley1990). The X F and X OH of the apatites in the apatite- and/or magnetite-bearing clinopyroxenites range from 0.40 to 0.74 and 0.26 to 0.60, respectively, with a wide range of variation. While the X F and X OH of the apatites in the disseminated ores range from 0.19 to 0.36 and 0.64 to 0.81, respectively, with a narrow range of variation. Most of the apatites in the apatite- and/or magnetite-bearing clinopyroxenites are F-rich hydroxylapatite with a small amount of fluoroapatite, while the apatites in the disseminated ores are hydroxylapatite.
The apatite grains (analysis spots QG-3-1-1 to QG-3-1-4, and spot QG-3-4-4) enclosed in clinopyroxene crystals (Fig. 4c) have higher F contents (1.54 to 2.71 wt %) and relatively lower SiO2 contents (0.11 to 0.16 wt %) than the apatite grains occupying the interstitial regions between the clinopyroxene crystals (Fig. 4d), which might be related to their earlier crystallization in magma with low Si contents. The apatites of the apatite- and/or magnetite-bearing clinopyroxenites have relatively higher contents of F, CaO, Cl, FeO, P2O5 and SiO2 and lower contents of MgO than the apatites of the disseminated ores (online Supplementary Material Fig. S1), indicating their different crystallization conditions. The higher contents of F, CaO, FeO, P2O5 and SiO2 and lower MgO contents of the apatites in the apatite- and/or magnetite-bearing clinopyroxenites should be related to their early crystallization due to relatively high F, Cao, FeO, P2O5 and SiO2 contents in the silicate magma at that time. In contrast, the higher H2O contents of the apatites in the disseminated ores should be related to their late crystallization due to large amounts of volatiles in the carbonatite magma.
5.c.5. Fe–Ti oxides
Major-element compositions of 18 magnetite grains (13 from samples QG-2-1 and QG-2-2, and 5 from sample QG-3-4; Table 1) and 17 ilmenite grains (eight from samples QG-2-1 and QG-2-2, and nine from samples QG-3-4 and QG-3-5; Table 1) are listed in online Supplementary Material Table S7 and are illustrated in online Supplementary Material Figure S2. The major-element data for the magnetite grains exhibit large compositional ranges, i.e. Fe2O3 = 55.51–65.41 wt %, FeO = 29.79–33.54 wt %, TiO2 = 0.01–6.43 wt %, Cr2O3 = 0.00–0.20 wt % and V2O3 = 0.23–0.93 wt %. The major-element data for the ilmenite grains also exhibit large compositional ranges, i.e. Fe2O3 = 0.92–8.03 wt %, FeO = 25.69–41.43 wt %, TiO2 = 47.81–54.84 wt %, MgO = 0.03–10.83 wt % and V2O3 = 0.19–0.56 wt %. The Fe2O3 and TiO2 contents of the magnetites in the magnetite- and apatite-bearing clinopyroxenites have a small variation range, while the contents of the magnetites in the disseminated ores vary over a large range (online Supplementary Material Fig. S2a–c), which might be due to the rebalancing of subsolid phase lines and dissolution during cooling (Fig. 3m, o). The magnetite grains enclosed in olivine crystals (analysis spots QG-2-1-1, QG-2-1-3 and QG-2-2-3; Fig. 4g) of the disseminated ores have higher Fe2O3 and lower FeO contents than the magnetite grains occupying the interstitial regions between calcite crystals (Fig. 4f), indicating higher oxygen fugacity conditions in the early stage of carbonatite magma forming carbonatite-related phosphate ores. Magnetites and ilmenites of the magnetite- and apatite-bearing clinopyroxenites have higher Fe2O3, SiO2, Cr2O3 and V2O3 contents (online Supplementary Material Fig. S2a, c, e, g) and lower TiO2 and MgO contents (online Supplementary Material Fig. S2b, f). The MgO contents of the magnetites in the disseminated ores increase with the increase in TiO2 contents (online Supplementary Material Fig. S2b) and decrease with the decrease in Fe2O3 contents (online Supplementary Material Fig. S2a), which should be related to the isomorphic substitution of Mg2+ and Fe2+ in magnetite. The high SiO2, Cr2O3 and V2O3 contents of the magnetites and ilmenites in the magnetite- and apatite-bearing clinopyroxenite (Fig. 4e, h, i) should be related to the composition and property of the silicate magma, while their high contents of Fe2O3 should be related to the high oxygen fugacity conditions when they crystallized.
5.d. Whole-rock geochemistry and Sr–Nd isotopes
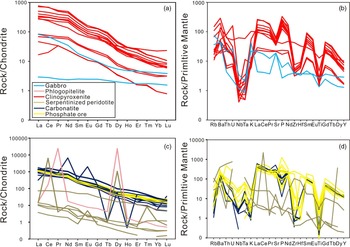
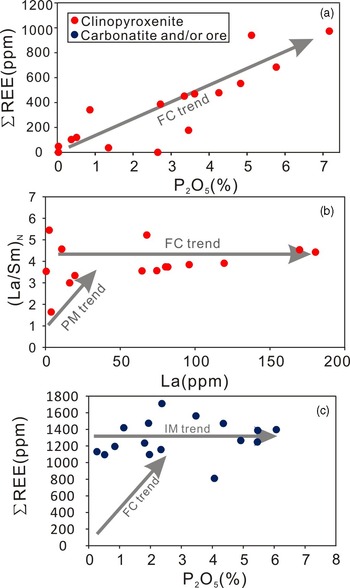
The whole-rock major- and trace-element data from this work and previously published papers (Jiang et al. Reference Jiang, Lu, Bai, Zhang, Ye, Feng and Chen2005; Zhang et al. Reference Zhang, Li, Li, Lu, Ye and Li2007; Sun & Zhou, Reference Sun and Zhou2008, Fu, Reference Fu2012) are presented in online Supplementary Material Table S8 and are illustrated in Figures 8 and 9 and online Supplementary Material Figure S3. The low loss on ignition (LOI) values (mostly less than 1.74 wt %) of the clinopyroxenite and gabbro samples indicate insignificant alteration, consistent with their petrographic characteristics. The low LOI values of the carbonatite samples (less than 1.68 wt %) after removing the CO2 content in calcite and H2O content in apatite indicate that the alteration is insignificant, which is also consistent with the lithofacies characteristics (Fig. 3h, i; Zhang et al. Reference Zhang, Li, Li, Lu, Ye and Li2007; Ye et al. Reference Ye, Li and Lan2013; W. Chen, unpub. Ph.D. thesis, China Univ. Geosciences, 2021). While the high LOI values (14.59–22.60 wt %) and CaO contents (1.25–23.79 wt %) of the serpentinized dunite samples, which might be caused by the injection of calcite and significantly influenced by fluid-related alteration (Fig. 3g; Huang et al. Reference Huang, Sun, Gu, Wang and Cao2001, Reference Huang, Wu, Lei, Chen, Xiong, Qin and Gu2012; Q. Yuan, unpub. Ph.D. thesis, China Univ. Geosciences, 2016; W. Chen, unpub. Ph.D. thesis, China Univ. Geosciences, 2021), indicate that these samples do not represent magmatic compositions. The major-element data for the silicate rocks from the QMC exhibit large compositional ranges, i.e. SiO2 = 24.90–54.43 wt %, Al2O3 = 0.38–16.38 wt %, CaO = 0.05–27.40 wt %, MgO = 3.35–37.13 wt %, Fe2O3 T = 1.23–14.12 wt %, TiO2 = 0.05–2.77 wt %, P2O5 = 0.02–7.17 wt %, K2O = 0.07–10.15 wt % and Na2O = 0.00–4.77 wt %. They are characterized by large ranges of Mg no. values (40–99) and Ni (0.01–1812 ppm) and V (0.01–1281 ppm) contents. The highest content of MgO in the clinopyroxenites and serpentinized dunites reaches 34.20 wt % and 37.13 wt %, respectively, possibly due to the cumulation of clinopyroxene or olivine. In the AFM (Na2O + K2O–FeO–MgO) diagram, the clinopyroxenite and gabbro samples follow a tholeiitic trend (online Supplementary Material Fig. S3). Large variations in REE contents (∑REE = 1 to 8433 ppm) reflect different abundances and compositions of intercumulus liquids. Silicate rocks from the QMC are generally enriched in light REEs (LREEs) relative to heavy REEs (HREEs), with (La/Yb)N values ranging from 10 to 84 (Fig. 8a, c). The clinopyroxenites, gabbros and serpentinized dunites show similar REE distribution patterns, and the clinopyroxenites have higher REE contents than the gabbros and serpentinized dunites (Fig. 8a, c). The REE distribution patterns of the most silicate rocks show slight negative Eu anomalies, while the serpentinized dunites show obvious or slight positive Eu anomalies, indicating that plagioclase did not undergo obvious fractional crystallization in the early stage of magmatic evolution. Similar to the REE distribution patterns, primitive mantle-normalized spider diagrams (Sun & McDonough, Reference Sun, McDonough, Saunders and Norry1989) of the silicate rocks for incompatible elements also exhibit variable abundances, reflecting different abundances and compositions of intercumulus liquids (Fig. 8b, d). As shown in Figure 9a, b, the REE contents are positively correlated with P2O5 concentrations, and the (La/Sm)N values versus La contents show a good linear correlation, indicating apatite accumulation, because all REE partition coefficients for apatite are higher than 1.0 (Brassinnes et al. Reference Brassinnes, Balaganskayab and Demaiffea2005). In the silicate rocks, Ba is anomalously enriched relative to Rb and Th, and P is anomalously enriched relative to Sr and Nd (Fig. 8b, d). Primitive mantle-normalized incompatible element spider diagrams exhibit variable abundances (e.g. Rb, Ba, Th, U) and depletion in Nb, Ta, Zr, Hf and Ti due to fractional crystallization and/or mineral accumulation. The gabbros have variable positive Sr anomalies, whereas the clinopyroxenites have obvious negative Sr anomalies (Fig. 8b).
(a, c) Chondrite-normalized REE patterns and (b, d) primitive mantle-normalized incompatible element spider diagrams for the rocks from the QMC. The normalizing values are from Sun & McDonough (Reference Sun, McDonough, Saunders and Norry1989).

(a) ∑REE versus P2O5 discrimination diagram. (b) (La/Sm)N versus La discrimination diagram after Treuil & Joron (Reference Treuil and Joron1975). (c) ∑REE versus P2O5 discrimination diagram. FC – fractional crystallization; IM – liquid immiscibility; PM – partial melting.

The carbonatite samples have relatively consistent CaO (44.68–52.10 wt %) and MgO (2.46–4.68 wt %), but variable ∑REE (809–4266 ppm), TiO2 (0.07–0.68 wt %), SiO2 (0.14–4.36 wt %) and Fe2O3 (0.51–7.61 wt %). Major-element compositions indicate a calcic nature according to the classification scheme suggested by Gittins & Harmer (Reference Gittins and Harmer1997). As shown in Figure 8c, carbonatites have pronounced fractionation between LREEs and HREEs with (La/Yb)N values ranging from 16 to 232 and insignificant negative Eu anomalies. On primitive mantle-normalized incompatible element spider diagrams, the carbonatites are enriched in Ba but depleted in Nb, Zr, Hf and Ti relative to the neighbouring elements (Fig. 8d). The carbonatites and clinopyroxenites show similar REE and trace-element distribution patterns, indicating that they were likely derived from the evolution of the same magma. Unlike the clinopyroxenites, the carbonatites are extremely depleted in Zr, Hf, Nb and Ti, while enriched in Ta (Fig. 8b, d). The depletion of Ti might be due to crystal fractionation of rutile and/or titanite. Compared with silicate rocks, the carbonatites have higher LREE contents, which might be related to the gradual enrichment of volatiles during the evolution of the magma because LREEs are easier to be enriched in the volatile-rich melt proposed by Cullers & Graf (Reference Cullers and Graf1984). The trace-element compositions of the carbonatites are similar to those of the average calcio-carbonatites documented by Woolley & Kempe (Reference Woolley, Kempe and Bell1989). As noted by Woolley & Kempe (Reference Woolley, Kempe and Bell1989) and Harmer (Reference Harmer1999), care should be taken when using such an average composition because of the extreme ranges observed in certain elements in carbonatites (e.g. Nb, Sr and Ba). For example, the carbonatites exhibit a Nb content of less than 24.40 ppm, which is much lower than the average Nb content of carbonatites (1204 ppm; Woolley & Kempe, Reference Woolley, Kempe and Bell1989). Compared with the carbonatites, the disseminated phosphate ores show higher contents of REEs, P, Ta, Zr, Hf and Ti, which should be related to the higher proportion of apatite and Fe–Ti oxides. As shown in Figure 8, the phosphate ore samples show similar REE and trace-element distribution patterns to the carbonatite and clinopyroxenite samples.
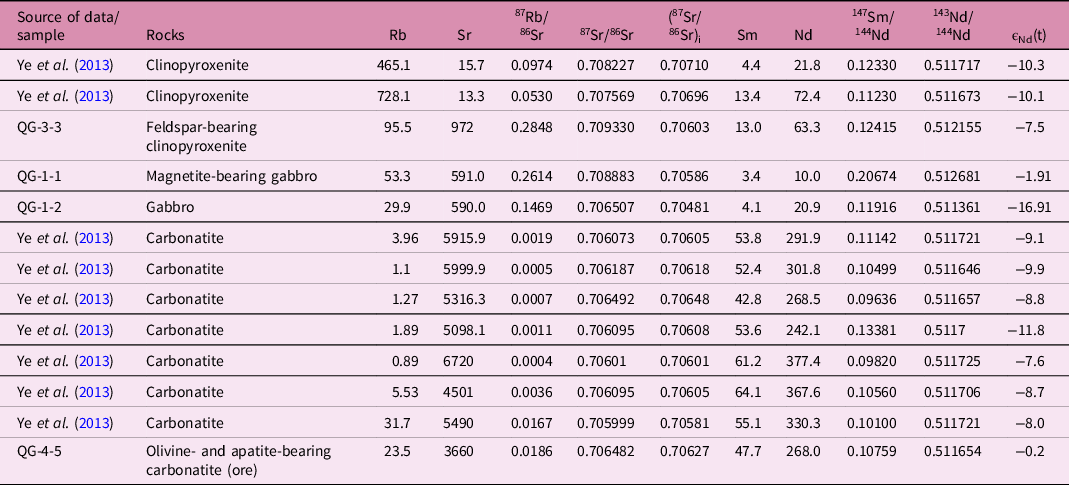
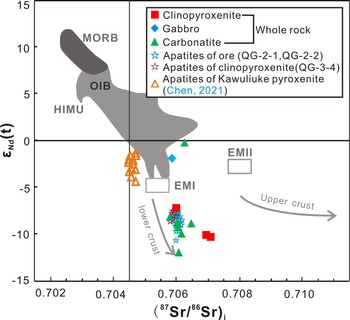
The calculated ϵNd(t) and (87Sr/86Sr)i values and the reported whole-rock Sr–Nd isotopic data of the QMC (Ye et al. Reference Ye, Li and Lan2013) are listed in Table 3 and are illustrated in Figure 10. The clinopyroxenite and gabbro samples exhibit a wide range of Sr–Nd isotopic compositions (ϵNd(t) = −1.91 to −16.91; (87Sr/86Sr)i = 0.70481 to 0.70710). The carbonatite samples also exhibit a wide range of Nd isotopic compositions (ϵNd(t) = −0.20 to −11.80) and relatively low initial 87Sr/86Sr ratios ((87Sr/86Sr)i = 0.70581 to 0.70648), in which sample QG-4-5 has the lowest ϵNd(t) value (−0.20). Overall, these rock samples have ϵNd(t) and (87Sr/86Sr)i values in the ranges of −0.20 to −16.91 and 0.70581 to 0.70710, respectively, and plot within the enriched mantle quadrant of the anti-correlation diagram (Fig. 10; sample QG-1-2 is not plotted). In terms of the Sr–Nd isotopic compositions of the QMC, the ϵNd(t) values have a larger variation range than the (87Sr/86Sr)i values, and the silicate rocks have a relatively larger variation range than the carbonatites in (87Sr/86Sr)i values.
Whole-rock Sr–Nd isotopic data for the QMC

Plot of ϵNd(t) values versus (87Sr/86Sr)i values of the QMC and apatites from the Kawuliuke 810 Ma pyroxenite (W. Chen, unpub. Ph.D. thesis, China Univ. Geosciences, 2021), northeastern Tarim Block. Depleted MORB mantle (DMM), high-µ (HIMU), enriched mantle I (EMI) and enriched mantle II (EMII) components are from Zindler & Hart (Reference Zindler and Hart1986) and DePaolo (Reference DePaolo1979). Base plot is after Hart & Zindler (Reference Hart, Zindler and Peltier1989). MORB – mid-ocean ridge basalt; OIB – ocean island basalt.

5.e. Zircon Hf isotopes
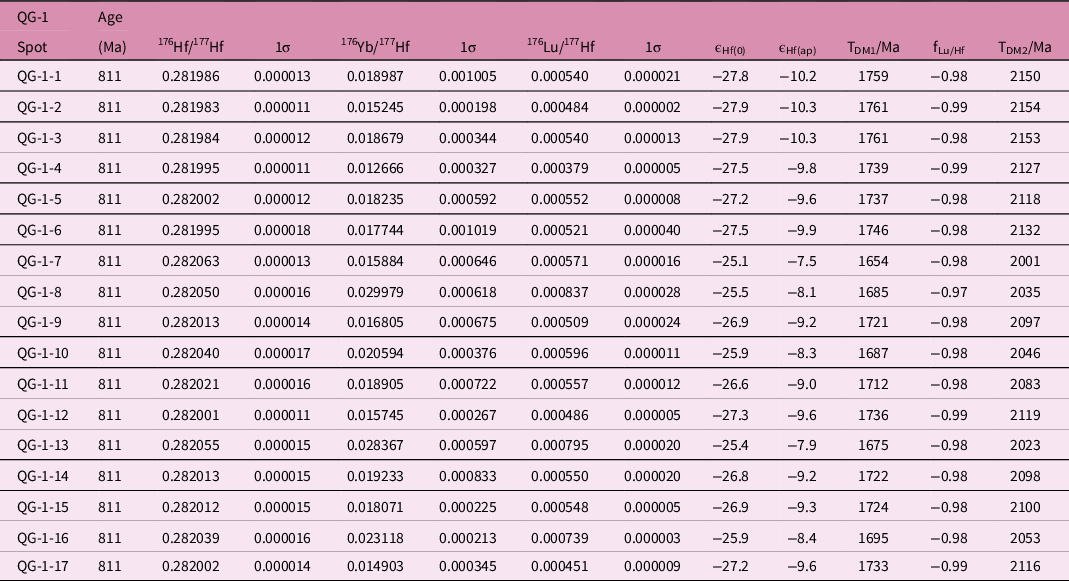
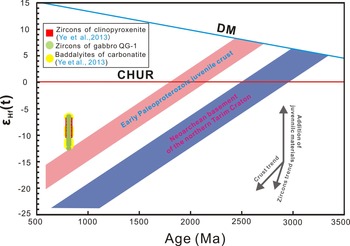
The zircon Hf isotopic data for the gabbro are listed in Table 4 and are illustrated in Figure 11. The calculated ϵHf(t) values of the zircon grains in the gabbro sample range from −7.5 to −10.3. The reported ϵHf(t) values of baddeleyites in the carbonatite and zircons in the clinopyroxenite range from −6.7 to −12.9 and −6.8 to −12.4 (Ye et al. Reference Ye, Li and Lan2013), respectively, consistent with the ϵHf(t) values of zircons in the gabbro and whole-rock enriched Sr–Nd isotopic characteristics (Figs 10, 11).
LA-ICP-MS Lu–Hf isotopic compositions of zircon grains for the gabbro

ϵHf(t) versus crystal age plots for dated zircon samples (after Long et al. Reference Long, Yuan, Sun, Kröner, Zhao, Wilde and Hu2011 a). DM – depleted mantle; CHUR – chondritic uniform reservoir.

5.f. Trace-element compositions and Sr–Nd isotopes of apatite
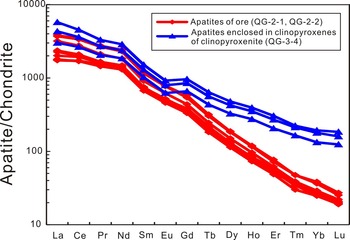
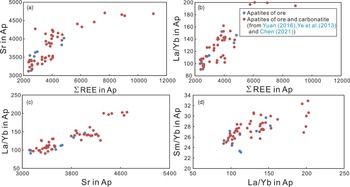
Trace-element compositions of 13 apatite grains, nine from samples QG-2-1 and QG-2-2 (Figs 3l, 4a, b; Table 1) and four from sample QG-3-4 (all apatite grains are enclosed in clinopyroxene crystals; Fig. 4c, d; Table 1), are listed in online Supplementary Material Table S9. The ∑REE contents of apatite grains from these samples vary widely from 2540 to 6540 ppm, and the ∑REE and HREE contents of apatite grains enclosed in clinopyroxene crystals of the magnetite- and apatite-bearing clinopyroxenite are obviously higher than those of apatites in the disseminated ores (Fig. 12). The Sr contents of apatite grains from these samples also vary widely from 2135 to 4020 ppm, while the V contents vary narrowly from 2.11 to 3.56 ppm. The Sr and V contents of apatites in the disseminated ores are slightly higher than those of apatites enclosed in clinopyroxenes. The apatite grains from the two different types of samples are fairly homogeneous in each trace-element composition (Fig. 12). All apatites of the disseminated ores have consistent LREE-enriched patterns with La/Yb ratios of 92 to 152, and negligible Eu anomalies with Eu/Eu* values of 0.88 to 0.92. The apatites enclosed in clinopyroxenes also have consistent LREE-enriched patterns with La/Yb ratios of 32 to 54, and slightly obvious Eu anomalies with Eu/Eu* values of 0.72 to 0.74. Compared with the apatites enclosed in clinopyroxenes of the magnetite- and apatite-bearing clinopyroxenites, the higher La/Yb ratios of the apatites in the disseminated ores indicate their more obvious differentiation of LREEs and HREEs. The La/Yb ratios and Sr contents of apatites in the disseminated ores show a significant positive correlation with ∑REE contents (Fig. 13a, b), and the La/Yb ratios also show a significant positive correlation with Sr contents and Sm/Yb ratios (Fig. 13c, d).
Chondrite-normalized REE distribution patterns of apatites from the QMC. The chondrite data are from Sun & McDonough (Reference Sun, McDonough, Saunders and Norry1989).

Binary variation diagrams for apatites from the QMC: (a) Sr versus ∑REE; (b) La/Yb versus ∑REE; (c) La/Yb versus Sr; (d) Sm/Yb versus La/Yb. Data for apatites in ore and carbonatite from Q. Yuan (unpub. Ph.D. thesis, China Univ. Geosciences, 2016), Ye et al. (Reference Ye, Li and Lan2013) and W. Chen (unpub. Ph.D. thesis, China Univ. Geosciences, 2021).

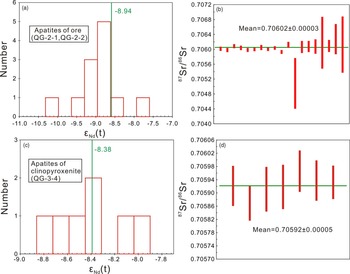
In situ Sr–Nd isotopic compositions of 25 apatite grains, 18 from samples QG-2-1 and QG-2-2 (all analysed apatite grains are enclosed in olivine and calcite crystals; Fig. 4a, b; Table 1) and seven from sample QG-3-4 (all analysed apatite grains are enclosed in clinopyroxene crystals; Fig. 4c, d; Table 1), are listed in online Supplementary Material Table S10. Eighteen in situ Nd isotopic analyses of apatite grains from the disseminated ore samples yield a range of ϵNd(t) values from −7.73 to −10.24, and the cumulative probability histogram displays a normal distribution with an average value of −8.94 (n = 18; Fig. 14a). In situ analysis of apatite grains from the disseminated ore samples give (87Sr/86Sr)i values from 0.70509 to 0.70628, and the weighted mean value of these (87Sr/86Sr)i values is 0.70602 ± 0.00003 (n = 18; Fig. 14b). Seven in situ analyses of apatite grains from the magnetite- and apatite-bearing clinopyroxenite sample yield a relatively smaller range of Sr and a larger range of Nd isotopic compositions compared to those from the disseminated ore samples. These apatites enclosed in clinopyroxenes have ϵNd(t) values ranging from −7.96 to −8.79, and the cumulative probability histogram also displays a normal distribution with an average value of −8.38 (n = 7; Fig. 14c). Additionally, these apatites show a smaller range of (87Sr/86Sr)i values of 0.70587 to 0.70597, with a weighted mean value of 0.70592 ± 0.00005 (n = 7; Fig. 14d). On the whole, the (87Sr/86Sr)i values of the apatites enclosed in olivines and calcites of the disseminated ores are higher than those of apatites enclosed in clinopyroxenes of the magnetite- and apatite-bearing clinopyroxenite, while the ϵNd(t) values are lower. However, the average (87Sr/86Sr)i value and the weighted mean ϵNd(t) value of the apatite grains from these samples generally overlap with each other (Figs 10, 14). Compared with the whole-rock Sr–Nd isotopes of the clinopyroxenites ((87Sr/86Sr)i = 0.70603 to 0.70710, average value is 0.70670; ϵNd(t) = −7.50 to −10.30, average value is −9.30), the (87Sr/86Sr)i values of the apatites enclosed in clinopyroxenes are generally lower and the ϵNd(t) values are generally higher (Figs 10, 14). Unlike the clinopyroxenites, the initial Sr–Nd isotopic ratios of apatites enclosed in olivines and calcites are similar to the whole-rock Sr–Nd isotopes of the carbonatites ((87Sr/86Sr)i = 0.70581 to 0.70648, average value is 0.70609; ϵNd(t) = −7.60 to −11.8, average value is −9.13). The Sr–Nd isotopic compositions of the whole-rock and apatites all plot within the enriched mantle quadrant of the anti-correlation diagram (Fig. 10).
(a) Cumulative probability histogram of ϵNd(t) values of apatites enclosed in olivines and calcites of ore. (b) Weighted mean diagram of (87Sr/86Sr)i values of apatites enclosed in olivines and calcites of ore. (c) Cumulative probability histogram of ϵNd(t) values of apatites enclosed in clinopyroxenes of clinopyroxenite. (d) Weighted mean diagram of (87Sr/86Sr)i values of apatites enclosed in clinopyroxenes of clinopyroxenite.

5.g. S isotopes of pyrite and chalcopyrite
In situ S isotopic compositions of 34 pyrite and chalcopyrite grains (online Supplementary Material Fig. S4a; Table 1), six from sample QG-4-2, five from sample QG-3-4, seven from sample QG-6-1, eight from samples QG-1-1 and QG-1-2, and eight from sample QG-2-1, are listed in online Supplementary Material Table S11. The δ34S values of a small amount of pyrites and chalcopyrites in these samples mainly vary from +0.7 ‰ to +3.0 ‰ (online Supplementary Material Fig. S4c), which are similar to the δ34S values (+1.3 ‰ to +2.86 ‰) of pyrites in clinopyroxenite reported by Chen (Reference Chen1989), belonging to sulfur from the mantle. Some pyrites and chalcopyrites have higher δ34S values of +3.2 ‰ to +6.6 ‰, which are higher than the δ34S value of sulfur from the mantle. These high δ34S values are relatively concentrated (online Supplementary Material Fig. S4c), which might be hydrothermal sulfur (online Supplementary Material Fig. S4b), as Liu & Wen (Reference Liu and Wen2007) and Huang et al. (Reference Huang, Wu, Lei, Chen, Xiong, Qin and Gu2012) pointed out that hydrothermal alteration existed in the late evolution of the Qieganbulake magma. In fact, a small number of subhedral sulfide grains with high δ34S values (+3.2 ‰ to +6.6 ‰) are distributed in different lithofacies of the Qieganbulake complex (online Supplementary Material Table S11), and they are usually distributed in patchy textures and an obvious metasomatic structure around the Fe–Ti oxides (online Supplementary Material Fig. S4b), obviously indicating that these sulfides were formed by late magmatic hydrothermal sulfur. According to the results of our in situ sulfide S isotope analysis, the primary compositions of the sulfide minerals are magmatic, though a late hydrothermal overprint for some points cannot be ruled out. One previous study showed high chalcophile elements (Q. Yuan, unpub. Ph.D. thesis, China Univ. Geosciences, 2016) in the magnetite of the QMC rocks, indicating equilibration with co-magmatic sulfide mineral assemblages (Bhattacharjee & Mondal, Reference Bhattacharjee and Mondal2021).
6. Discussion
6.a. Genetic and ore-forming ages
The precise geochronological data obtained contributes to the understanding of the formation and evolution of the carbonatites and associated silicate rocks, i.e. whether they are temporally related in time (e.g. Bell et al. Reference Bell, Kjarsgaard and Simonetti1998; Chen & Simonetti, Reference Chen and Simonetti2013, Reference Chen and Simonetti2014; Poletti et al. Reference Poletti, Cottle, Hagenpeter and Lackey2016; Ying et al. Reference Ying, Chen, Lu, Jiang and Yang2017). Some questionable whole-rock U–Pb ages of 900, 860 and 630 Ma were reported for the QMC by Yang & Woolley (Reference Yang and Woolley2006) and a phlogopite 40Ar–39Ar age of 862 ± 12 Ma for the phlogopitelite by Yin (Reference Yin1992). Recently, Zhang et al. (Reference Zhang, Li, Li, Lu, Ye and Li2007) reported a precise baddeleyite TIMS U–Pb age of 810 ± 6 Ma for the carbonatite, a phlogopite 40Ar–39Ar age of 812 ± 1 Ma for the phlogopitelite and a SHRIMP zircon U–Pb age of 818 ± 11 Ma for the clinopyroxenite. Ye et al. (Reference Ye, Li and Lan2013) reported a precise phlogopite 40Ar–39Ar age of 809 ± 1 Ma for the phlogopitelite and a secondary ion mass spectrometry (SIMS) zircon U–Pb age of 816 ± 13 Ma for the clinopyroxenite. Sun & Zhou (Reference Sun and Zhou2008) reported a precise Rb–Sr isotope age of 802 ± 14 Ma for the QMC, and Li et al. (Reference Li, Li, Liu, Tang, Yang and Zhu2010) reported a precise SIMS baddeleyite Pb–Pb age of 815 ± 4 Ma for the carbonatite. In this paper, we report a precise LA-ICP-MS zircon U–Pb age of 810 ± 4 Ma for the gabbro. Thus, it is clear that the carbonatites and their associated silicate rocks within the complex were emplaced at the same time. This contemporaneous emplacement is reinforced by field observations such as the curved and crenellated contact relationships between the rocks that indicate they were molten during emplacement (Ye et al. Reference Ye, Li and Lan2013; Q. Yuan, unpub. Ph.D. thesis, China Univ. Geosciences, 2016; W. Chen, unpub. Ph.D. thesis, China Univ. Geosciences, 2021). In addition, the consistency of the major elements and forsterite percentage of olivines in the carbonatite and serpentinized dunite also indicate that they were derived from the same parental magma. Accordingly, the ages reported here combined with field and olivine evidence support that the carbonatite and silicate rocks within the QMC were emplaced simultaneously at c. 810 Ma.
It is considered that the apatite and baddeleyite crystals co-crystallized from the carbonatite magma; therefore, baddeleyite could be used indirectly to constrain the timing of phosphorous mineralization, with a TIMS U–Pb age of 810 ± 6 Ma (Zhang et al. Reference Zhang, Li, Li, Lu, Ye and Li2007) and a SIMS Pb–Pb age of 815 ± 34 Ma (Li et al. Reference Li, Li, Liu, Tang, Yang and Zhu2010). However, direct dating of mineralization on apatite has never been performed due to its low U content and high common Pb. No core–rim texture was found in the apatite grains by either microscopic petrography or CL imaging (Fig. 5c), suggesting a single-phase crystallization. The apatite U–Pb age reflects the phosphorous mineralization age. In this study, we report a precise apatite LA-ICP-MS U–Pb age of 810 ± 5 Ma for the disseminated phosphorous ore, indicating the ore-forming age of the Qieganbulake phosphorous deposit was c. 810 Ma. The ore-forming age was synchronous with the complex, indicating the magmatic origin of the carbonatite-related phosphorous ores.
6.b. Petrogenesis of the QMC
6.b.1. Crustal contamination
The overall similarities of the whole-rock Sr–Nd isotopes of the intrusive rocks and Sr–Nd–Hf–S isotopes of minerals from the QMC indicate their derivation from a similar, or more likely a common enriched-mantle source (Figs 10, 11 and online Supplementary Material Fig. S4). Although crustal contamination and metasomatism of mantle sources could result in enriched isotopic characteristics (Li et al. Reference Li, Su, Chung, Liu, Song and Liu2005), the following lines of evidence favour a mantle source enrichment rather than crustal contamination for the carbonatite melt. Firstly, the high concentrations of Sr and Nd in the carbonatites render their isotope signatures relatively immune to the influence of crustal contamination. Secondly, the in situ initial Sr–Nd isotopic ratios of apatite grains crystallized earlier from the carbonatite (Fig. 4a, b) are similar to the whole-rock Sr–Nd isotopes of the carbonatite (Fig. 10). Moreover, geochemical studies of other Neoproterozoic mafic rocks in the Kuluketage block also support this conclusion. The enriched Sr–Nd isotopic ratios (ϵNd(t) = −0.03 to −10.83; (87Sr/86Sr)i = 0.7059 to 0.7111) reported by Zhang et al. (Reference Zhang, Li, Li, Lu, Ye and Li2007, Reference Zhang, Yang, Wang, Takahashi and Ye2011, Reference Zhang, Zou, Wang, Li and Ye2012 b), Tang et al. (Reference Tang, Zhang, Li, Wang and Ripley2016), Q. Yuan (unpub. Ph.D. thesis, China Univ. Geosciences, 2016) and W. Chen (unpub. Ph.D. thesis, China Univ. Geosciences, 2021) from the c. 810 Ma and 760 Ma mafic–ultramafic layered intrusions and some c. 770 Ma and 735 Ma tholeiitic mafic dykes are similar to those of the QMC. The geochemical characteristics of these mafic rocks consistently indicate that their parental magmas were most likely derived from partial melting of enriched subcontinental lithospheric mantle.
Although, the crustal contamination has little, if any, effect on the carbonatite, it could affect the silicate rocks to varying degrees. Firstly, we notice that the whole-rock (87Sr/86Sr)i values of the silicate rocks are clearly higher than those of the carbonatites (Fig. 10). In addition, in situ apatite Sr–Nd isotopic analyses show that the clinopyroxenitic apatites crystallized earlier have systematically lower (87Sr/86Sr)i values and higher ϵNd(t) values than the whole-rock Sr–Nd isotopes of the clinopyroxenites (Fig. 10), indicating that the high (87Sr/86Sr)i component and the low ϵNd(t) component were involved in the evolution of the silicate magma. The above indirectly indicate the existence of crustal material mixing in the process of the silicate magma evolution. The Sr–Nd isotopes of the clinopyroxenitic apatites enclosed in clinopyroxenes are different from those of the clinopyroxenites, which was likely caused by the earlier crystallization of apatites less affected by crustal contamination (Ye et al. Reference Ye, Li and Lan2013). Hence, apatite might be able to better retain the initial Sr–Nd isotopic compositions. Additionally, identification of two zircon xenocrysts dated at 1.6 to 2.4 Ga from the clinopyroxenite (Ye et al. Reference Ye, Li and Lan2013) and one zircon xenocryst dated at 2.3 Ga from the gabbro provide another piece of evidence for crustal contamination.
6.b.2. Crystal fractionation or liquid immiscibility
Growing evidence from phase equilibrium experiments indicates that carbonatite can be generated by low-degree partial melting of primary mantle and by the differentiation of carbonated silicate melts, i.e. liquid immiscibility and/or crystal fractionation (Freestone & Hamilton, Reference Freestone and Hamilton1980; Kjarsgaard & Hamilton, Reference Kjarsgaard and Hamilton1988, Reference Kjarsgaard, Hamilton and Bell1989; Wallace & Green, Reference Wallace and Green1988; Gittins, Reference Gittins and Bell1989; Sweeney, Reference Sweeney1994; Lee & Wyllie, Reference Lee and Wyllie1994, Reference Lee and Wyllie1998; Veksler et al. Reference Veksler, Petibon, Jenner, Dorfman and Dingwell1998 b; Dalton & Presnall, Reference Dalton and Presnall1998; Chakhmouradian, Reference Chakhmouradian2006; Brooker & Kjarsgaard, Reference Brooker and Kjarsgaard2011; Tappe et al. Reference Tappe, Steenfelt and Nielsen2012; Cheng et al. Reference Cheng, Zhang, Hou, Santosh, Chen, Ke and Xu2017, Reference Cheng, Zhang, Aibai, Kong and Holtz2018). The term ‘primary carbonatite’ implies a near-solidus partial melt in equilibrium with CO2-rich peridotitic mantle (Eggler, Reference Eggler and Bell1989). Hammouda & Keshav (Reference Hammouda and Keshav2015) believed that Mg-carbonatites can be generated by low-degree partial melting of CO2-rich peridotitic mantle, while Ca-carbonatites are more likely to be generated by crystal fractionation or liquid immiscibility of CO2-rich silicate magma. Primary carbonatites are characterized by an elevated Mg no. (Sweeney, Reference Sweeney1994), high (Mg + Fe)/Ca ratios, moderate amounts of alkalis (Eggler, Reference Eggler and Bell1989) and necessarily a dominant calcic dolomite composition (Lee & Wyllie, Reference Lee and Wyllie1998). In contrast, the Qieganbulake carbonatites are characteristically low in MgO (2.46–4.68 wt %), alkalis (<0.45 wt %) and Nb (<24 ppm), distinct from those of primary carbonatites. These characteristics exclude the Qieganbulake calcio-carbonatites as candidates for low-degree partial melting of primary mantle, and were instead likely to have been generated by crystal fractionation or liquid immiscibility of CO2-rich silicate magma. Some experimental data support a fractionation model for the genesis of carbonatites (e.g. Lee & Wyllie, Reference Lee and Wyllie1994). However, the experimental residual liquids of carbonated alkali silicate melts were fairly rich in silica and thus non-carbonatitic in composition, indicating that a solely fractionation process is not a feasible mechanism for generating carbonatites from alkali silicate melts at low pressures of 0.2–0.5 GPa (Kjarsgaard, Reference Kjarsgaard1998). However, the QMC contains abundant clinopyroxenites, and cumulus clinopyroxenes are the principal mafic minerals in clinopyroxenites. A large amount of crystallization of clinopyroxenes will reduce the CaO content in the remaining melt, thus inhibiting the formation of large amounts of calcites. In contrast, immiscible carbonate-rich magmas separated from silicate magmas tend to have calcio-carbonatite compositions (Lee & Wyllie, Reference Lee and Wyllie1998). Furthermore, many partitioning experiments (e.g. Veksler et al. Reference Veksler, Nielsen and Sokolov1998 a, Reference Veksler, Dorfman, Danyushevsky, Jakobsen and Dingwell2006, Reference Veksler, Dorfman, Dulski, Kamenetsky, Danyushevsky, Jeffries and Dingwell2012; Martin et al. Reference Martin, Schmidt, Mattsson and Guenther2013) revealed that Nb and Ta were preferentially distributed into the silicate melt during liquid immiscibility. As mentioned above, the low contents of Nb (<24 ppm) and Ta (<3 ppm) in the Qieganbulake carbonatites indicate that they were generated by liquid immiscibility of CO2-rich silicate magma. Moreover, the high contents of P and REEs in the Qieganbulake carbonatites also prove their formation by liquid immiscibility (Káldos et al. Reference Káldos, Guzmics, Mitchell, Dawson, Milke and Szabóa2015).
The significantly different evolution trends of the carbonatite and clinopyroxenite as reflected by the ∑REE versus P2O5 discrimination diagram may show their different genetic processes (Fig. 9a, c). The ∑REE concentrations of the carbonatites remain constant as P2O5 content increases (Fig. 9c). In contrast, the ∑REE concentrations of the clinopyroxenites are positively correlated with P2O5 abundances (Fig. 9a). Large variations in mineral and chemical compositions of the Qieganbulake silicate rocks indicate their genetic processes were mainly constrained by crystal fractionation/cumulation of olivines, clinopyroxenes, phlogopites, feldspars, biotites, apatites and Fe–Ti oxides with different proportions. The highest content of MgO in the clinopyroxenites and dunites reaches up to 34.20 wt % and 37.13 wt %, respectively, which should be due to the cumulation of clinopyroxenes and olivines (Fig. 3g, j). The contents of compatible elements Ni and V in the silicate rocks are quite different. The Ni and V contents of the serpentinized dunite and clinopyroxenite are higher than those in the gabbro, and the Fe–Ti oxides of the gabbro have high contents of Cr and V (online Supplementary Material Fig. S2c, g), indicating that the differential crystallization of olivine, clinopyroxene and Fe–Ti oxides is the main factor controlling the abundance of compatible elements. As shown in Figure 9a, b, ∑REE contents are positively correlated with P2O5 concentrations, and the (La/Sm)N versus La plot shows a good linear correlation, which indicate apatite accumulation, because all REE partition coefficients for apatite are higher than 1.0 (Brassinnes et al. Reference Brassinnes, Balaganskayab and Demaiffea2005). From the clinopyroxenite to gabbro, the types of clinopyroxene change from diopside to augite, and the types of feldspar change from K-feldspar to plagioclase, indicating that the parental magma must have been Ca- and K-rich. The REE distribution patterns of the QMC mostly show a slight negative Eu anomaly and a small positive Eu anomaly, indicating that there is no obvious crystal fractionation of plagioclase in the early stage of magmatic evolution. Abundant Fe–Ti oxide inclusions in clinopyroxene crystals from the clinopyroxenites (Fig. 4e) indicate early crystallization of Fe–Ti oxides. Compared with the clinopyroxenites, Fe–Ti oxides in the phosphate ores contain lower Fe2O3, FeO and Cr2O3 contents and higher TiO2 contents (online Supplementary Material Fig. S2), indicating that the Fe–Ti oxides in the clinopyroxenite should have crystallized earlier than those in the phosphate ores. Mineral accumulation and/or fractional crystallization appear to have played an important role in the evolution of the Qieganbulake magma. Thus, crystal fractionation and liquid immiscibility of the parental magma have played an important role in the formation of the QMC.
6.c. Parental magma characteristics and sources
The QMC shows the characteristics of tholeiite (online Supplementary Material Fig. S3), with abundant Fe–Ti oxide inclusions in olivine and clinopyroxenite crystals (Fig. 4e, g), indicating that the olivines and clinopyroxenites should have crystallized from the Fe–Ti-rich basaltic magma. Abundant Fe–Ti oxides in the carbonatites and clinopyroxenites (Fig. 3e) and the high contents of Fe and Ti in the QMC again indicate that the basaltic parental magma is rich in Fe and Ti. The Qieganbulake carbonatites were generated by liquid immiscibility of CO2-rich silicate magma without crustal contamination, indicating that the basaltic parental magma is rich in CO2. Additionally, abundant apatite inclusions in the clinopyroxenes (Fig. 4c, d) and phosphate ores indicate the basaltic parental magma of the QMC was also rich in P. Experimental studies have found that when hornblende crystals occur during magma evolution, the magma must contain 2–5 % H2O and the H2O content of the parental magma must exceed 2 % (Botcharnikov et al. Reference Botcharnikov, Almeev, Koepke and Holtz2008; Howarth & Prevec, Reference Howarth and Prevec2013). The QMC contains a lot of H2O-rich minerals, such as hornblende, biotite and hydroxylapatite, indicating that the basaltic parental magma is rich in H2O and the mantle source might be metasomatized by fluids. Therefore, the parental magma of the QMC was likely H2O–CO2–Fe–Ti–P-rich basaltic magma. Large-scale exposed dunite (Mg no. = 95–99; Fig. 2) with a high forsterite percentage (89–91 %) of olivine presenting the characteristics of mantle-origin olivine (Roeder & Emslie, Reference Roeder and Emslie1970; Zhang et al. Reference Zhang, Mahoney, Mao and Wang2006) indicates that the mantle-originated basaltic parental magma did not undergo significant differentiation before it intruded into the magma chamber.
The enriched isotopic signatures of the QMC are most likely derived from metasomatized subcontinental lithospheric mantle sources, or the mixing of metasomatized lithospheric and asthenospheric mantles. The main Zr/Ba values (0.01–0.18) of the Qieganbulake mafic–ultramafic rocks indicate the parental source of the lithospheric mantle, because Ormerod et al. (Reference Ormerod, Hawkesworth, Rogers, Leeman and Menzies1988) pointed out that the Zr/Ba values of mafic rocks derived from lithospheric mantle are less than 0.2. In the La/Ba versus La/Nb diagram (Fig. 15a, after Saunders et al. Reference Saunders, Storey, Kent, Norry, Storey, Alabaster and Pankhurst1992), all the gabbro and clinopyroxenite samples plot into the slab-metasomatized subcontinental lithospheric mantle field, most likely related to slab-derived fluids and sediment input (Fig. 15b, after Woodhead et al. Reference Woodhead, Hergt, Davidson and Eggins2001), similar to the nearby Neoproterozoic Kuluketage mafic–ultramafic layered intrusions, mafic dyke swarm and the Aksu mafic dykes to the west of the No. II mafic–ultramafic intrusive complex (Zhang, C. L. et al. Reference Zhang, Li, Li and Ye2009; Zhang, Z. Y. et al. Reference Zhang, Zhu, Shu, Su and Zheng2009; W. Chen, unpub. Ph.D. thesis, China Univ. Geosciences, 2021). δ13C values of calcites in the Qieganbulake carbonatites (−3.65 to −4.11 ‰; Ye et al. Reference Ye, Li and Lan2013) are slightly higher than ‘normal’ mantle (δ13C = −4.0 to −8.0 ‰), but similar to those of recycled crustal carbon as shown by the carbonatites from the Kerguelan Islands (average at −3.2 ‰) (Ray et al. Reference Ray, Ramesh and Pande1999). This indicates that the mantle source was already enriched in δ13C prior to its generation of magmas, or, alternatively, the carbonatite melt generation preferentially increased its δ13C values. The enriched carbon isotopic composition of the Qieganbulake carbonatite likely reflects its mantle source. The incorporation of recycled inorganic carbon as a result of entrainment of subcontinental lithospheric mantle proposed by Ray et al. (Reference Ray, Ramesh and Pande1999) is plausible, and the δ13C enrichment was most likely derived from carbonates overlying subducted oceanic crust through mantle metasomatism. In addition, the enriched Sr–Nd isotopic ratios (ϵNd(t) = −0.03 to −10.83; (87Sr/86Sr)i = 0.7059–0.7111) reported by Zhang et al. (Reference Zhang, Li, Li, Lu, Ye and Li2007, Reference Zhang, Yang, Wang, Takahashi and Ye2011, Reference Zhang, Zou, Wang, Li and Ye2012 b), Tang et al. (Reference Tang, Zhang, Li, Wang and Ripley2016), Q. Yuan (unpub. Ph.D. thesis, China Univ. Geosciences, 2016) and W. Chen (unpub. Ph.D. thesis, China Univ. Geosciences, 2021) of the c. 810 and 760 Ma mafic–ultramafic layered intrusions and some c. 770 and 735 Ma tholeiitic mafic dykes are similar to those of the QMC. Geochemical characteristics of these mafic rocks indicate that their parental magmas were most likely derived from partial melting of enriched subcontinental lithospheric mantle. This mantle metasomatism event was most likely induced by subduction-related fluids/melts along an active margin of the northern Tarim Block during late Mesoproterozoic to earliest Neoproterozoic time (Zhang et al. Reference Zhang, Yang, Wang, Takahashi and Ye2011, Reference Zhang, Zou, Wang, Li and Ye2012 b). Geochemical characteristics (e.g. enrichment of large ion lithophile elements (LILEs) and LREEs, depletion of high-field-strength elements and HREEs, and enriched Sr–Nd isotopic characteristics) could be ascribed to parental source enrichment (e.g. K-rich and Nb-poor) led by metasomatism of subducted materials (slab-released fluids and/or sediment input) (Fig. 15). Thus, we conclude that the enrichment characteristic of the Qieganbulake basaltic parental magma reflects the enrichment of the mantle source from the subcontinental lithospheric mantle.
(a) La/Ba versus La/Nb discrimination diagram after Saunders et al. (Reference Saunders, Storey, Kent, Norry, Storey, Alabaster and Pankhurst1992); (b) Ba/La versus Th/Yb discrimination diagram after Woodhead et al. (Reference Woodhead, Hergt, Davidson and Eggins2001). HIMU – high-µ; MORB – mid-ocean ridge basalt; OIB – ocean island basalt; CLM – continental lithospheric mantle.

6.d. Metallogenesis of the carbonatite-related disseminated phosphate ores
6.d.1. Crystallization order of minerals in carbonatite magma
The Qieganbulake disseminated carbonatite-related phosphate ores are mainly composed of calcite, apatite and Fe–Ti oxide, as well as a small amount of silicate minerals and baddeleyite (Fig. 3e, h, l, n, o). The mineralization mainly consists of apatite with minor Fe–Ti oxides. According to the compatibility of trace elements and REEs in the above minerals, apatite can concentrate a considerable proportion of Sr and REE contents of the whole-rock (Roeder et al. Reference Roeder, MacArthur, Ma and Palmer1987; Ayers & Watson, Reference Ayers and Watson1993). The REE and Sr contents of the apatites are significantly higher than those of the carbonatites and ores (online Supplementary Material Tables S8, S9), indicating that apatites are an important carrier of Sr and REEs. Geochemical compositions of apatites in carbonatites and ores can reflect their degree of differentiation and the crystallization process (e.g. Buhn et al. Reference Buhn, Wall and Le Bas2001; Belousova et al. Reference Belousova, Griffin, O’Reilly and Fisher2002). Buhn et al. (Reference Buhn, Wall and Le Bas2001) pointed out that the REE characteristics of apatite are related to the evolution of carbonatite magma to different degrees, and apatite crystallized from highly differentiated carbonatite melt has high La/Nd ratios (>1) and La/Yb ratios (>100). The La/Nd ratios (0.63–0.72) and La/Yb ratios (91–152) of apatites in the Qieganbulake carbonatites and/or ores are less than 1 and have a large range of variation, respectively (online Supplementary Material Table S9), which is obviously inconsistent with those of highly differentiated carbonatite (Buhn et al. Reference Buhn, Wall and Le Bas2001). Apatites in ores are enriched in LREEs and depleted in HREEs (Fig. 12), which could be attributed to the immiscibility of silicate magma and carbonatite magma, accompanied by the crystallization of abundant clinopyroxenes, because LREEs are strongly incompatible in clinopyroxene and HREEs are moderately incompatible in clinopyroxene (Hart & Dunn, Reference Hart and Dunn1993; Hauri et al. Reference Hauri, Wagner and Grove1994). The apatites enclosed in clinopyroxenes have higher HREE contents and lower La/Yb ratios than the apatites in the ores (Fig. 12), indicating that carbonatite magma formed at that time was depleted in HREEs, most likely due to abundant crystallization of clinopyroxenes before the formation of carbonatite magma. The La/Yb ratios of the apatites are positively correlated with ∑REE contents and Sm/Yb ratios (Fig. 13b, d), indicating that liquid immiscibility of magma led to the enrichment of LREEs relative to HREEs in the separated carbonatite magma, also accompanied by abundant crystallization of clinopyroxenes. The curved and crenellated borders between the carbonatite and clinopyroxenite indicate that the immiscibly separated carbonatite magma and silicate magma were molten when they intruded, confirming those above conclusions (Ye et al. Reference Ye, Li and Lan2013; Q. Yuan, unpub. Ph.D. thesis, China Univ. Geosciences, 2016; W. Chen, unpub. Ph.D. thesis, China Univ. Geosciences, 2021). The high La/Yb and low La/Nd ratios of the apatites in the carbonatites and/or ores should be attributed to the depletion of HREEs in the immiscibly separated carbonatite magma and the premature crystallization of apatite, respectively, revealing that the separated carbonatite magma had not undergone significant differentiation when apatite crystallized (Buhn et al. Reference Buhn, Wall and Le Bas2001). In addition, the slight negative Eu anomalies of the apatites in the carbonatites and/or ores also confirm that carbonatite magma had not undergone significant differentiation (Fig. 12; Belousova et al. Reference Belousova, Griffin, O’Reilly and Fisher2002). Euhedral to subhedral apatite grains of the disseminated phosphate ores are mainly enclosed in calcite crystals displaying a typical cumulate texture (Figs 3l, 4a, b), with a few of the euhedral apatite grains enclosed in olivine crystals (Fig. 4a), indicating that apatite and olivine crystallized earlier than calcite, and apatite should have crystallized simultaneously with olivine. Fe–Ti oxides and apatite crystals are mainly symbiotic or show an intergrowth texture in the form of mineral aggregates (Fig. 3e), with some Fe–Ti oxide inclusions in olivines (Fig. 4g). Therefore, the crystallization order of minerals in the carbonatite magma generated by liquid immiscibility of CO2-rich silicate magma should be apatite/olivine/Fe–Ti oxides/calcite.
6.d.2. Genesis of carbonatite-related phosphate deposit
The crystallization of apatite was mainly influenced by the composition of the melts (Cawthorn & Walsh, Reference Cawthorn and Walsh1988; Toplis et al. Reference Toplis, Libourel and Carroll1994; Tollari et al. Reference Tollari, Toplis and Barnes2006). Phosphorus is incompatible in silicate minerals and Fe–Ti oxides, and the P content of the residual magma thus starts to increase with further differentiation of the basaltic magma. A high degree of differentiation can result in P2O5 enrichment in the residual magma and trigger saturation of apatite (McBirney & Nakamura, Reference McBirney and Nakamura1973; Cawthorn & Walsh, Reference Cawthorn and Walsh1988; McBirney & Naslund, Reference McBirney and Naslund1990; Song et al. Reference Song, Qi, Hu, Chen, Yu and Zhang2013; She et al. Reference She, Song, Yu, Chen and Zheng2016). Before the liquid immiscibility of CO2-rich silicate magma to form carbonatite magma, there should have been abundant crystallization of clinopyroxenes resulting in the depletion of HREEs in the residual magma. Abundant apatite inclusions in the clinopyroxenes indicate that P2O5 was highly enriched in the highly differentiated magma, directly indicated by massive dunite, and triggered the saturation of apatites before the liquid immiscibility to form carbonatite magma. As shown in Figure 3l, Fe–Ti oxides and apatites are mainly symbiotic or show an intergrowth texture in the form of mineral aggregates, indicating that they were saturated almost simultaneously. Experimental studies demonstrated that the saturation of magnetite will be delayed, because phosphorus can destabilize magnetite and react with Fe3+ to form P–Fe3+ complexes (Gwinn & Hess, Reference Gwinn and Hess1993; Toplis et al. Reference Toplis, Libourel and Carroll1994). Thus, the high Fe3+ content and further differentiation of the parental magma should play an important role in promoting phosphorus enrichment in the residual magma. In addition, the process of further differentiation of the parental magma would lead to the accumulation of abundant volatiles (e.g. H2O, HF), which would also promote the saturation of apatite (Tollari et al. Reference Tollari, Barnes, Cox and Nabil2008). Moreover, the crystallization of abundant clinopyroxenes and Fe–Ti oxides would result in a marked decrease in the P2O5 content required for apatite saturation in the magma (Toplis et al. Reference Toplis, Libourel and Carroll1994; Tollari et al. Reference Tollari, Toplis and Barnes2006). Therefore, when the immiscibility of the highly differentiated residual magma occurred to form carbonatite magma, the residual magma already contained abundant P and Fe3+, accompanied by the crystallization of apatites, Fe–Ti oxides and abundant clinopyroxenes. The carbonatite magma generated by immiscibility of the residual magma should be enriched in abundant P and Fe3+, because the P–Fe3+ complexes will be preferentially enriched in carbonatite magma due to phosphorus being incompatible in silicate magma (Tollari et al. Reference Tollari, Toplis and Barnes2006).
The above research results show that the carbonatite magma separated from silicate magma did not undergo significant differentiation when apatites crystallized. There is a question of whether apatites and Fe–Ti oxides were precipitated directly from the carbonatite magma or from an Fe–Ti–P-rich liquid separated immiscibly from the carbonatite magma. Liquid–liquid immiscibility implies that the interstitial textural relationships between the Fe–P–Ti oxides (Fe–Ti oxides and apatite) and silicates would indicate that the dense Fe–Ti–P-rich melt percolated through the silicate crystal mush to form Fe–Ti–P oxide ores. As Reynolds (Reference Reynolds1985), Zhou et al. (Reference Zhou, Robinson, Lesher, Keays, Zhang and Malpas2005) and Wang & Zhou (Reference Wang and Zhou2013) pointed out, apatites and Fe–Ti oxides are the result of solidification of immiscible melts. However, the euhedral to subhedral apatites of the disseminated phosphate ores are mainly enclosed in calcite crystals displaying a typical cumulate texture (Fig. 3e, l), which excludes that those apatites and minor Fe–Ti oxides were precipitated directly from an Fe–Ti–P-rich liquid separated immiscibly from the carbonatite magma. As shown in Figure 13, the La/Yb ratios and Sr contents show obvious positive correlation with ∑REE contents, and the La/Yb ratios show obvious positive correlation with Sr contents and Sm/Yb ratios, indicating that apatite crystallized continuously in the carbonatite magma separated immiscibly from silicate magma (Yegorov, Reference Yegorov1984; Zaitsev & Bell, Reference Zaitsev and Bell1995). W. Chen (unpub. Ph.D. thesis, China Univ. Geosciences, 2021) reported that the oxygen fugacity conditions (fO2 = 10−20.05 to 10−21.36) of the immiscibly separated carbonatite magma were high, as indicated by the crystallization of Fe–Ti oxides enclosed in calcites and olivines at that time (Fig. 4f–g). However, P–Fe3+ complex enriched carbonatite magma would be accompanied by abundant crystallization of Fe–Ti oxides under high oxygen fugacity conditions, resulting in abundant crystallization of apatites due to the marked decrease in P2O5 content required for apatite saturation in the carbonatite magma (Toplis et al. Reference Toplis, Libourel and Carroll1994; Tollari et al. Reference Tollari, Toplis and Barnes2006). Therefore, the formation process of the Qieganbulake carbonatite-related phosphate ores could be roughly divided into three stages (Fig. 16): (1) the high differentiation of the carbonated basaltic parental magma (such as abundant crystallization of olivine and clinopyroxene) derived from the partial melting of enriched subcontinental lithospheric mantle leading to the formation of CO2–Fe–Ti–P-enriched residual magma; (2) the formation of a P–Fe3+ complex enriched carbonatite magma generated by liquid immiscibility of CO2–Fe–Ti–P-enriched residual magma; (3) the abundant crystallization of apatites and Fe–Ti oxides in the P–Fe3+ complex enriched carbonatite magma under high oxygen fugacity conditions.
A schematic cartoon showing the formation model of the Qieganbulake carbonatite-related phosphate ore.

6.e. Genetic and ore-forming tectonic setting
The AlVI/AlIV (ratio of Al in a hexahedron to Al in a tetrahedron) ratios of clinopyroxenes from the Qieganbulake clinopyroxenites range from 0.28 to 0.83, indicating that the pressure during the crystallization process of clinopyroxene was low (Zhang et al. Reference Zhang, Yang, Wang, Takahashi and Ye2011; W. Chen, unpub. Ph.D. thesis, China Univ. Geosciences, 2021), similar to the Beishan mafic–ultramafic rocks formed in a rift setting (Su et al. Reference Su, Qin, Sakyi, Liu, Tang, Malaviarachchi, Xiao, Sun, Dai and Hu2011, Reference Su, Qin, Santosh, Sun and Tang2013). Alz (percentage of tetrahedral sites occupied by AlIV) versus TiO2 (wt %) in clinopyroxenes from the Qieganbulake clinopyroxenites (Zhang et al. Reference Zhang, Li, Li, Lu, Ye and Li2007; W. Chen, unpub. Ph.D. thesis, China Univ. Geosciences, 2021) exhibits the chemical signature of continental rift-related igneous rocks (Loucks, Reference Loucks1990). Additionally, the samples of the nearby coeval Kawuliuke intrusive complex (810 Ma; Fig. 1b) all plot in the intraplate basalt area (W. Chen, unpub. Ph.D. thesis, China Univ. Geosciences, 2021; Chen et al. Reference Chen, Lü, Yuan, Huang and Cao2022) in the 2Nb–Zr/4–Y discrimination diagram (Meschede, Reference Meschede1986), which is similar to the Guibei 760 Ma gabbro formed in an intraplate rift setting (Zhao & Cawood, Reference Zhao and Cawood2012). Moreover, it has long been recognized that carbonatite complexes are typically present in anorogenic settings (e.g. Le Bas, Reference Le Bas1977; Bailey, Reference Bailey, Storey, Alabaster and Pankhurst1992). More recently, it has been proposed that many carbonatites are linked in space and time with large igneous provinces, which is as equally robust as the rift–carbonatite link (Ernst, Reference Ernst2008; Ernst & Bell, Reference Ernst and Bell2010). Therefore, the above evidence suggests that the QMC should have formed in a continental rift setting. The parent magmas of the Kawuliuke and Qieganbulake contemporaneous intrusive complexes were derived from metasomatized subcontinental lithospheric mantle sources (Fig. 1; Han et al. Reference Han, Xiao, Su, Sakyi, Ao, Zhang, Wan, Song and Wang2016; W. Chen, unpub. Ph.D. thesis, China Univ. Geosciences, 2021; Chen et al. Reference Chen, Lü, Yuan, Huang and Cao2022), but the unique physical properties of the continental lithosphere enabled them to retain previous magmatic tectonic events, such as early subduction (Zhang et al. Reference Zhang, Stephenson, O’Reilly, McCulloch and Norman2001; Sprung et al. Reference Sprung, Schuth, Münker and Hoke2007; Chen et al. Reference Chen, Lü, Cao and Ai2019 a). Therefore, although the Qieganbulake complex was formed in a continental rift setting, the whole-rock trace-element compositions of the QMC should show arc signatures, such as enrichment in LILEs, and depletion in Nb, Ta and P elements. So, this is consistent with all the evidence for a source that was enriched by subduction in earliest Neoproterozoic time.
It is interesting that most apatite grains enclosed in minerals (e.g. olivine, clinopyroxene) from the Qieganbulake and Kawuliuke complexes have variable ϵNd(t) values at roughly constant initial Sr isotopic ratios, defining an unusual ‘vertical array’ in the Nd–Sr isotope plot (Fig. 10; Ye et al. Reference Ye, Li and Lan2013; Chen et al. Reference Chen, Lü, Yuan, Huang and Cao2022). Zhang et al. (Reference Zhang, Zou, Wang, Li and Ye2012 b), Ye et al. (Reference Ye, Li and Lan2013) and Chen et al. (Reference Chen, Lü, Yuan, Huang and Cao2022) reported that mid-Neoproterozoic (830–760 Ma) mafic–ultramafic rocks in the TC show a wide range in ϵNd(t) values from −12.5 to +6.0. The large range in ϵNd(t) values of the magmatic rocks in the Kuluketage block can be best explained by the mixing of melts derived from subcontinental lithospheric mantle with enriched ϵNd(t) values and asthenospheric mantle with depleted ϵNd(t) values, indicating that the ancient subcontinental lithospheric mantle of the TC was probably metasomatized by underplated materials of the asthenospheric mantle to different degrees.
7. Conclusions
The following conclusions can be drawn from this study: (1) Petrography, mineral compositions and new geochronological data suggest that the QMC was emplaced synchronously at c. 810 Ma, accompanied by the carbonatite-related phosphorus mineralization; (2) geochemical characteristics and Sr–Nd–Hf–S isotopes, in combination with mineral compositions and previous research, reveal that the QMC formed via extensive crystal fractionation/cumulation and liquid immiscibility of a carbonated tholeiitic magma derived from partial melting of enriched subcontinental lithospheric mantle previously modified by slab-released fluid and sediment input in a continental rift setting; (3) the coupled enriched Sr–Nd–Hf isotopic signatures, in combination with previous research, suggest that the enriched subcontinental lithospheric mantle could have been metasomatized by asthenospheric mantle melts to different degrees; (4) the Qieganbulake carbonatite-related phosphate ores were the product of normal fractional crystallization/cumulation of P–Fe3+ complex enriched carbonatite magma in high oxygen fugacity conditions, which was generated by liquid immiscibility of CO2–Fe–Ti–P-rich residual magma undergoing high differentiation.
Acknowledgements
We are grateful to journal editor (Dr Tim Johnson), associate editor (Dr Kathryn Goodenough) and another two anonymous reviewers for their critical and constructive comments which substantially improved the version of the manuscript. This research was funded by the China Geological Survey [Nos. DD20190154 and DD20221689], the National Key R&D Programme of China [No. 2017YFC0602404] and the 305 Project of the State Science and Technology Support Programme [Grant No. 2011BAB06B04-05].
Supplementary material
To view supplementary material for this article, please visit https://doi.org/10.1017/S0016756822001194