




No CrossRef data available.
The Measurement of Real-Time Perceptions of Financial Stress: Implications for Political Science
Published online by Cambridge University Press: 27 October 2017
Abstract
An abstract is not available for this content. As you have access to this content, full HTML content is provided on this page. A PDF of this content is also available in through the ‘Save PDF’ action button.
Keywords
Information
- Type
- Notes and Comments
- Information
- Copyright
- © Cambridge University Press 2017
Footnotes
*
Institute for Quantitative Social Science, Harvard University; International Politics, City, University of London, and Hertie School of Governance (email: gandrud@iq.harvard.edu); Hertie School of Governance (email: hallerberg@hertie-school.org). Thanks to Nicole Rae Baerg, Vincent Arel-Bundock, Ronen Palan, Stefano Pagliari, David Singer, participants at the 2015 American Political Science Association Annual Conference, the 2015 International Political Economy Society Conference, City, University of London work in progress series, and two anonymous reviewers for helpful comments. We also thank Sahil Deo and Christian Franz for early research assistance. Our research is generously supported by the Deutsche Forschungsgemeinschaft (No. HA5996/2-1). Data replication sets are available in Harvard Dataverse at: https://dx.doi.org/10.7910/DVN/GSJO9Q and an online appendix is available at: https://doi.org/10.1017/S0007123417000291.
1 Reinhart and Rogoff Reference Reinhart and Rogoff2009; Reinhart and Rogoff Reference Reinhart and Rogoff2010.
2 Laeven and Valencia Reference Laeven and Valencia2013, along with their predecessors.
3 Reinhart and Rogoff Reference Reinhart and Rogoff2009; Reinhart and Rogoff Reference Reinhart and Rogoff2010, 10.
4 Laeven and Valencia Reference Laeven and Valencia2013, 228. Please see the Appendix for more details.
5 Chaudron and Haan Reference Chaudron and Haan2014.
6 Gandrud and Hallerberg Reference Gandrud and Hallerberg2015.
7 Laeven and Valencia Reference Laeven and Valencia2013, footnote 19.
8 Fielding and Rewilak Reference Fielding and Rewilak2015; Herrera, Ordoñez, and Trebesch Reference Herrera, Ordonez and Trebesch2014.
9 Danielsson, Valenzuela, and Zer Reference Danielsson, Valenzuela and Zer2015.
10 Keefer Reference Keefer2007; Rosas Reference Rosas2006; Rosas Reference Rosas2009.
11 Reischmann Reference Reischmann2016.
12 Ha and Kang Reference Ha and Kang2015.
13 Gandrud Reference Gandrud2013; Gandrud Reference Gandrud2014; Kleibl Reference Kleibl2013.
14 Broz Reference Broz2013.
15 Chwieroth and Walter Reference Chwieroth and Walter2015; Crespo-Tenorio, Jensen, and Rosas Reference Crespo-Tenorio, Jensen and Rosas2014; Pepinsky Reference Pepinsky2012. For an additional review of the literature, see Gandrud and Hallerberg (Reference Gandrud and Hallerberg2015), 1–3 and the Appendix.
16 Romer and Romer Reference Romer and Romer2015.
17 See e.g., Minhas, Ulfelder, and Ward Reference Minhas, Ulfelder and Ward2015. Please see the Appendix and also Kliesen, Owyang, and Vermann (Reference Kliesen, Owyang and Vermann2012) for further critical discussions.
19 Lodhi et al. Reference Lodhi, Saunders, Shawe-Taylor, Cristianini and Watkins2002; Scholkopf, Smola, and Muller Reference Scholkopf, Smola and Muller1998; Spirling Reference Spirling2012.
20 See Grimmer and Stewart Reference Grimmer and Stewart2013.
21 Lodhi et al. Reference Lodhi, Saunders, Shawe-Taylor, Cristianini and Watkins2002; Scholkopf, Smola, and Muller Reference Scholkopf, Smola and Muller1998. See also Zhang, Wang, and Ma (Reference Zhang, Wang and Ma2010), 6531–7 and Spirling (Reference Spirling2012), who introduced KPCA into political science with a study of Native American–US treaties.
22 The kernels are similar to n-grams, though they do not need to be complete words. Following Spirling (Reference Spirling2012), we used kernels with a length of five, i.e., those that are five letters long. See also Lodhi et al. (Reference Lodhi, Saunders, Shawe-Taylor, Cristianini and Watkins2002), who demonstrate that in English, string lengths between four and seven are often optimal. See the Appendix for a comparison of estimates made using other lengths. The results were very similar regardless of kernel length.
23 We conducted KPCA with the KPCA function from the R package kernlab (Karatzoglou et al. Reference Karatzoglou, Smola, Hornik and Zeileis2004).
24
 $${{x\,{\minus}\,{\rm min}(X)} \over {{\rm max}(X)\,{\minus}\,{\rm min}(X)}}$$
, where
 $${\bf X}$$
is the vector of the first principal component and
 $$x$$
is an individual value from this vector.
25 Grimmer and Stewart Reference Grimmer and Stewart2013, 267.
26 Reinhart and Rogoff Reference Reinhart and Rogoff2009.
27 Laeven and Valencia Reference Laeven and Valencia2013 identify eight ‘borderline’ crises in this period, in that the countries almost meet their systemic banking crisis definition because they only used two rather than three policy responses. These are: France, Hungary, Italy, Portugal, Russia, Slovenia, Sweden and Switzerland.
28 Romer and Romer Reference Romer and Romer2015.
29 We use Table 1 in Romer and Romer (Reference Romer and Romer2015) to recreate their dataset. The Laeven and Valencia data are from: https://www.imf.org/external/pubs/cat/longres.aspx?sk=26015.0. Reinhart and Rogoff’s data were downloaded from: http://www.carmenreinhart.com/data/browse-by-topic/topics/7, accessed May 2015.
30 Romer and Romer (Reference Romer and Romer2015) do not include the most recent crisis in their sample, as they did not collect data past 2007. We rescale their sixteen-point scale to be between 0 and 1. It should be noted that Romer and Romer (Reference Romer and Romer2015) only cover a selection of OECD countries. Reinhart and Rogoff (Reference Reinhart and Rogoff2009) only cover seventy countries, and their data have been updated least recently.
31 Romer and Romer Reference Romer and Romer2015.
32 They classify Iceland as having a ‘minor crisis’ in the second half of 2006 and a ‘credit disruption’ in the first half of 2007.
33 0.59 and 0.52, respectively. This is a statistically significant difference using one-sided and two-sided t-tests.
34 See the Appendix for a discussion of the distributions of FinStress scores in developed vs. developing economies.
35 Laeven and Valencia Reference Laeven and Valencia2013, 227.
36 See: http://www.imf.org/external/pubs/ft/survey/so/2010/car081710a.htm, accessed November 2015.
37 Crespo-Tenorio, Jensen, and Rosas Reference Crespo-Tenorio, Jensen and Rosas2014.
38 Funke, Schularick, and Trebesch Reference Funke, Schularick and Trebesch2015.
39 Hernández and Kriesi Reference Hernández and Kriesi2015; Mainwaring, Gervasoni, and Espana-Najera Reference Mainwaring, Gervasoni and Espana-NajeraForthcoming.
40 Crespo-Tenorio, Jensen, and Rosas Reference Crespo-Tenorio, Jensen and Rosas2014; Funke, Schularick, and Trebesch Reference Funke, Schularick and Trebesch2015.
41 Hernández and Kriesi Reference Hernández and Kriesi2015.
42 Laeven and Valencia Reference Laeven and Valencia2013.
43 Emanuele Reference Emanuele2015.
44 We are solely interested in comparing estimates between the stress measures. Given our small sample size, other effects were consigned to the error term. The sample used is that shown in Figure 3.
45 Following McGrath (Reference McGrath2015), we drop observations for years after the start of a crisis. Given the arbitrary five-year crisis termination coding used by Laeven and Valencia (Reference Laeven and Valencia2013) and our limited sample, all crises were right-censored; we were not able to examine the effect of coming out of a crisis.
46 Gandrud and Hallerberg, Reference Gandrud and Hallerberg2017.
47 Leek and Peng Reference Leek and Peng2015.
48 In the Appendix, we compare FinStress made with different sub-samples. These are very similar indicating that the method could be used to update an index when new documents become available within a consistently styled corpus.
References
Broz, J. Lawrence. 2013. Partisan Financial Cycles. In Politics in the New Hard Times: The Great Recession in Comparative Perspective, edited by David L. Lake and Miles Kahler, 75–101. Ithaca, NY: Cornell University Press.Google Scholar
Chaudron, Raymond, and Haan, Jakob de. 2014. Dating Banking Crises Using Incidence and Size of Bank Failures: Four Crises Reconsidered. Journal of Financial Stability 63–75.Google Scholar
Chwieroth, Jeffrey, and Walter, Andrew. 2015. Great Expectations, Veto Players, and the Changing Politics of Banking Crises. LSE Systemic Risk Centre Discussion Paper Series. Avaliable from http://www.systemicrisk.ac.uk/publications/discussion-papers/great-expectations-veto-players-and-changing-politics-banking-crises, accessed 30 June 2017.Google Scholar
Crespo-Tenorio, Adriana, Jensen, Nathan M., and Rosas, Guillermo. 2014. Political Liabilities: Surviving Banking Crises. Comparative Political Studies 47 (7):1047–1174.Google Scholar
Danielsson, Jon, Valenzuela, Marcela, and Zer, Ilknur. 2015. Learning from History: Volatility and Financial Crises. LSE Systemic Risk Centre Working Paper, September. Available from http://www.riskresearch.org/files/DanielssonValenzuelaZer2015.pdf, accessed 30 June 2017.Google Scholar
Emanuele, Vincenzo. 2015. Dataset of Electoral Volatility and its Internal Components in Western Europe (1945–2015). Italian Center for Electoral Studies. Available from http://dx.doi.org/10.78S2/1112, accessed 15 May 2016.Google Scholar
Fielding, David, and Rewilak, Johan. 2015. Credit Booms, Financial Fragility and Banking Crises. Economics Letters 136:233–236.Google Scholar
Funke, Manuel, Schularick, Moritz, and Trebesch, Christoph. 2015. Politics in the Slump: Polarization and Extremism after Financial Crises, 1870–2014. Working Paper. Available from http://www.econ.cam.ac.uk/people/cto/km418/partIIb/Reading/Kane_170221.pdf, accessed 30 June 2017.Google Scholar
Gandrud, Christopher. 2013. The Diffusion of Financial Supervisory Governance Ideas. Review of International Political Economy 20 (4):881–916.Google Scholar
Gandrud, Christopher. 2014. Competing Risks and Deposit Insurance Governance Convergence. International Political Science Review 35 (2):197–215.Google Scholar
Gandrud, Christopher. 2017. “Replication Data for: The Measurement of Real-Time Perceptions of Financial Stress: Implications for Political Science”, https://dx.doi.org/10.7910/DVN/GSJO9Q, Harvard Dataverse, V1.Google Scholar
Gandrud, Christopher, and Hallerberg, Mark. 2015. When All is Said and Done: Updating ‘Elections, Special Interests, and Financial Crisis’. Research and Politics 2 (3):1–9.Google Scholar
Gandrud, Christopher, and Hallerberg, Mark. 2017. Interpreting Fiscal Accounting Rules in the European Union. Journal of European Public Policy 24 (6):832–851.Google Scholar
Grimmer, Justin, and Stewart, Brandon M.. 2013. Text as Data: The Promise and Pitfalls of Automatic Content Analysis Methods for Political Texts. Political Analysis 21 (3):267–297.Google Scholar
Ha, Eunyoung, and Kang, Myung-koo. 2015. Government Policy Responses to Financial Crises: Identifying Patterns and Policy Origins in Developing Countries. World Development 68:264–281.Google Scholar
Hernández, Enrique, and Kriesi, Hanspeter. 2015. The Electoral Consequences of the Financial and Economic Crisis in Europe. European Journal of Political Research 55 (2):203–224.Google Scholar
Herrera, Helios, Ordonez, Guillermo, and Trebesch, Christoph. 2014. Political Booms, Financial Crises. Cambridge, MA: National Bureau of Economic Research. Available from http://www.nber.org/papers/w20346.Google Scholar
Karatzoglou, Alexandros, Smola, Alex, Hornik, Kurt, and Zeileis, Achim. 2004. An S4 Package for Kernel Methods. Journal of Statistical Software 11 (9):1–20. http://www.jstatsoft.org/v11/i09/.Google Scholar
Keefer, Philip. 2007. Elections, Special Interests, and Financial Crisis. International Organization 61 (3):607–641.Google Scholar
Kleibl, Johannes. 2013. The Politics of Financial Regulatory Agency Replacement. Journal of International Money and Finance 75 (2):552–566.Google Scholar
Kliesen, Kevin L., Owyang, Michael T., and Vermann, E. Katarina. 2012. Disentangling Diverse Measures: A Survey of Financial Stress Indexes. Federal Reserve Bank of St. Louis Review, September/October:1–31. Available from https://research.stlouisfed.org/publications/review/12/09/369-398Kliesen.pdf.Google Scholar
Laeven, Luc, and Valencia, Fabián. 2013. Systemic Banking Crisis Database. IMF Economic Review 61 (2):225–270.Google Scholar
Leek, Jeffrey T., and Peng, Roger D.. 2015.
P Values Are Just the Tip of the Iceberg. Nature 520 (April):612.Google Scholar
Lodhi, Huma, Saunders, Craig, Shawe-Taylor, John, Cristianini, Nello, and Watkins, Chris. 2002. Text Classification Using String Kernels. The Journal of Machine Learning Research 2:419–444.Google Scholar
Mainwaring, Scott, Gervasoni, Carlos, and Espana-Najera, Annabella.
Forthcoming. Extra- and Within-System Electoral Volatility. Party Politics 1–13.Google Scholar
McGrath, Liam F. 2015. Estimating Onsets of Binary Events in Panel Data. Political Analysis 23 (4):534–549.Google Scholar
Minhas, Shahryar, Ulfelder, Jay, and Ward, Michael D. 2015. Mining Texts To Efficiently Generate Global Data On Political Regime Types. Research and Politics 2 (3):1–8.Google Scholar
Pepinsky, Thomas B. 2012. The Global Economic Crisis and the Politics of Non-Transitions. Government and Opposition 47 (2):135–161.Google Scholar
Reinhart, Carmen, and Rogoff, Kenneth. 2009. This Time is Different: Eight Centuries of Financial Folly. Princeton, NJ: Princeton University Press.Google Scholar
Reinhart, Carmen, and Rogoff, Kenneth. 2010. This Time is Different Chartbook: Country Histories on Debt, Default, and Financial Crises. Cambridge, MA: National Bureau of Economic Research. Available from http://www.nber.org/papers/w15815; http://www.carmenreinhart.com/data/, accessed February 2014.Google Scholar
Reischmann, Markus. 2016. Creative Accounting and Electoral Motives: Evidence from OECD Countries. Journal of Comparative Economics 44 (2):243–257. http://www.sciencedi rect.com/science/article/pii/S0147596715000591.Google Scholar
Romer, Christina, and Romer, David. 2015. New Evidence on the Impact of Financial Crises in Advanced Countries (April):1–65. Available from http://eml.berkeley.edu//~cromer/RomerandRomerFinancialCrises.pdf, accessed April 2015.Google Scholar
Rosas, Guillermo. 2006. Bagehot or Bailout? An Analysis of Government Responses to Banking Crises. American Journal of Political Science 50 (1):175–191.Google Scholar
Rosas, Guillermo. 2009. Curbing Bailouts: Bank Crises and Democratic Accountability in Comparative Perspective. Ann Arbor: University of Michigan Press.Google Scholar
Scholkopf, B., Smola, A., and Muller, K.. 1998. Nonlinear Component Analysis as a Kernel Eigenvalue Problem. Neural Computation 10:1299–1319.Google Scholar
Spirling, Arthur. 2012. U.S. Treaty Making with American Indians: Institutional Change and Relative Power, 1784–1911. American Journal of Political Science 56 (1):84–97.Google Scholar
Zhang, Rui, Wang, Wenjian, and Ma, Yichen. 2010. Approximations of the Standard Principal Components Analysis and Kernel PCA. Expert Systems with Applications 37 (9):6531–6537.Google Scholar
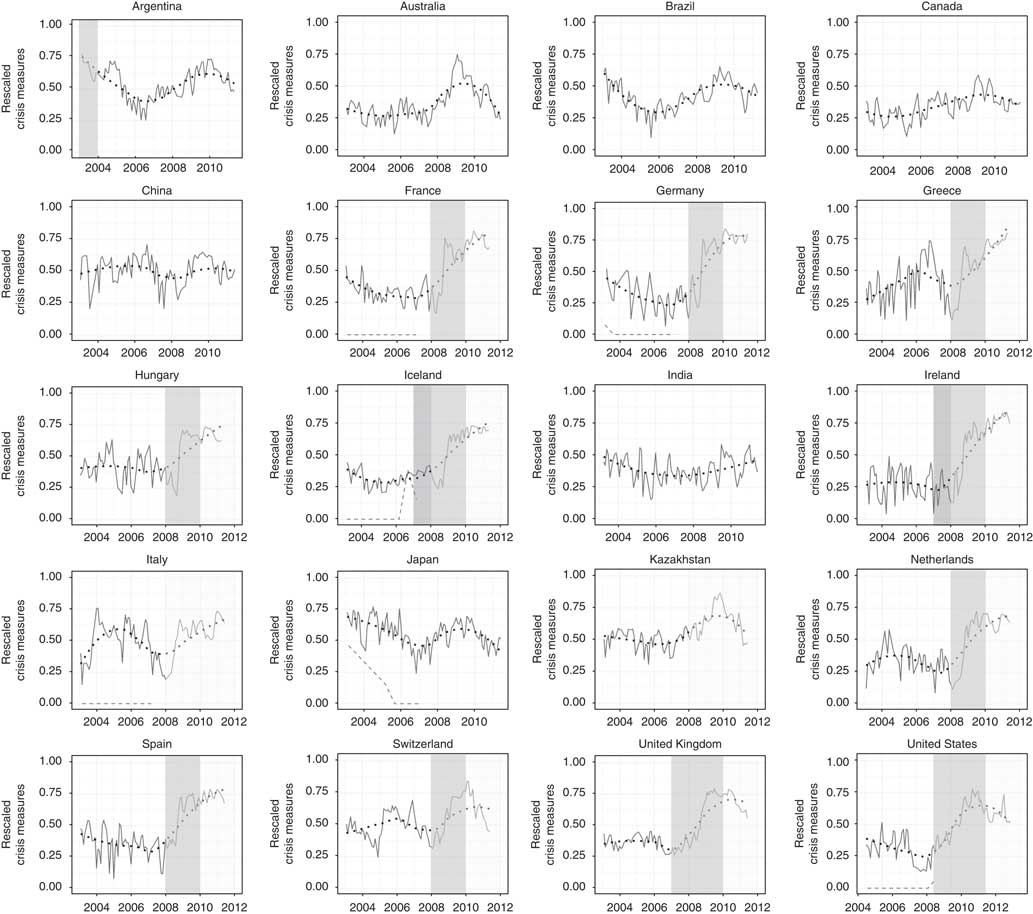
Fig. 1 Comparing perceptions of financial market conditions to Laeven and Valencia (2013), Reinhart and Rogoff (2009), and Romer and Romer (2015) Note: Solid lines show the FinStress Index. Dotted lines represent a loess smoother of these series. Dashed lines show the (rescaled) scores from Romer and Romer (2015). The lightest shaded areas indicate periods that Laeven and Valencia (2013) classify as systemic banking crises. Crises are automatically terminated at the end of 2011 as the series does not extend beyond this point. The darkest shaded areas indicate periods that Reinhart and Rogoff (2009) classify as banking crises. Crises are automatically terminated at the end of 2009 due to the series not extending beyond this point. Areas with medium darkness shading indicate periods where a crisis is recorded for both measures.
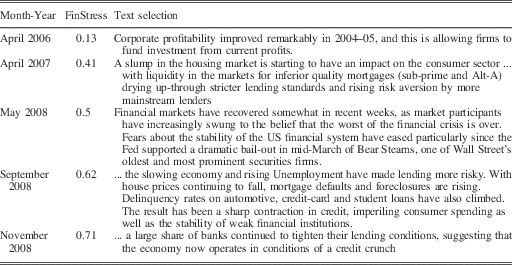
Table 1 Portions of Selected EIU Reports for the United States (2006–2008)
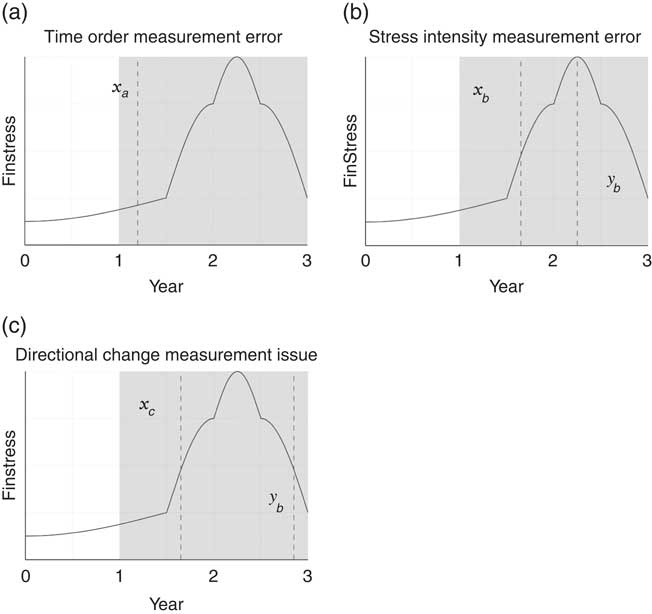
Fig. 2 Hypothetical scenarios of error in the measurement of financial market stress at elections using an annual binary measure vs. FinStress Note: Shaded areas indicate years classified as a crisis by a hypothetical binary crisis measure. Dashed vertical lines indicate an election.
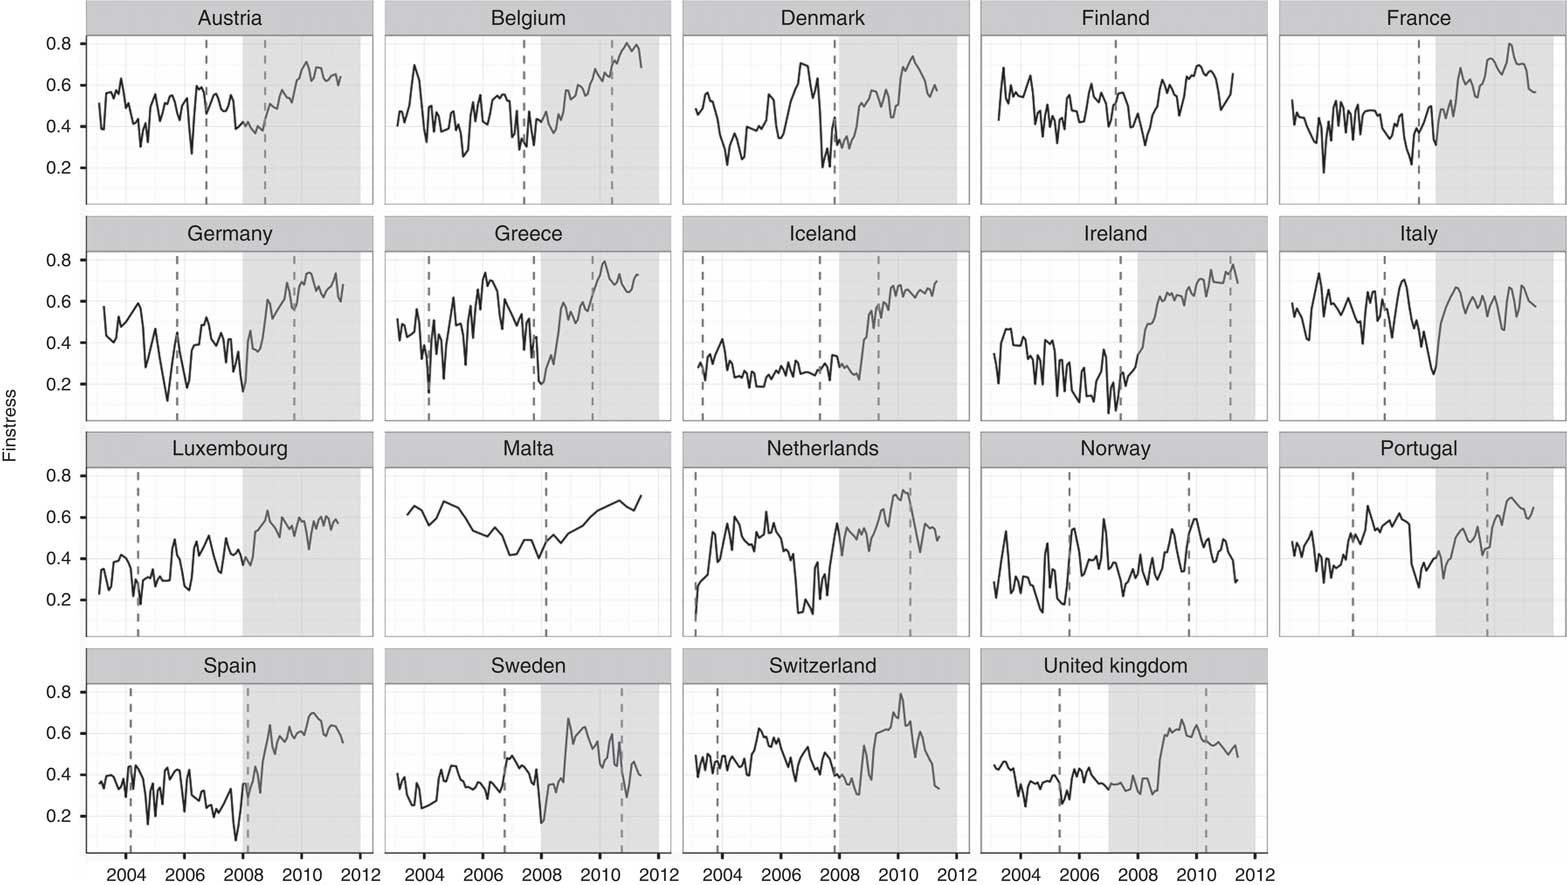
Fig. 3 Comparing national election timing, FinStress, and Laeven and Valencia’s (2013) Banking Crisis Measure in Europe Note: Dashed vertical lines indicate national government elections. Lightly shaded areas represent Laeven and Valencia (2013) banking crisis periods.
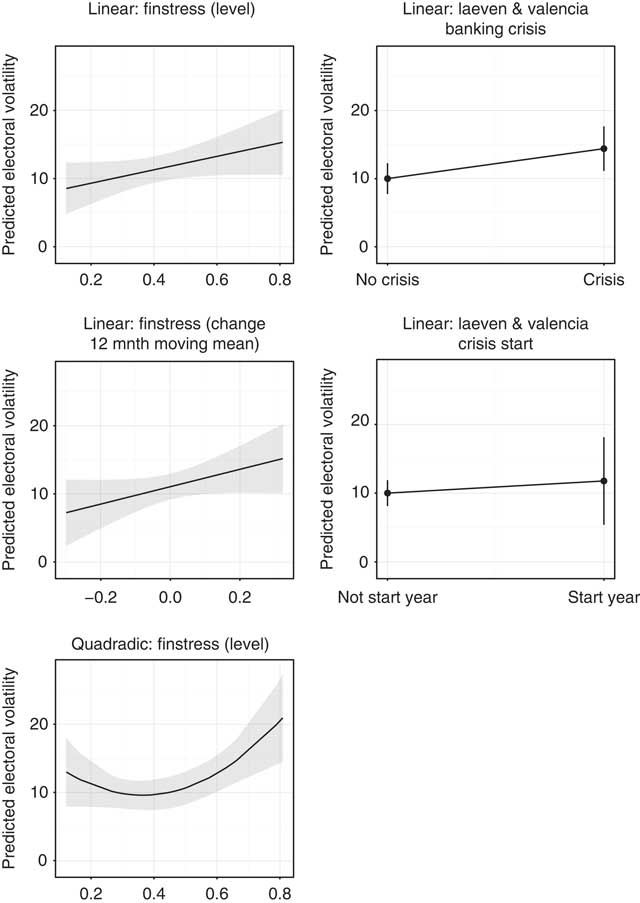
Fig. 4 Predicted electoral volatility for representative levels of FinStress and Laeven and Valencia (2013) Banking Crisis Note: shaded regions/vertical lines represent 95 per cent confidence intervals.

Gandrud and Hallerberg supplementary material
Online Appendix

PDF
1 MB
 You have
Access
- 1
- Cited by
How do politicians and voters respond to financial market stress, and with what political effects? Previous research addressing these questions lacks a crucial variable: a continuous, real-time indicator of the level of financial market stress that policy makers and voters perceived. We need a measure of actors’ contemporary perceptions of financial market conditions to understand why they made a given choice and with what effects.
Previous binary crisis measures are constructed post hoc, so tend to be biased towards severe crises and away from circumstances in which governments effectively responded to emerging trouble. As such, they suffer from clear selection bias. Annual post hoc measures do not necessarily capture conditions as they were perceived at the time of events such as elections. As dichotomous indicators, they do not measure crisis severity or how it varies over time. They use ad hoc methods to determine when crises have ended. Previous continuous measures of financial market stress are less common and suffer from other problems. They capture quantities whose importance, measurement, and reporting varies significantly across countries and over time.
To overcome these issues, we develop a continuous measure of real-time perceptions of financial market stress with a kernel principal component analysis (KPCA) of detailed qualitative data, namely monthly Economist Intelligence Unit (EIU) reports. We call it the EIU Perceptions of Financial Market Stress Index, or FinStress for short. FinStress enables new political research possibilities. As a continuous measure, it could be used to examine which policies can effectively prevent or reduce extreme stress, and which political conditions are conducive to implementing these policies. As a comparable continuous monthly indicator, FinStress could be used to test hypotheses that rely on sub-annual data and follow the intensity of stress over time.
Here we provide examples for studying the impact of financial market stress on voters’ choices and on revisions to European Union government budget figures. We thus contribute to the wider methodological toolkit by showing how KPCA can be used to summarize vast quantities of similarly formatted qualitative texts into continuous cross-sectional time-series indicators.
PREVIOUS MEASURES AND THEIR USE IN RESEARCH
Binary Measures
Researchers studying the politics of financial crises mostly rely on two sources of cross-country information about crises: Reinhart and RogoffFootnote 1 and Laeven and Valencia.Footnote 2 Reinhart and Rogoff classify countries as being in crisis if they experience at least one type of event: (1) one or more bank run, closure, merger or public sector takeover and/or (2) closure, merger, takeover or large-scale public assistance of an important financial institution that marks the start of a string of similar events.Footnote 3 Laeven and Valencia take a similar approach that emphasizes public interventions. A country-year is in crisis when there is both significant distress in the banking system and policy makers respond with significant interventions.Footnote 4
These binary crisis indicators come from detailed comparative work that identifies key features of crises. Yet they present a number of problems for studying political behavior. Crises are identified post hoc by researchers who know what happened after the fact. Financial market stress that policy makers successfully address, and therefore prevent a crisis, is not included. Similarly, stress that a government temporarily dampens through unsustainable policy measures, only to flare up later, is not recorded. The measures are dichotomous: they do not indicate crisis severity, or how it changes over time. Having an annual dichotomous measure also means that measurement errors – incorrectly timing the start or end of a crisis – can bias statistical model estimates.
There are large inconsistencies between the timing of crises in the Laeven and Valencia and Reinhart and Rogoff datasets.Footnote 5 Moreover, there are significant differences in crisis timing between different versions of the Laeven and Valencia data.Footnote 6 While the measures use precise definitions of when a crisis started, the reasons for dating the end of a crisis are either unstated, as in the case of Reinhart and Rogoff, or are ad hoc. Laeven and ValenciaFootnote 7 determine that a crisis has concluded when real GDP and real credit growth are positive for two years, or five years have elapsed from the crisis start year.
Despite these shortcomings, the indicators have been widely employed in the literature. Fielding and Rewilak and Herrera, Ordoñez, and Trebesch use Laeven and Valencia’s indicator as a dependent variable to understand how capital flow bonanzas affect the probability of crises occurring.Footnote 8 Danielsson, Valenzuela and Zer use Reinhart and Rogoff to understand how stock price volatility predicts crises.Footnote 9 Keefer and Rosas use earlier versions of the Laeven and Valencia dataset to identify periods of crisis and to argue that electoral competitiveness affected policy responses.Footnote 10 Reischmann employs the Laeven and Valencia measure to examine the electoral effects on ‘creative public budget accounting’ during crises.Footnote 11 Ha and Kang use Laeven and Valencia to find that developing country governments respond to crises with fiscal and monetary tightening, though this is moderated by political constraints.Footnote 12 Gandrud and Kleibl combine the two data sources to understand how financial regulatory structures are changed after crises.Footnote 13 Broz integrates the datasets to find a ‘partisan financial cycle’.Footnote 14 Crespo-Tenorio, Jensen and Rosas, and Chwieroth and Walter, as well as Pepinsky use the datasets in their research on the political effects of crises.Footnote 15
Continuous Measures
There are less frequently used approaches to measuring financial stress that aim to code extreme stress as well as continuous variation in severity over time. For example, Romer and Romer use a sixteen-point scale of the cost of credit intermediation to provide an indication of stress intensity. They code twenty-four countries using information from the Organisation for Economic Co-operation and Development’s (OECD’s) semi-annual Economic Outlook reports from 1967 to 2007. Relying on contemporaneous reports allows for the construction of a real-time measure of credit market distress and addresses potential problems with ex post coding.Footnote 16
While their approach is an improvement over previous work, it is limited. First, their data source confines them to a relatively small sample of OECD countries. Secondly, because their measure is laborious and time consuming to create and update, even if there were a more encompassing corpus, applying the method would be costly. Thirdly, human coders can introduce well-known problems of inter-coder reliability and unreproducibility.Footnote 17
CREATING THE FINSTRESS INDEX
We overcome many of these problems by estimating real-time perceptions of financial market stress through machine classification of EIU reports.Footnote 18 Our method uses KPCAFootnote 19 of monthly country reports from the EIU to create a monthly index for 186 countries from 2003 through 2011.
Why the EIU?
The EIU compiles real-time, third-party qualitative assessments of financial market conditions within country-time contexts. Reports are released at regular monthly or, for a small subset of countries, quarterly intervals. These reports contain perceptions of economic conditions and represent an important channel of dissemination to public and private actors. They form a large corpus – more than 20,000 texts – of reports for more than 180 countries over the period 1997–2011. From 2003, they follow a consistent style and format, thus minimizing the extent to which text analysis picks up stylistic features, rather than information on financial market stress. The regularity and frequency of reporting for such a large group of countries in a consistent format distinguishes the EIU from other sources of financial information that we might analyse, chiefly newspaper reports. To take full advantage of format comparability we concentrate on data from 2003.
Summarizing Financial Market Stress in the EIU
To develop an index that classifies financial conditions on a continuous more-stressed/less-stressed spectrum for as many country-months as possible, we need an efficient way to summarize the vast quantity of information in the EIU reports. We first collected and pre-processed the EIU texts – focusing specifically on sections regarding banking and finance (more details are available in the Appendix). We then used KPCA to place the texts onto a financial market stress spectrum.
In political science, texts are frequently summarized using unordered ‘bags-of-words’ approaches that aim to find clusters of topics within texts or clusters of texts around topics.Footnote 20 We would like to preserve word order in our texts. Many financial terms such as ‘credit growth’ and ‘borrowing costs’ have different interpretations depending on the adjectives that modify them; consider, for example, ‘slowing credit growth’ vs. ‘expanding credit growth’ or ‘falling borrowing costs’ vs. ‘increasing borrowing costs’. Likewise, adjectives can have very different implications for describing market conditions depending on the nouns that they modify. For example, ‘increasing’ can indicate worsening conditions – for example, ‘increasing non-performing loans’ – or improving conditions – for example, ‘increasing lending’. A bags-of-words approach treating each word as having meaning as an individual unit, rather than in ordered associations with other words, would not adequately capture commonly used and radically different meanings.
KPCA – developed by Scholkopf, Smola, and Muller and Lodhi et al. – allows us to address these issues. This approach can extract structure from our likely high-dimensional EIU corpus while preserving word order.Footnote 21 Note that we also conducted the analysis using bag-of-words PCA. While less computationally intensive to estimate, it resulted in a less valid measure (see the Appendix).
Our unit of analysis is a sub-string kernel: a short sequence of lettersFootnote 22 that can be shared within and across words. This allows us to distinguish between two simple documents with the stemmed strings ‘slow credit’ and ‘expand credit’. They share the five character kernels ‘credi’ and ‘redit’, but differ on ‘low c’ and ‘and c’, among others. We summarize the similarity of these documents with the frequency distribution of five-length strings that they have in common, standardized by document length. We find these pairs for all of the documents in our corpus to create a kernel matrix. We then scale the documents using principal component analysis,Footnote 23 using the first component as our indicator (see the Appendix), and made two final transformations. First, we rescaled it so that it would be between 0 and 1Footnote 24 in order to ease interpretation. Secondly, we smoothed the results by taking a two-period – usually two-month – moving average.
VALIDATION AND DESCRIPTION
The solid lines in Figure 1 show FinStress for a selection of countries. What does this indicator represent? Grimmer and Stewart argue that to validate the results of a text analysis we need ‘careful thought and close reading […] extensive and problem-specific validation’.Footnote 25 We qualitatively examine a selection of the texts classified as being at various FinStress levels. We extensively compare FinStress to other measures of financial market stress. A portion of this exercise is presented here. Please see the Appendix for more details.
Comparing perceptions of financial market conditions to Laeven and Valencia (Reference Laeven and Valencia2013), Reinhart and Rogoff (Reference Reinhart and Rogoff2009), and Romer and Romer (Reference Romer and Romer2015) Note: Solid lines show the FinStress Index. Dotted lines represent a loess smoother of these series. Dashed lines show the (rescaled) scores from Romer and Romer (Reference Romer and Romer2015). The lightest shaded areas indicate periods that Laeven and Valencia (Reference Laeven and Valencia2013) classify as systemic banking crises. Crises are automatically terminated at the end of 2011 as the series does not extend beyond this point. The darkest shaded areas indicate periods that Reinhart and Rogoff (Reference Reinhart and Rogoff2009) classify as banking crises. Crises are automatically terminated at the end of 2009 due to the series not extending beyond this point. Areas with medium darkness shading indicate periods where a crisis is recorded for both measures.
Qualitative Examination
Table 1 shows a progression of texts in the lead-up to and height of the 2008 US financial crisis. The first text is from the observed United States minimum FinStress month, April 2006. The text discusses strong business investment. A year later, the FinStress score increased significantly to 0.41. Likewise, the language changed. The EIU notes a ‘slump in the housing market’ and that liquidity for lower-quality mortgages is ‘drying up’. The following year, shortly after the failure of Bear Sterns, the FinStress score increased to 0.5. The text notes that the bailout of Bear Sterns has ‘increasingly swung’ market participants to think that the worst is over. FinStress is clearly higher than before, but far from its peak, reflecting the cautiously positive assessment in the EIU report. FinStress rose to 0.62 in September 2008 (a report that was released before Lehman Brothers’ failure). This report notes increasing lending risks as well as threats to the ‘stability of weak financial institutions’. In November 2008 FinStress rose close to the US maximum, with the EIU noting that there is a ‘credit crunch’. FinStress closely tracks EIU reports describing increasingly worrying financial market conditions.
Portions of Selected EIU Reports for the United States (2006–2008)
Comparison with other Indices
We now compare FinStress to the dichotomous measures of banking crisis developed by Reinhart and RogoffFootnote 26 and Laeven and Valencia,Footnote 27 as well as Romer and Romer’sFootnote 28 continuous measure.Footnote 29 We expect that our measure is capturing many of the same events, but with more nuance in magnitude and over time.
Figure 1 compares FinStress to three other measures of financial stress. In many cases – conditional on the coverage of each data seriesFootnote 30 – the indices substantively overlap. Comparisons with Romer and RomerFootnote 31 are limited by data availability, but clearly there are cases in which FinStress and their index are similar. For example, both indices increase in the United States from early 2007. A notable difference is how Romer and Romer classify Japan as being without stress from mid-2005, while FinStress decreases, but to a high level compared to many other economically developed countries at that time. Both indices classify Iceland as being under stress in the late 2000s, but the timing is different. Romer and Romer classify Iceland as being in stressFootnote 32 in 2006–2007, which is earlier than a marked increase in the FinStress Index, as well as Reinhart and Rogoff and Laeven and Valencia’s timing.
High FinStress levels should appear where there is crisis in the dichotomous codes, but the reverse may not be true: the dichotomous indices may miss a building crisis as perceived at the time. Laeven and Valencia and Reinhart and Rogoff should have more Type II errors – there are signs of stress but they miss them. Laeven and Valencia’s coding is stricter because countries both have to experience distress and have a particular policy response, so the associated FinStress levels should be higher.
We do find that the mean FinStress level during periods that Laeven and Valencia classify as crises – that is, financial market stress reached the point where politicians responded using a pre-specified set of policies – is higher than during non-crisis periods.Footnote 33 Though developing countries tend to have higher FinStress scores, countries defined by Laeven and Valencia as in crisis in both groups have FinStress scores around 0.59 on average. Those not in Laeven and Valencia crises have lower scores.Footnote 34 The fact that mean FinStress is higher during periods that Laeven and Valencia classify as crises, but not dramatically so, supports the proposition that they miss considerable periods of budding and high stress, and perhaps suffer from more Type II errors.
Laeven and ValenciaFootnote 35 comment that part of the problem with dating financial crises is that each one develops differently: ‘Some crises evolve gradually, gaining speed as the ripple effects from a seemingly small shock propagate forward in time ... other episodes happen more abruptly and are often the result of sudden stops.’
FinStress’ real-time continuous measurement and monthly periodicity allow us to distinguish these types. We can see in Figure 1 that financial market difficulties in the United States built over a long period, with a few spikes during notable banking difficulties, such as Bear Stearns’ and Lehman Brothers’ collapse. Conversely, countries such as Germany, Hungary and Iceland have more sudden periods of perceived financial distress. The Greek case presents an interesting trajectory. There is a notable spike in Greek financial stress in 2008 – when both Reinhart and Rogoff Reference Reinhart and Rogoff2009 and Laeven and Valencia Reference Laeven and Valencia2013 determine a crisis had started. This is then followed by a stable period, and then a sudden uptick in 2010, when a possible government default severely threatened the banking system.
Kazakhstan is notable for another path: rapid stress onset and just as rapid dissipation. In late 2009 there was a prominent spike in perceptions of stress directly related to a credit crunch resulting from the Global Financial Crisis. According to an International Monetary Fund assessment, a large and quick policy response – facilitated by the country’s sizable National Oil Fund – returned stability to the country’s banking system within a few months.Footnote 36 Kazakhstan’s FinStress score returns almost to its previous trend level at that time. Annual binary measures of crises do not capture these changes.
We can use FinStress to identify periods in which financial market conditions were perceived to be worsening, though for whatever reason these perceptions changed before other measures would record a financial crisis. Australia in late-2008/2009 is a notable example. It had a clear spike in perceptions of stress shortly after Lehman Brothers’ collapse. Fairly quickly thereafter, its FinStress score returned to its previous level. Laeven and Valencia and Reinhart and Rogoff do not distinguish these periods.
FinStress’ advantages are also apparent for timing the end of heightened distress. This is a difficult issue for the binary indicators. Crisis onset is well defined by these measures, but they rarely have a clear or non-ad hoc way of determining when a crisis ended. Though we are limited by the time period coverage of the EIU texts, it is clear that some countries, notably Switzerland, the United Kingdom and the United States, were perceived to have had improved financial market conditions from about 2010. Other countries, particularly eurozone countries, plateaued at a high level through the end of 2011, a period that corresponds with the eurozone crisis. Laeven and Valencia’s measure uses an ad hoc definition of crisis termination and so classifies these entire periods as crises with equal intensity.
APPLICATION
We now provide examples of how FinStress can be applied in political science research and demonstrate that it performs as well as (or better than) previous binary measures.
Exploring the Functional Form of the Relationship Between Crisis and Electoral Volatility
Following the Global Financial Crisis there has been considerable interest in how financial stress may hasten government failure,Footnote 37 how crises increase electoral support for extremist parties,Footnote 38 and how negative economic events and crises increase electoral volatility – that is, the degree to which voters switch support for parties from one election to another.Footnote 39 Crespo-Tenorio, Jensen, and Rosas, and Funke, Schularick, and Trebesch both rely on Laeven and Valencia’s binary measure,Footnote 40 while Hernández and Kriesi use an even simpler measurement of crisis: whether or not an election occurred after November 2008.Footnote 41
Figure 2 presents hypothetical scenarios to illustrate possible measurement error when estimating the effect of financial market stress on elections. The top-left panel illustrates time-order measurement error. Using annual indicators of crisis may ascribe a level of stress to an election that was not perceived at the time. This type of error could lead to systematic underestimation of the effect of financial market stress.
Hypothetical scenarios of error in the measurement of financial market stress at elections using an annual binary measure vs. FinStress Note: Shaded areas indicate years classified as a crisis by a hypothetical binary crisis measure. Dashed vertical lines indicate an election.
The upper-right panel of Figure 2 illustrates incorrectly measuring the intensity of financial market stress for two elections held during a period of heightened stress. Using a binary crisis measure codes the elections as occurring at equivalent stress levels. This error could lead to underestimating the effect of a crisis on election outcomes. Additionally, a binary measure would not allow us to examine whether there was a non-linear effect of stress; it may be the case, for example, that very high stress has an exponentially stronger effect on outcomes than medium levels.
Finally, the lower-left panel of Figure 2 provides a scenario in which neither a binary crisis measure nor FinStress levels would capture potentially important features of how voters perceived stress at elections x c and y c . Even though the binary and FinStress levels are the same, in the former stress is worsening, while in the latter conditions are improving. Voters might be more hostile to incumbents as conditions worsen and more favorable when conditions improve. The binary measure would not allow us to examine this possibility.
These are not just hypothetical examples. Figure 3 compares national election dates in nineteen European countries to FinStress scores and Laeven and Valencia crisis periods. In some elections, notably elevated FinStress levels and Laeven and ValenciaFootnote 42 crises overlap: Belgium (June 2010), Germany (October 2009) and Iceland (May 2009). There are also notable examples of the binary crisis indicator coding an election as occurring in a crisis well before voters would likely have perceived one in their country: Austria (October 2008), Portugal (October 2009) and Spain (March 2008). It would be inaccurate to estimate the effect – in these cases on voters’ actions – of a crisis that had not yet occurred. There are also instances in which financial market stress had declined or was notably declining by the time of the election, but the binary crisis measure still coded a full-intensity crisis: Sweden (October 2010) and the Netherlands (June 2010).
Comparing national election timing, FinStress, and Laeven and Valencia’s (Reference Laeven and Valencia2013) Banking Crisis Measure in Europe Note: Dashed vertical lines indicate national government elections. Lightly shaded areas represent Laeven and Valencia (Reference Laeven and Valencia2013) banking crisis periods.
In light of these measurement issues, and assuming that electoral volatility will be higher under more stressful economic conditions, we anticipate that the binary crisis measure will underestimate the effect of financial market stress on volatility compared to FinStress.
To examine this we use data on electoral volatility in Western European countries from Emanuele.Footnote 43 He codes the total electoral volatility of an election by summing vote switching between existing parties, new parties and failed parties. Because we want to compare the estimated effects of the two financial market stress measures, we separately ran simple normal linear models of volatility including the stress measures on the right-hand side.Footnote 44
Figure 4 shows predicted electoral volatility – which ranges from 2.5 to 29.6 in the sample – under various fitted levels and measures of stress. The first row of plots shows results from simple linear specifications. As expected, while both the binary and continuous measures are estimated to have a significant (at the 10 percent level) positive effect on volatility, the predicted effect of FinStress is somewhat stronger. The bottom-left panel of Figure 4 shows predicted electoral volatility from a model estimated by adding a quadratic term. Above FinStress scores of about 0.6 we estimate a rapidly increasing effect of FinStress on volatility. At the highest levels, volatility is predicted to be much higher than anticipated by the binary measure of crisis and linear FinStress. The average predicted volatility at the highest FinStress levels under the quadratic specification is 20.9, while it is 15.3 in the linear FinStress specification and 14.4 for the binary measure.
Predicted electoral volatility for representative levels of FinStress and Laeven and Valencia (Reference Laeven and Valencia2013) Banking Crisis Note: shaded regions/vertical lines represent 95 per cent confidence intervals.
The middle-left panel of Figure 4 shows the predicted volatility for the range of observed changes to FinStress from the previous twelve-month moving average. Large increases in stress compared to the average level over the previous twelve months are associated – at the 10 per cent significance level – with increased electoral volatility. Stated conversely, improving financial market conditions are predicted to lead to less vote switching. The closest analogue to examining the effect of stress changes on volatility for the binary measure is to create a binary crisis-start year variable.Footnote 45 In contrast to the estimates using the FinStress change variable, we did not find a statistically significant effect at any level of Laeven and Valencia crisis onset on electoral volatility (Figure 4, middle-right panel).
Comparing Model Fit
We further compare the usefulness of FinStress to the Laeven and Valencia binary crisis measure by comparing the adjusted R 2 from models with the two indices. A higher adjusted R 2 would indicate that a variable explains more of the variance in the dependent variable.
We use regressions with electoral volatility as the dependent variable, as well as a substantively very different variable: cumulative revisions to EU member state government debt statistics made by the European Union’s statistical agency, Eurostat. Gandrud and HallerbergFootnote 46 used this variable to examine the political and economic conditions associated with Eurostat – an independent statistical agency – revising government debt statistics. They found that governments facing unscheduled elections during a financial crisis were more likely to have their debt statistics revised upwards. The authors argue that this is likely because incumbents under-report debts during stressful times to make themselves more attractive to voters.
We ran identical linear regression models with the dependent variables, changing only whether we included FinStress, the FinStress polynomial discussed earlier or the binary crisis measure. The results are shown in the Appendix. For electoral volatility, the model with polynomial FinStress has an adjusted R 2 about 1.8 times higher than that with the binary measure (0.193 vs. 0.109). For debt revisions the difference is more modest: the FinStress model has an adjusted R 2 1.08 times that of the binary model (0.405 vs. 0.375). When using debt revisions as the dependent variable, monthly FinStress was collapsed into its annual average to put it on the same time scale as the annual dependent variable. It is not surprising that the relative model fit is better with monthly FinStress than when it is collapsed into an annual average, and thus is more similar to the annual binary measure. The former operationalization leverages FinStress’ continuous measurement level and high frequency, whereas the latter reduces this information.
CONCLUSION
We introduced a novel continuous measure of real-time perceived financial stress – FinStress – and compared it to prior measures of financial stress and crisis. We showed how this monthly continuous indicator – created with unsupervised text analysis – provides more accurate estimates of the impact of stress on political events such as elections than less finely (but more laboriously) constructed indicators.
Our methodological work has implications for the wider research community. We demonstrated how researchers could construct continuous indicators of other political and economic phenomena using machine learning and text analysis of large corpuses of similarly formatted texts. Once a text gathering and analysis ‘pipeline’Footnote 47 has been developed and validated, researchers can efficiently estimate and update new indicators.Footnote 48 This approach is especially useful in comparison to time-consuming, expensive and irreproducible human coding techniques for collections of similarly formatted texts.