




No CrossRef data available.
ARE VACCINATION SITES IN BANGLADESH SCALE EFFICIENT?
Published online by Cambridge University Press: 21 April 2004
Abstract
Objectives: The overall aim of this study is to discern whether and to what degree vaccination sites exhibit constant returns to scale.
Methods: Data Envelopment Analysis is used to compare all the facilities in the sample in terms of input costs used to produce multiple outputs. The application considers the Expanded Program on Immunization (EPI), which operated in Dhaka City, Bangladesh, during 1999.
Results: A preponderance of EPI sites were determined to be operating at increasing returns to scale.
Conclusions: Our findings question the applicability of cost-effectiveness analyses that assume constant returns to scale.
Information
- Type
- RESEARCH NOTES
- Information
- International Journal of Technology Assessment in Health Care , Volume 19 , Issue 4 , December 2003 , pp. 692 - 697
- Copyright
- © 2004 Cambridge University Press
Compared with other health interventions, vaccinations are judged to be one of the most cost-effective ways of improving and maintaining child health, especially in low-income countries (16). This view has been held for a considerable time (e.g., 15) and may help to explain the increase in global coverage of the Expanded Program of Immunization (EPI) from an average of 5 percent at its inception in 1974 to the current average of 80 percent (4). Many cost and cost-effectiveness analyses of EPI country programs in low-income countries have been evaluated at a given level of production (e.g., 11), used only a few providers (e.g., 4), or aggregated and averaged at a country level (e.g., 1;14). Even when studies estimated the costs of increasing coverage rates or predicted country-wide estimates of costs from a small study, most have assumed a linear function to “scale-up” programs (10). For example, if the unit cost per fully vaccinated child is $20, the increase in expanding vaccination services for another fifty children is assumed to be $1,000.
That such constant returns to scale exist is doubted. For example, England et al. (5) have hypothesized that many impediments exist to scaling up measles control in West and Central Africa and suggested that considerable investment would be needed in management and health systems before expansion. In reviewing the cost profiles of immunization programs from accounting-based cost studies, some investigators have found that the proportion of fixed costs indicates the likely existence of economies of scale (e.g., 8).
If average costs and incremental cost-effectiveness ratios did change with production, then assuming constant returns to scale would produce biased estimates of any change in production, and the bigger the expected change, the larger the bias. Even if size were accounted for, there is no notion of best practice benchmarking (2) or knowledge of how this might change by setting. In this study, both of these issues are addressed by a novel application of data envelopment analysis. Three objectives are pursued: first, the cost of delivering routine vaccination services from the perspective of the providers is determined; second, the outputs of vaccination sites for each provider in terms of the number of doses of each type of vaccine is assessed; third, the scale efficiency of the vaccination sites as well as factors that explain variation in scale efficiency are evaluated.
THE BANGLADESH EPI
The EPI in Bangladesh was established in 1979 and became fully operational in 1985. It aimed to reduce morbidity and mortality from six vaccine-preventable diseases. Therefore, a fully vaccinated child received six standard EPI antigens against diphtheria, pertussis, and tetanus (DPT), tuberculosis (TB), polio, and measles through eight vaccinations. Pregnant women were also given vaccinations to prevent maternal and neonatal tetanus. Since 1985, vaccination coverage has increased from 2 percent for all antigens to a reported 92 percent for BCG and 62 percent for measles (16). However, immunization coverage rates were much lower in urban compared with rural areas. Therefore, in 1988, the United States Agency for International Development implemented a program to strengthen vaccination services in urban areas in conjunction with the array of government and nongovernment funders and providers of service.
METHODS
Data envelopment analysis (DEA) was used to allow comparison of all the clinics in the sample in terms of input costs used in the production of multiple outputs. DEA is a nonparametric, deterministic approach using linear programming techniques that defines a “best practice” production frontier. Firms lying on the production frontier are considered to be operating at the best practice or in other words, provide a benchmark à la Birch and Gafni (2). However, it should be noted that the measure of efficiency is considered to be relative rather than absolute, as no a priori information exists as to what should be considered as absolute efficiency. The benchmark clinics, that is, those that are technically and scale efficient, reflect the best practice for the given sample of clinics.
A benefit of this DEA approach is that, by identifying best practice by a “local” standard, it may be assumed that given certain productive characteristics (as well as environmental ones) best practice can be feasibly reproduced at the less-efficient clinics. Another benefit of the DEA approach used here is that the overall technical efficiency (TECRS) measure can be decomposed into pure technical efficiency (TEVRS) and scale efficiency (SE). In other words, TECRS=TEVRS×SE.
Whereas there have been a plethora of other related studies applying DEA to the health care sector using quantities of inputs in their natural units to produce outputs (see 13 for a review), we specified the objective as minimizing input costs given outputs (6;7). As the objective of this study is to determine scale effects, the definition of the cost minimizing technology used here was applicable.
The technology was initially constructed under constant returns to scale and strong disposability of costs (as costs increase, outputs must increase, ceteris paribus) TECRS. Allowances can be made in the restraints to allow for variable returns to scale TEVRS. Furthermore, we determined the type of scale inefficiencies by using a third model TENIRS. In all these cases, we followed the definitions given by Färe, Grosskopf, and Lovell (7) and solved similar linear programming problems. We used the DEAP program by Coelli (3) for the computations.
The technology is said to be operating at a cost- as well as scale-efficient level if TECRS=TEVRS. However, if they were not equal, the extent to which inefficiency was caused due to operating at the wrong scale was assessed. Determining the type of scale inefficiency (either increasing or decreasing returns to scale) required the solution of a third linear programming problem, referred to as nonincreasing returns to scale technology (NIRS). To define the type of scale inefficiency that is operating here, we compared the solutions of the three linear programming problems. If

, TECRS=TENIRS then increasing returns to scale exist. If

, but, TENIRS>TECRS, then decreasing returns to scale exist. Such models allowed for the impact of scale effects on the EPI clinics to be evaluated.
However, deviations from the best practice frontier may be due to independent factors that may be out of the managers' or policy makers' direct control. Therefore, the measures of efficiency were analyzed by using a variety of statistical tests, in conjunction with other environmental factors that may affect scale efficiency.
DATA AND RESULTS
Our sample was obtained by means of a 1999 cost analysis of EPI services undertaken in a random sample of 25 percent of the facilities (132 of 511) providing EPI services in Dhaka City Corporation. To be parsimonious, five outputs (the amount of doses given for DPT, TB, polio, measles, and TT in 1999) and one input (total program costs of the EPI by site) were specified. Only program sites with full information were included. The final data set consisted of 117 of a possible 132 total clinics. Hence, 89.3 percent of all clinics sampled were included. The type of missing data that resulted in sites being excluded from the sample included ownership form, type of vaccination site, duration of operation, as well as some of the outputs. The descriptive statistics are given in Table 1.

Turning next to our efficiency results given in Table 2, we found that overall efficiency (TE CRS) was only 0.33. In other words, if program sites were technically efficient and operated at the correct scale, costs on average could have been reduced by 67 percent without sacrificing the current level of outputs produced. By decomposing this overall measure into pure technical efficiency (TE VRS) and scale efficiency, we found that more of the overall inefficiency was due to sites incurring too much cost in producing the array of vaccinations rather than operating at the wrong size. However, both sources of this overall inefficiency must be addressed for these sites to become less wasteful of scarce resources.

Given the findings that the sites in this sample exhibited variable returns to scale, the types of diseconomies of scale were examined next. Table 3 shows that the majority of the program sites exhibited increasing returns to scale (suggesting that they are too small), 17 program sites exhibit decreasing returns to scale (suggesting that they are too large), and only six program sites were the “right” size.

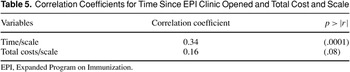
In Tables 4 and 5, we assessed whether differences in efficiency followed systematic patterns due to factors beyond managerial control. Table 4 displays statistically significant differences between the efficiency of two ownership forms, and shows that scale efficiency is relatively greater in government-owned program sites. As outreach sites were statistically significantly less scale efficient than fixed sites, we infer that satellite sites are too small given the best practice frontier.


Although the EPI program has been in existence in Dhaka City Corporation since 1988, not all sites began providing EPI services at the same time. Table 5 shows that the length of time a program site has been in operation is positively correlated with scale efficiency.
DISCUSSION/POLICY IMPLICATIONS
The sites in our sample were, on average, relatively inefficient both in terms of technical inefficiency as well as scale inefficiency. To become technically efficient, program sites would have had to decrease their costs by an average of 50 percent, and if they had been operating at the right size, costs could have been reduced by a further 36 percent. Sites that were relatively more inefficient, on average, were not government-owned satellites. Therefore, the governmentally owned sites, perhaps due to more centralized control, appeared to be better at long-term planning. We also found that sites that had been practicing longer were relatively more scale efficient, which is perhaps attributable to a learning curve effect.
The presence of pure technical inefficiencies suggests that, if such cost data were used as the numerator of a cost-effectiveness ratio, a cost-effectiveness analysis would not reflect the minimum efficient point of production at a given level. However, to ascertain whether this outcome is likely to be the case, researchers need to begin using a larger sample size of provider units for costing, especially if results are intended for use beyond the geographical focus of an evaluation.
Our evidence provides empirical support to Jacobs and Baladi's (9) contention that assuming constant returns to scale might not be realistic. The presence of increasing returns has two particular implications. First, that this intervention cannot be treated as perfectly divisible within a population and retain the same level of incremental cost-effectiveness. Second, it suggests that, if constant returns to scale are assumed when increasing returns to scale exist, an intervention is likely to be overprovided in that form. Finally, the potential learning effect raises questions about how relevant it is to transfer cost-effectiveness ratios over time or across countries as levels of technology differ (12). Therefore, we conclude that ignoring the possible existence of technical inefficiencies and variable returns to scale would make the generalizability of cost-effectiveness ratios suspect and could worsen rather than improve the allocation of resources.
We acknowledge and thank Dr. Suhaila Kahn at ICDDR, B for her organization of the data collection and Dr. Mahmud Khan at Tulane University who was one of the principal investigators on the same study. Vivian Valdmanis, Damian Walker, and Julia Fox-Rushby are members of the Health Economics and Financing Program, which is supported by funds from the United Kingdom Department for International Development (DFID).
References
Barnum HN,
Tarantola D,
Setiady IF.
1980
Cost-effectiveness of an immunization programme in Indonesia.
Bull World Health Org.
58:
499-
513.Google Scholar
Birch S,
Gafni A.
1992
Cost-effectiveness/utility analysis. Do current decision rules lead us to where we want to be?
J Health Econ.
1:
279-
296.Google Scholar
Coelli TJ.
1996
A guide to DEAP version 2.1: A data envelopment analysis computer program.
CEPA Working Paper No. 8/96. ISBN 1 86389 4969.
Department of Econometrics, University of New England;
Cutts FT,
Phillips M,
Kortbeek S,et al.
1990
Door-to-door canvassing for immunization program acceleration in Mozambique: Achievements and costs.
Int J Health Serv.
20:
717-
725.Google Scholar
England S,
Loevinsohn B,
Melgaard B,et al.
2001
The evidence base for interventions to reduce mortality from vaccine-preventable diseases in low and middle-income countries.
CMH Working Paper Series. Paper No. WG5 10.
Geneva, Switzerland:
Commission on Macroeconomics and Health;
Färe R,
Grosskopf S.
1985
A non-parametric cost approach to scale efficiency.
Scand J Econ.
87:
594-
604.Google Scholar
Färe R,
Grosskopf S,
Lovell CAK.
1994
Production functions.
Cambridge:
Cambridge University Press;
Gilson L.
1992
Quality and cost of primary health care in rural Tanzania.
PhD thesis.
London:
School of Hygiene and Tropical Medicine;
Jacobs P,
Baladi JF.
1996
Biases in cost measurement for economic evaluation studies in health care.
Health Econ.
5:
525-
529.Google Scholar
Kumaranayake L,
Watts C.
1999
Costs of scaling up HIV program activities to a national level for sub-Saharan Africa: Methods and estimates.
S Afr J Econ.
68:
1012-
1032.Google Scholar
Levine OS,
Ortiz E,
Contreras R,et al.
1993
Cost-benefit analysis for the use of Haemophilus influenzae type b conjugate vaccine in Santiago, Chile.
Am J Epidemiol.
137:
1221-
1228.Google Scholar
Ramsey CR,
Grant AM,
Wallace SA,et al.
2000
Assessment of the learning curve in health technologies. A systematic review.
Int J Technol Assess Health Care.
16:
1095-
1108.Google Scholar
Seiford LM.
1998
A bibliography of data envelopment analysis.
In: Charnes A,
Cooper WW,
Lewin AY,
Seiford LM, eds.
Data envelopment analysts: Theory, methodology and application.
Boston:
Kluwer Academic Publishers,
437-
469.
Shepard DS,
Sanoh L,
Coffi E.
1986
Cost-effectiveness of the expanded programme on immunization in the Ivory Coast: A preliminary assessment.
Soc Sci Med.
22:
369-
377.Google Scholar
Walsh JA,
Warren KS.
1982
Strategies for primary health care: Technologies for the control of disease in the developing world.
Chicago:
The University of Chicago Press;
World Bank.
1993
World development report 1993. Investing in health.
Oxford:
Oxford University Press;
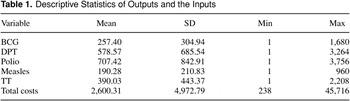
Descriptive Statistics of Outputs and the Inputs
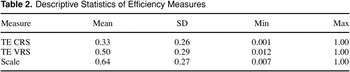
Descriptive Statistics of Efficiency Measures
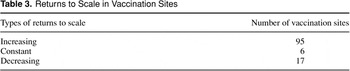
Returns to Scale in Vaccination Sites
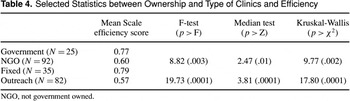
Selected Statistics between Ownership and Type of Clinics and Efficiency
Correlation Coefficients for Time Since EPI Clinic Opened and Total Cost and Scale
 You have
Access
- 7
- Cited by