1 Introduction
Sedimentation of red blood cells has been collecting wide interest from clinical and physical points of view since the beginning of the 20th century (Westergren Reference Westergren1921). When putting blood in a tube with anticoagulant, red blood cells start to sediment downwards due to the density difference between the internal haemoglobin solution and the external fluid plasma. Settling velocity of the cells, which is known as the erythrocyte sedimentation rate (ESR), changes with blood conditions such as haematocrit and fibrinogen concentration, and ESR has been widely used in screening in medical practices (Baskurt, Neu & Meiselman Reference Baskurt, Neu and Meiselman2012). Cell aggregations, known as rouleaux, also plays an important role in this phenomenon.
Sedimentation of a single red blood cell was extensively reported in the early 1970s. Groom & Anderson (Reference Groom and Anderson1972) observed the sedimentation of blood diluted to a haematocrit of 0.15 % using a Ringer solution, and they reported that the cells change their orientation continuously in a random manner. Canham, Jay & Tilsworth (Reference Canham, Jay and Tilsworth1971) investigated the frequency of this random wobbling by counting the number of
 $45^{\circ }$
rotations in any direction, and approximately three rotations per minute were observed. These random rotations were attributed to the membrane flickering (Brochard & Lennon Reference Brochard and Lennon1975), which consists of membrane fluctuations caused by the dynamic remodelling of the cytoskeleton (Gov & Safran Reference Gov and Safran2005; Turlier et al.
Reference Turlier, Fedosov, Audoly, Auth, Gov, Sykes, Joanny, Gompper and Betz2016). Jay & Canham (Reference Jay and Canham1972) reported the random rotation of stiff red blood cells fixed with glutaraldehyde, which might have less membrane flickering. They showed that stiff cells have fewer rotations compared to normal cells, and that the sedimentation is stable.
Groom & Anderson (Reference Groom and Anderson1972) also reported the orientation of 280 cells, and they observed vertically oriented cells 2.5 times more often than horizontal ones. When setting a threshold at
 $45^{\circ }$
to the gravitational direction, 58 % of cells were rather vertically oriented while the other 42 % of cells were rather horizontal. Canham et al. (Reference Canham, Jay and Tilsworth1971) also observed that the cells stay in a vertical orientation 2.3 times longer than a horizontal orientation, and that the settling velocity at a vertical orientation was 1.38 times faster than at a horizontal orientation.
Recently, Hoffman & Inoué (Reference Hoffman and Inoué2006) observed cell shapes under a wide range of centrifugal forces from
 $3.4g$
to
 $11\,500g$
, where
 $g$
is the standard gravitational acceleration. When the centrifugation is at a relatively low speed, they reported that the cells wobble but maintain their initial orientations without tumbling, as also seen under standard gravity. They explained that the shear force, which is generated by the sedimentation of cells, is responsible for the wobbling motion. Under centrifugation at high speed, on the other hand, most of the cells reorient vertically and show an asymmetric ‘bag-like’ shape. The shape is asymmetric in the gravitational direction, and the bottom half has a larger volume compared to the upper half.
Though the sedimentation of soft elastic materials is an important problem to clarify, there was not much theory and numerical simulation of these problems as mentioned in a recent review paper (Guazzelli & Hinch Reference Guazzelli and Hinch2011). However, a number of groups have started to focus on this field in recent years by investigating cases such as sedimentation of a single capsule (Boltz & Kierfeld Reference Boltz and Kierfeld2015), a vesicle (Boedec, Jaeger & Leonetti Reference Boedec, Jaeger and Leonetti2012, Reference Boedec, Jaeger and Leonetti2013; Suárez et al. Reference Suárez, Leidy, Téllez, Gay and Gonzalez-Mancera2013), deformable particles (Saintillan, Shaqfeh & Darve Reference Saintillan, Shaqfeh and Darve2006), a flexible filament (Li et al. Reference Li, Manikantan, Saintillan and Spagnolie2013) and a red blood cell (Peltomaki & Gompper Reference Peltomaki and Gompper2013). Boltz & Kierfeld (Reference Boltz and Kierfeld2015) reported sedimentation of a single spherical capsule in an axisymmetric system, and showed a detailed diagram of three different stationary shapes: pseudo-spherical shape, pear shape and buckled shape. Peltomaki & Gompper (Reference Peltomaki and Gompper2013) reported sedimentation of a single red blood cell using multi-particle collision dynamics under relatively high gravitational acceleration. The red blood cell consists of a triangular surface with particles on vertices, and the motion of the particles is solved by considering the thermal fluctuations and the potentials of shear elasticity, bending rigidity and constant volume and area. They reported that there are three different steady-state shapes for a single-cell sedimentation: parachute, teardrop and fin-tailed spheres.
In summary, a red blood cell wobbles with the main orientation maintained when the gravitational driving force is small, while it reorients toward vertical orientation when applying a large gravitational force. However, knowledge of the reorientation is limited, and there is still no clear understanding about how reorientation of the cells depends on cell conditions such as membrane rigidity and a density/viscosity difference between the internal/external fluids. The objective of this paper is to investigate the reorientation phenomenon of a single red blood cell. We mainly focus on the effects of two parameters: the Bond number
 $Bo$
and the viscosity ratio
 $\unicode[STIX]{x1D706}$
. The Bond number describes the strength of the gravitational force compared to the membrane shear elasticity, while the viscosity ratio shows the ratio between a cell’s internal and external fluid viscosity. Peltomaki & Gompper (Reference Peltomaki and Gompper2013) focused on a viscosity ratio of
 $\unicode[STIX]{x1D706}=1$
and Bond number in the range
 $Bo=6.4-480$
, while we show results of
 $\unicode[STIX]{x1D706}=0.5{-}10.0$
and
 $Bo=2.5\times 10^{-3}{-}2.5\times 10^{-1}$
, which includes the range of the sedimentation under standard gravity. The sedimentation of a single cell is solved using the boundary element method, which is also utilized in our former studies (Nix et al.
Reference Nix, Imai, Matsunaga, Yamaguchi and Ishikawa2014; Matsunaga et al.
Reference Matsunaga, Imai, Yamaguchi and Ishikawa2015, Reference Matsunaga, Imai, Yamaguchi and Ishikawa2016). In this study, we find that settling/drifting velocities are weak functions of
 $Bo$
and
 $\unicode[STIX]{x1D706}$
, while the angular velocity of the reorientation drastically changes with respect to those two conditions: the angular velocity is smaller for lower
 $Bo$
or higher
 $\unicode[STIX]{x1D706}$
. Note that membrane fluctuations due to the membrane flickering are ignored in this study to concentrate only on purely hydrodynamical effects.
2 Problem statement
Consider a red blood cell with a characteristic length
 $a$
suspended freely in a Newtonian fluid with a viscosity
 $\unicode[STIX]{x1D707}$
and a density
 $\unicode[STIX]{x1D70C}$
. The characteristic length is defined by the radius of a sphere that has the same volume as a red blood cell. The fluid inside the cell is assumed to be a Newtonian fluid with viscosity
 $\unicode[STIX]{x1D706}\unicode[STIX]{x1D707}$
and density
 $\unicode[STIX]{x1D70C}+\unicode[STIX]{x0394}\unicode[STIX]{x1D70C}$
, where
 $\unicode[STIX]{x1D706}$
is the viscosity ratio and
 $\unicode[STIX]{x0394}\unicode[STIX]{x1D70C}$
is the density difference. Because of the presence of a driving force due to the density difference, the red blood cell would rise or settle. In this system, the Reynolds number is defined as
 $Re=Ua\unicode[STIX]{x1D70C}/\unicode[STIX]{x1D707}$
where
 $U$
is the characteristic velocity.
The area and volume of red blood cells are
 $A_{rbc}=135~\unicode[STIX]{x03BC}\text{m}^{2}$
and
 $V_{rbc}=94~\unicode[STIX]{x03BC}\text{m}^{3}$
(Evans & Fung Reference Evans and Fung1972), respectively. In the case of a single red blood cell settling in plasma, each parameter is
 $a=2.82~\unicode[STIX]{x03BC}\text{m}$
,
 $g=9.8~\text{m}~\text{s}^{-2}$
,
 $\unicode[STIX]{x1D707}=1.34\times 10^{-3}~\text{Pa}~\text{s}$
(Brust et al.
Reference Brust, Schaefer, Doerr, Pan, Garcia, Arratia and Wagner2013),
 $\unicode[STIX]{x1D70C}=1.024-1.030~\text{g}~\text{cm}^{-3}$
,
 $\unicode[STIX]{x1D70C}+\unicode[STIX]{x0394}\unicode[STIX]{x1D70C}=1.090-1.120~\text{g}~\text{cm}^{-3}$
(both densities from The Japanese Society for Laboratory Hematology 2003). The characteristic velocity is roughly estimated using Stokes’ law as
 $U=2a^{2}\unicode[STIX]{x0394}\unicode[STIX]{x1D70C}g/(9\unicode[STIX]{x1D707})\approx 1.0~\unicode[STIX]{x03BC}\text{m}~\text{s}^{-1}$
. Since the Reynolds number is assumed to be far smaller than unity
 $Re\approx O(10^{-6})\ll 1$
, the flow velocity can be treated as a Stokes flow. A Reynolds number of similar order (
 $Re=6.47\times 10^{-6}$
) is also obtained from values (
 $U=0.90~\unicode[STIX]{x03BC}\text{m}~\text{s}^{-1},\unicode[STIX]{x1D70C}=1.005~\text{g}~\text{cm}^{-3},\unicode[STIX]{x1D707}=1.03\times 10^{-3}~\text{Pa}~\text{s}$
) of a previous experiment using a Ringer solution (Groom & Anderson Reference Groom and Anderson1972). The Stokes flow assumption is applicable up to
 $10^{4}g$
in this system, because the Reynolds number is still
 $Re\approx O(10^{-2})$
even with a characteristic velocity of
 $U=2a^{2}\unicode[STIX]{x0394}\unicode[STIX]{x1D70C}\cdot 10^{4}g/(9\unicode[STIX]{x1D707})\approx 10.0~\text{mm}~\text{s}^{-1}$
. In a previous experiment by Hoffman & Inoué (Reference Hoffman and Inoué2006), they applied centrifugation up to
 $11\,500g$
, and this experiment could be also considered as within the Stokes flow regime.
2.1 Fluid mechanics
The Stokes flow velocity of a given observation point
 $\boldsymbol{x}$
is described by the boundary integral formulation (Pozrikidis Reference Pozrikidis1992a
; Foessel et al.
Reference Foessel, Walter, Salsac and Barthès-Biesel2011):
 $$\begin{eqnarray}\displaystyle \boldsymbol{v}(\boldsymbol{x}) & = & \displaystyle -\frac{1}{8\unicode[STIX]{x03C0}\unicode[STIX]{x1D707}}\int _{A}\unicode[STIX]{x1D645}(\boldsymbol{x},\boldsymbol{y})\boldsymbol{\cdot }\boldsymbol{q}(\boldsymbol{y})\,\text{d}A(\boldsymbol{y})\nonumber\\ \displaystyle & & \displaystyle +\,\frac{1-\unicode[STIX]{x1D706}}{8\unicode[STIX]{x03C0}}\int _{A}\boldsymbol{v}(\boldsymbol{y})\boldsymbol{\cdot }\unicode[STIX]{x1D646}(\boldsymbol{x},\boldsymbol{y})\boldsymbol{\cdot }\boldsymbol{n}(\boldsymbol{y})\,\text{d}A(\boldsymbol{y}),\end{eqnarray}$$
where
 $\boldsymbol{n}$
is the outward unit normal vector at the membrane material point
 $\boldsymbol{y}$
,
 $A$
is the cell surface and
 $\boldsymbol{q}(\boldsymbol{y})$
is the traction jump across the membrane.
The second-order tensor
 $\unicode[STIX]{x1D645}$
and the third-order tensor
 $\unicode[STIX]{x1D646}$
are the Green’s function of single- and double-layer potentials, which are defined by
 $$\begin{eqnarray}\displaystyle & \displaystyle \unicode[STIX]{x1D645}=\frac{\unicode[STIX]{x1D644}}{r}+\frac{\boldsymbol{r}\otimes \boldsymbol{r}}{r^{3}}, & \displaystyle\end{eqnarray}$$
 $$\begin{eqnarray}\displaystyle & \displaystyle \unicode[STIX]{x1D646}=6\frac{\boldsymbol{r}\otimes \boldsymbol{r}\otimes \boldsymbol{r}}{r^{5}}, & \displaystyle\end{eqnarray}$$
where
 $\boldsymbol{r}=\boldsymbol{x}-\boldsymbol{y}$
,
 $r=|\boldsymbol{r}|$
and
 $\unicode[STIX]{x1D644}$
is the identity tensor.
2.2 Membrane mechanics
The membrane is modelled as an isotropic and hyperelastic material. The surface load
 $\boldsymbol{q}$
in (2.1) consists of three components: the force due to the membrane in-plane stretch
 $\boldsymbol{q}_{s}$
, the bending resistance
 $\boldsymbol{q}_{b}$
and the gravitational driving force
 $\boldsymbol{q}_{g}$
. Summation of these three loads,
 $\boldsymbol{q}=\boldsymbol{q}_{s}+\boldsymbol{q}_{b}+\boldsymbol{q}_{g}$
, is used for the coupling with the fluid mechanics.
Load due to the in-plane stretch
 $\boldsymbol{q}_{s}$
is obtained from a local equilibrium equation between the Cauchy tension
 $\unicode[STIX]{x1D64F}$
as
 $$\begin{eqnarray}\boldsymbol{q}_{s}=\unicode[STIX]{x1D735}_{s}\boldsymbol{\cdot }\unicode[STIX]{x1D64F},\end{eqnarray}$$
where
 $\unicode[STIX]{x1D735}_{s}$
is the surface divergence operator. The Cauchy stress tensor
 $\unicode[STIX]{x1D64F}$
is obtained by
 $$\begin{eqnarray}\unicode[STIX]{x1D64F}=\frac{1}{J_{s}}\unicode[STIX]{x1D641}_{s}\boldsymbol{\cdot }\frac{\unicode[STIX]{x2202}w_{s}}{\unicode[STIX]{x2202}\unicode[STIX]{x1D65A}}\boldsymbol{\cdot }\unicode[STIX]{x1D641}_{s}^{\text{T}},\end{eqnarray}$$
where
 $J_{s}=\unicode[STIX]{x1D706}_{1}\unicode[STIX]{x1D706}_{2}$
represents the area dilation ratio and
 $\unicode[STIX]{x1D65A}$
is the Green–Lagrange strain tensor
 $$\begin{eqnarray}\unicode[STIX]{x1D65A}={\textstyle \frac{1}{2}}(\unicode[STIX]{x1D641}_{s}^{\text{T}}\boldsymbol{\cdot }\unicode[STIX]{x1D641}_{s}-\unicode[STIX]{x1D644}_{s}),\end{eqnarray}$$
and
 $\unicode[STIX]{x1D641}_{s}$
is the surface deformation gradient tensor
 $$\begin{eqnarray}\text{d}\boldsymbol{x}=\unicode[STIX]{x1D641}_{s}\boldsymbol{\cdot }\text{d}\boldsymbol{X}.\end{eqnarray}$$
Note that
 $\unicode[STIX]{x1D644}_{s}$
is the surface identity tensor, and
 $\boldsymbol{X}$
and
 $\boldsymbol{x}$
are the membrane material points of the reference and deformed states, respectively. The Skalak constitutive law (Skalak et al.
Reference Skalak, Tozeren, Zarda and Chien1973) is utilized in order to express the area incompressibility of the cell membrane. The strain energy function
 $w_{s}$
of the Skalak constitutive law is
 $$\begin{eqnarray}w_{s}=\frac{G_{s}}{2}((\unicode[STIX]{x1D706}_{1}^{2}-1)^{2}+(\unicode[STIX]{x1D706}_{2}^{2}-1)^{2}+C(\unicode[STIX]{x1D706}_{1}^{2}\unicode[STIX]{x1D706}_{2}^{2}-1)^{2}),\end{eqnarray}$$
where
 $G_{s}$
is the surface shear elastic modulus,
 $C$
is the area dilation constant and
 $\unicode[STIX]{x1D706}_{1}$
and
 $\unicode[STIX]{x1D706}_{2}$
are the principal extension ratios.
Bending stiffness is introduced by a model proposed by Helfrich (Reference Helfrich1973), and the bending energy of this model
 $w_{b}$
is described as
 $$\begin{eqnarray}w_{b}=\frac{E_{b}}{2}\int _{A}(2H-c_{0})\,\text{d}A,\end{eqnarray}$$
where
 $E_{b}$
is the bending modulus,
 $H$
is the mean curvature of the surface and
 $c_{0}$
is the spontaneous curvature. Ou-Yang & Helfrich (Reference Ou-Yang and Helfrich1989) showed that this energy is converted to a force density
 $\boldsymbol{q}_{b}$
as follows:
 $$\begin{eqnarray}\boldsymbol{q}_{b}=-2E_{b}\{\unicode[STIX]{x1D6E5}_{S}H+(2H+c_{0})(H^{2}-K-c_{0}H)\}\boldsymbol{n},\end{eqnarray}$$
where
 $\unicode[STIX]{x1D6E5}_{S}$
is the Laplace–Beltrami operator on the surface and
 $K$
is the Gaussian curvature. The spontaneous curvature
 $c_{0}$
is 0 when the two layers of the lipid membrane are symmetric, and (2.10) can be rewritten as
 $$\begin{eqnarray}\boldsymbol{q}_{b}=-2E_{b}\{\unicode[STIX]{x1D6E5}_{S}H+2H(H^{2}-K)\}\boldsymbol{n}.\end{eqnarray}$$
Note that we consider
 $H$
to be positive for a sphere.
The gravitational force exerted on the cell can be described (Pozrikidis Reference Pozrikidis1992b
; Boedec, Leonetti & Jaeger Reference Boedec, Leonetti and Jaeger2011; Suárez et al.
Reference Suárez, Leidy, Téllez, Gay and Gonzalez-Mancera2013; Boltz & Kierfeld Reference Boltz and Kierfeld2015) as a surface load
 $\boldsymbol{q}_{g}$
as
 $$\begin{eqnarray}\boldsymbol{q}_{g}=-\unicode[STIX]{x0394}\unicode[STIX]{x1D70C}(\boldsymbol{x}_{r}\boldsymbol{\cdot }\boldsymbol{g})\boldsymbol{n},\end{eqnarray}$$
where
 $\boldsymbol{x}_{r}=\boldsymbol{x}-\boldsymbol{x}_{O}$
is a vector from a reference position
 $\boldsymbol{x}_{O}$
and
 $\boldsymbol{g}$
is the vector of the gravitational acceleration. Boltz & Kierfeld (Reference Boltz and Kierfeld2015) described the pressure
 $\unicode[STIX]{x0394}\unicode[STIX]{x1D70C}(\boldsymbol{x}_{r}\boldsymbol{\cdot }\boldsymbol{g})$
as a gravitational hydrostatic pressure. In the present study, the direction of the vector is always set to the negative
 $z$
-direction as
 $\boldsymbol{g}=(0,0,-g)$
, where
 $g=|\boldsymbol{g}|$
is the gravitational acceleration.
2.3 Non-dimensional parameters
In this study, three non-dimensional parameters are considered: the Bond number
 $Bo$
, the non-dimensional bending stiffness
 $Be$
and the viscosity ratio
 $\unicode[STIX]{x1D706}$
. The Bond number
 $$\begin{eqnarray}Bo=\frac{a^{2}\unicode[STIX]{x0394}\unicode[STIX]{x1D70C}g}{G_{s}}\end{eqnarray}$$
describes the strength of the gravitational force compared to the membrane shear elastic rigidity. The non-dimensional bending stiffness
 $$\begin{eqnarray}Be=\frac{E_{b}}{G_{s}a^{2}}\end{eqnarray}$$
describes the bending rigidity compared to the shear elastic rigidity, and it corresponds to the inverse of the Föppl–von-Kármán number (Boltz & Kierfeld Reference Boltz and Kierfeld2015). By using the membrane elasticity of red blood cells,
 $G_{s}=2.5~\unicode[STIX]{x03BC}\text{N}~\text{m}^{-1}$
(Hénon et al.
Reference Hénon, Lenormand, Richert and Gallet1999; Dimitrakopoulos Reference Dimitrakopoulos2012) and
 $E_{b}=2.0\times 10^{-19}~\text{N}~\text{m}$
(Hwang & Waugh Reference Hwang and Waugh1997), each parameter is approximately
 $Bo=2.5\times 10^{-3}$
and
 $Be=1.0\times 10^{-2}$
under standard gravity. Note that the non-dimensional bending stiffness is fixed to
 $Be=1.0\times 10^{-2}$
in this paper.
3 Numerical method
In this study, the boundary element method (Pozrikidis Reference Pozrikidis1992a
) is utilized to solve the time evolution of the cell membrane. An unstructured triangular mesh with 2562 nodes and 5120 linear elements is introduced to discretise the membrane. In the boundary element method, the Gaussian quadrature is used to compute the integral over triangular elements. For singular elements, a polar coordinate is introduced to get rid of the
 $1/r$
singularity (Pozrikidis Reference Pozrikidis1995). A volume constraint (Freund Reference Freund2007) is implemented in order to avoid the accumulation of small error in the volume. In our simulation, the volume error is always kept less than
 $1.0\times 10^{-3}\,\%$
. Graphics processing unit computing is also utilized to accelerate the computation by 10–100 fold compared with that provided by conventional CPU computing (Matsunaga et al.
Reference Matsunaga, Imai, Omori, Ishikawa and Yamaguchi2014).
3.1 Surface load
As shown in the previous section, the surface load
 $\boldsymbol{q}$
in (2.1) consists of three components
 $\boldsymbol{q}=\boldsymbol{q}_{s}+\boldsymbol{q}_{b}+\boldsymbol{q}_{g}$
. For the evaluation of
 $\boldsymbol{q}_{s}$
, the finite element method (Walter et al.
Reference Walter, Salsac, Barthès-Biesel and Le Tallec2010) is introduced to solve a weak form of the equilibrium equation on the cell surface,
 $$\begin{eqnarray}\int _{A}\hat{\boldsymbol{u}}\boldsymbol{\cdot }\boldsymbol{q}_{s}\,\text{d}A=\int _{A}\hat{\unicode[STIX]{x1D700}}:\unicode[STIX]{x1D64F}\,\text{d}A,\end{eqnarray}$$
where
 $\hat{\boldsymbol{u}}$
is the virtual displacement and
 $\hat{\unicode[STIX]{x1D700}}$
is the virtual strain. The components
 $\boldsymbol{q}_{b}$
and
 $\boldsymbol{q}_{g}$
are solved using (2.10) and (2.12), respectively. The mean curvature
 $H$
, the Gaussian curvature
 $K$
and the Laplace–Beltrami operator
 $\unicode[STIX]{x1D6E5}_{S}H$
of (2.10) are evaluated over linear triangular elements (Meyer et al.
Reference Meyer, Desbrun, Schröder, Barr, Hege and Polthier2003; Biben, Farutin & Misbah Reference Biben, Farutin and Misbah2011; Boedec et al.
Reference Boedec, Leonetti and Jaeger2011).
3.2 Time integration
The membrane velocity is given by the kinematic condition:
 $$\begin{eqnarray}\frac{\text{d}\boldsymbol{x}}{\text{d}t}=\boldsymbol{v}(\boldsymbol{x}).\end{eqnarray}$$
A small discrete time
 $\unicode[STIX]{x0394}t$
is required for the evaluation of the bending force
 $\boldsymbol{q}_{b}$
and the in-plane stretching force
 $\boldsymbol{q}_{s}$
(Walter et al.
Reference Walter, Salsac, Barthès-Biesel and Le Tallec2010), especially for simulations with small deformations. In order to avoid long computational times arising from the small time step
 $\unicode[STIX]{x0394}t$
, semi-implicit schemes have been introduced in some previous studies of vesicle simulations (Veerapaneni et al.
Reference Veerapaneni, Gueyffier, Zorin and Biros2009; Boedec et al.
Reference Boedec, Leonetti and Jaeger2011). In the present study, a Crank–Nicolson method is used to update the position of the membrane material points. Equations
 $$\begin{eqnarray}\displaystyle & \displaystyle \boldsymbol{x}^{n+1}=\boldsymbol{x}^{n}+\frac{\unicode[STIX]{x0394}t}{2}\{\boldsymbol{v}(\boldsymbol{x}^{n})+\boldsymbol{v}(\boldsymbol{x}^{n+1})\}, & \displaystyle\end{eqnarray}$$
 $$\begin{eqnarray}\displaystyle & \displaystyle \boldsymbol{v}(\boldsymbol{x}^{n})=-\frac{1}{8\unicode[STIX]{x03C0}\unicode[STIX]{x1D707}}\int _{A}\unicode[STIX]{x1D645}^{n}\boldsymbol{\cdot }\boldsymbol{q}^{n}\,\text{d}A+\frac{1-\unicode[STIX]{x1D706}}{8\unicode[STIX]{x03C0}}\int _{A}\boldsymbol{v}^{n}\boldsymbol{\cdot }\unicode[STIX]{x1D646}^{n}\boldsymbol{\cdot }\boldsymbol{n}^{n}\,\text{d}A, & \displaystyle\end{eqnarray}$$
are solved iteratively until the difference between the left-hand side and right-hand side of (3.3) becomes less than
 $1.0\times 10^{-10}a$
, where the superscript
 $n$
indicates the time step. For stable convergence, sub-iterations with a small discrete time
 $\unicode[STIX]{x0394}t^{\prime }=\unicode[STIX]{x0394}t/M$
are introduced before the main process of (3.3) and (3.4), where
 $M$
is 5 or 10. During this sub-iteration, the first-order Euler method is utilized for the position update as
 $$\begin{eqnarray}\displaystyle & \displaystyle \boldsymbol{x}^{m+1}=\boldsymbol{x}^{m}+\boldsymbol{v}(\boldsymbol{x}^{m})\unicode[STIX]{x0394}t^{\prime }, & \displaystyle\end{eqnarray}$$
 $$\begin{eqnarray}\displaystyle & \displaystyle \boldsymbol{v}(\boldsymbol{x}^{m})=-\frac{1}{8\unicode[STIX]{x03C0}\unicode[STIX]{x1D707}}\int _{A}\unicode[STIX]{x1D645}^{n}\boldsymbol{\cdot }\boldsymbol{q}^{m}\,\text{d}A+\frac{1-\unicode[STIX]{x1D706}}{8\unicode[STIX]{x03C0}}\int _{A}\boldsymbol{v}^{m}\boldsymbol{\cdot }\unicode[STIX]{x1D646}^{n}\boldsymbol{\cdot }\boldsymbol{n}^{m}\,\text{d}A, & \displaystyle\end{eqnarray}$$
where
 $m$
is the time step of the sub-iteration. During the sub-iteration loop, the Green’s functions
 $\unicode[STIX]{x1D645}$
and
 $\unicode[STIX]{x1D646}$
at time step
 $n$
is used for the acceleration. The temporal position
 $\boldsymbol{x}^{(n+1)\ast }$
is obtained after
 $M$
sub-iterations. This temporal positions are used as the initial position for the main iteration, (3.3) and (3.4).
3.3 Red blood cell model
A number of previous studies (Ramanujan & Pozrikidis Reference Ramanujan and Pozrikidis1998; Sui et al. Reference Sui, Chew, Roy and Low2008; Omori et al. Reference Omori, Ishikawa, Imai and Yamaguchi2013) used a biconcave shape reported by Evans & Fung (Reference Evans and Fung1972) as a reference stress-free shape of the red blood cell. Some recent studies (Peng, Mashayekh & Zhu Reference Peng, Mashayekh and Zhu2014; Tsubota, Wada & Liu Reference Tsubota, Wada and Liu2014; Sinha & Graham Reference Sinha and Graham2015) suggest that the stress-free shape is close to a nearly spherical ellipsoid rather than a biconcave shape.
The spheroid, which has a single semi-axis of length
 $b_{1}$
and two semi-axes of length
 $b_{2}$
, is categorized as a prolate spheroid when the aspect ratio
 $\unicode[STIX]{x1D6FD}=b_{2}/b_{1}<1$
, while it is categorized as an oblate spheroid when
 $\unicode[STIX]{x1D6FD}>1$
. In the present study, the shape of the red blood cell is obtained by minimizing the energy (relaxation) of a capsule with an oblate stretch-free shape and spontaneous curvature
 $c_{0}=0$
. During the relaxation, deformation change of the initially oblate sphere is simulated in the absence of gravity until the shape converges. The final steady shape is determined by the interplay of several factors: stretch-free shape, non-dimensional bending stiffness
 $Be$
, spontaneous curvature
 $c_{0}$
and reduced volume
 $\unicode[STIX]{x1D70F}$
. Note that the reduced volume
 $\unicode[STIX]{x1D70F}=6\sqrt{\unicode[STIX]{x03C0}}VA^{-1.5}$
is a value that describes the ratio between the volume
 $V$
and surface area
 $A$
of an object. In this study, the aspect ratio of the oblate spheroid is set to
 $\unicode[STIX]{x1D6FD}=3.9$
(corresponding to a reduced volume
 $\unicode[STIX]{x1D70F}\approx 0.6$
) in order to have a similar reduced volume as real cells,
 $\unicode[STIX]{x1D70F}_{rbc}\approx 0.637$
(Evans & Fung Reference Evans and Fung1972). The Skalak constitutive law with area dilation constant
 $C=10$
is utilized, and the bending stiffness
 $Be=1.0\times 10^{-2}$
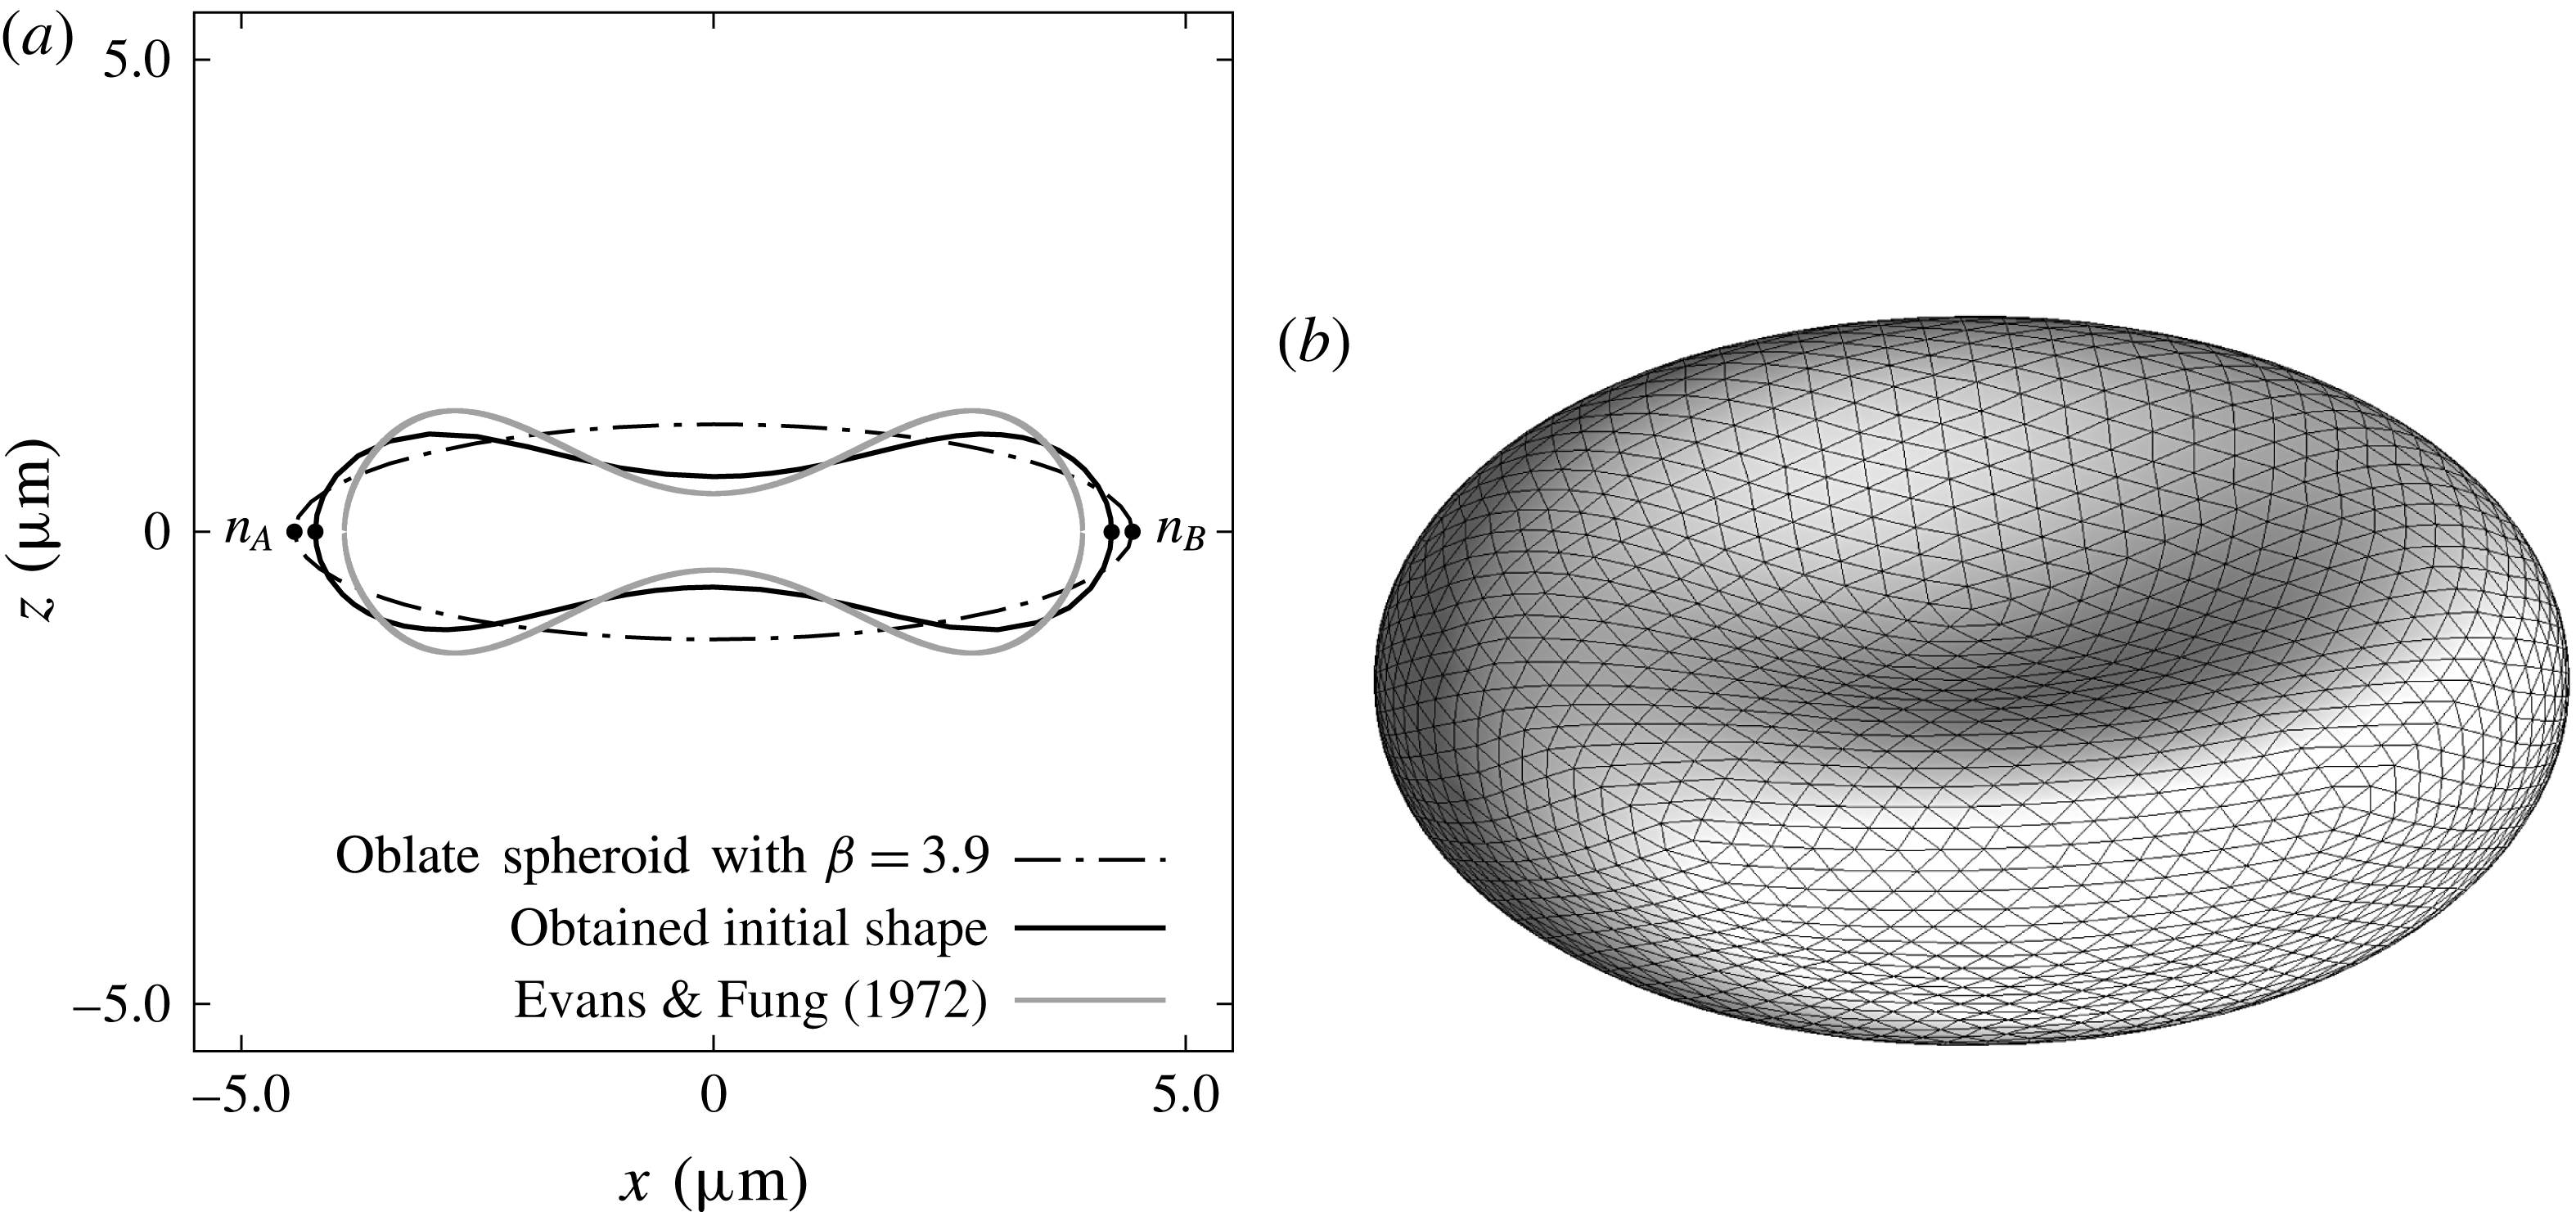
is set as the same as a real cell. Figure 1 shows the shape before and after the relaxation. We see that the resultant shape is similar to that reported in Evans & Fung (Reference Evans and Fung1972).
4 Result
The motions of red blood cells are examined with the viscosity ratio
 $0.5\leqslant \unicode[STIX]{x1D706}\leqslant 10.0$
, the Bond number
 $2.5\times 10^{-3}\leqslant Bo\leqslant 2.5\times 10^{-1}$
and the initial orientation angle
 $0\leqslant \unicode[STIX]{x1D703}_{0}\leqslant \unicode[STIX]{x03C0}/2$
. When a single cell settles in plasma under standard gravity, the Bond number is estimated as
 $Bo=2.5\times 10^{-3}$
, and high
 $Bo$
corresponds to the settling under centrifugation (Hoffman & Inoué Reference Hoffman and Inoué2006). The accuracy of our simulation is validated in appendix A.
Cross-sectional (a) and three-dimensional (b) view of the initial shape of the red blood cell. Obtained shape is compared with a previous study (Evans & Fung Reference Evans and Fung1972). Material points
 $n_{A}$
and
 $n_{B}$
are used to define the instantaneous orientation angle of the red blood cell in the later sections.

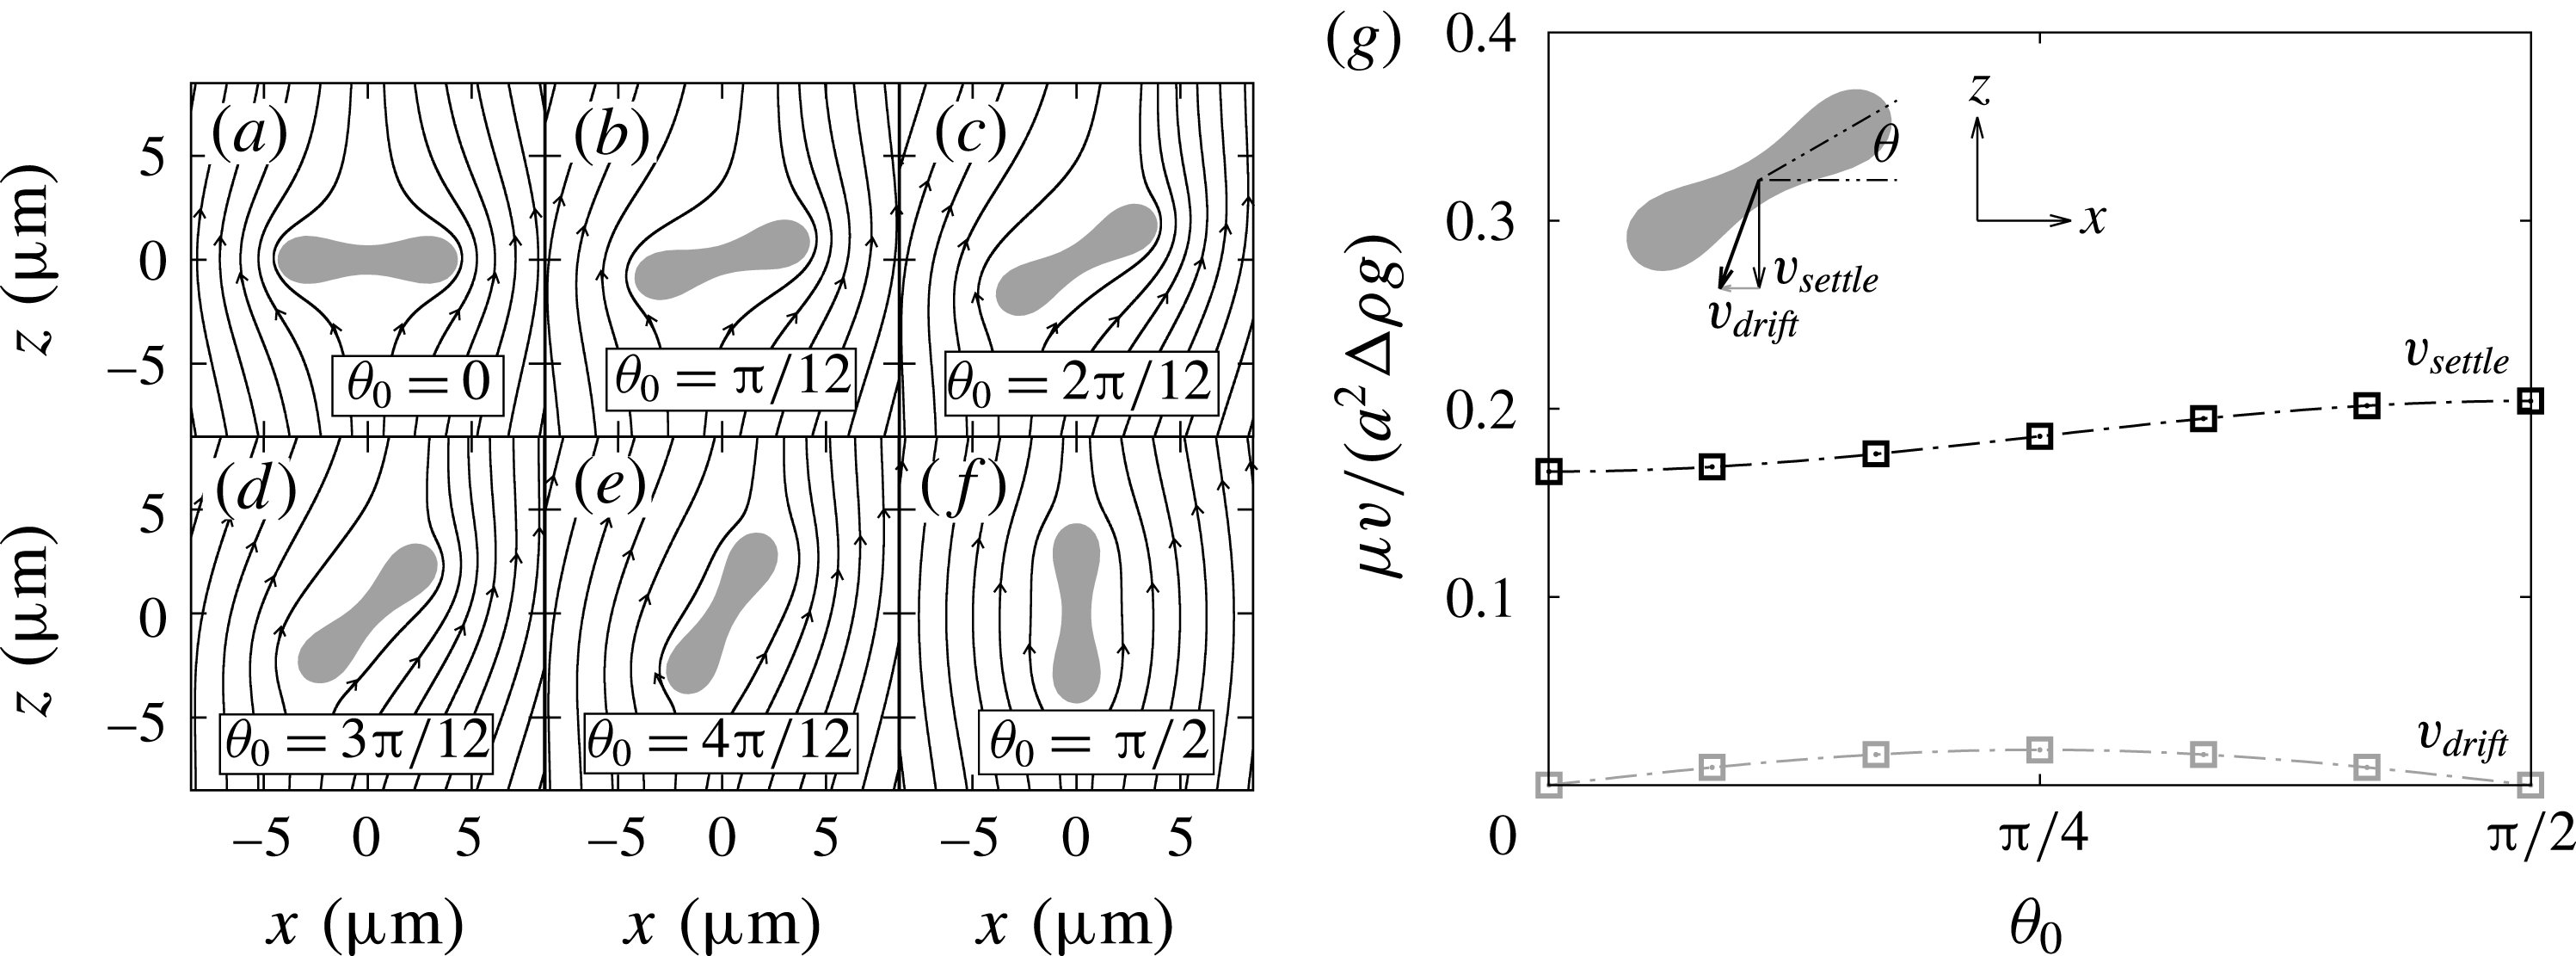
Left figures (a)–(f) show red blood cells with different initial orientation angles settling downwards. Lines around the cells are streamlines in the cell frame. The right figure (g) shows the settling and drifting velocity as a function of the initial orientation angle
 $\unicode[STIX]{x1D703}_{0}$
. Dotted lines are given by (4.3) and (4.4).

4.1 Sedimentation under standard gravity
Sedimentation of a single red blood cell under standard gravity,
 $Bo=2.5\times 10^{-3}$
, is shown in this section. The simulation was executed with seven different initial orientation angles
 $\unicode[STIX]{x1D703}_{0}$
as shown in figure 2. Since the angular velocity was small under this condition, the effect of the reorientation is neglected, and the plotted velocities are obtained after converging to constant values. The settling velocity
 $v_{settle}$
and the drifting velocity
 $v_{drift}$
of a rigid oblate spheroid can be analytically obtained (Happel & Brenner Reference Happel and Brenner1963; Kim & Karrila Reference Kim and Karrila1991) as
 $$\begin{eqnarray}\displaystyle & \displaystyle \frac{\unicode[STIX]{x1D707}}{a^{2}\unicode[STIX]{x0394}\unicode[STIX]{x1D70C}g}v_{settle}(\unicode[STIX]{x1D6FD},\unicode[STIX]{x1D703}_{0})=\frac{2}{9}\unicode[STIX]{x1D6FD}^{-1/3}\left(\frac{\sin ^{2}\unicode[STIX]{x1D703}_{0}}{X^{A}}+\frac{\cos ^{2}\unicode[STIX]{x1D703}_{0}}{Y^{A}}\right), & \displaystyle\end{eqnarray}$$
 $$\begin{eqnarray}\displaystyle & \displaystyle \frac{\unicode[STIX]{x1D707}}{a^{2}\unicode[STIX]{x0394}\unicode[STIX]{x1D70C}g}v_{drift}(\unicode[STIX]{x1D6FD},\unicode[STIX]{x1D703}_{0})=\frac{2}{9}\unicode[STIX]{x1D6FD}^{-1/3}\sin \unicode[STIX]{x1D703}_{0}\cos \unicode[STIX]{x1D703}_{0}\left(\frac{1}{Y^{A}}-\frac{1}{X^{A}}\right), & \displaystyle\end{eqnarray}$$
where
 $X^{A}=4e^{3}\{3(2e^{2}-1)Z+3e\sqrt{1-e^{2}}\}^{-1}$
,
 $Y^{A}=8e^{3}\{3(2e^{2}+1)Z-3e\sqrt{1-e^{2}}\}^{-1}$
,
 $Z(e)=\tan ^{-1}(e/\sqrt{1-e^{2}})$
and
 $e=\sqrt{1-\unicode[STIX]{x1D6FD}^{-2}}$
is the eccentricity. Note that the rigid ellipsoid does not change orientation during sedimentation, due to its shape symmetry. Figure 2(g) shows the settling velocity
 $v_{settle}$
and the drifting velocity
 $v_{drift}$
as a function of the initial orientation angle, and both velocities have curves similar to that of an oblate spheroid (4.1) and (4.2). The maximum settling velocity is roughly
 $\unicode[STIX]{x1D707}v_{settle}/(a^{2}\unicode[STIX]{x0394}\unicode[STIX]{x1D70C}g)=0.2$
, and it is slightly slower than expected from Stokes’ law
 $\unicode[STIX]{x1D707}U/(a^{2}\unicode[STIX]{x0394}\unicode[STIX]{x1D70C}g)=2/9$
. The settling velocity
 $v_{settle}$
at
 $\unicode[STIX]{x1D703}=\unicode[STIX]{x03C0}/2$
is 1.23 times faster than that at
 $\unicode[STIX]{x1D703}=0$
, and the ratio is close to the value 1.38 that is reported by Canham et al. (Reference Canham, Jay and Tilsworth1971).
Settling and drifting velocity of a single red blood cell under standard gravity, when assuming that the initial orientation is totally random and the angular velocity is negligible. Note that parameters
 $a=2.82~\unicode[STIX]{x03BC}\text{m}$
,
 $\unicode[STIX]{x1D707}=0.79\times 10^{-3}~\text{Pa}~\text{s}$
,
 $\unicode[STIX]{x0394}\unicode[STIX]{x1D70C}=0.091~\text{g}~\text{cm}^{-3}$
and
 $g=9.8~\text{m}~\text{s}^{-2}$
obtained from the experiment (Groom & Anderson Reference Groom and Anderson1972) are used to convert the result to real units.

Equations (4.1) and (4.2) can be rewritten as
 $$\begin{eqnarray}\displaystyle & \displaystyle v_{settle}=v_{\unicode[STIX]{x03C0}/2}\sin ^{2}\unicode[STIX]{x1D703}+v_{0}\cos ^{2}\unicode[STIX]{x1D703}, & \displaystyle\end{eqnarray}$$
 $$\begin{eqnarray}\displaystyle & \displaystyle v_{drift}=\sin \unicode[STIX]{x1D703}\cos \unicode[STIX]{x1D703}(v_{0}-v_{\unicode[STIX]{x03C0}/2}), & \displaystyle\end{eqnarray}$$
where
 $v_{0}=v_{settle}|_{\unicode[STIX]{x1D703}=0}$
and
 $v_{\unicode[STIX]{x03C0}/2}=v_{settle}|_{\unicode[STIX]{x1D703}=\unicode[STIX]{x03C0}/2}$
are the settling velocity at
 $\unicode[STIX]{x1D703}=0$
and
 $\unicode[STIX]{x03C0}/2$
respectively, and we determine these two non-dimensional velocities to be
 $\unicode[STIX]{x1D707}v_{0}/(a^{2}\unicode[STIX]{x0394}\unicode[STIX]{x1D70C}g)\approx 1.67\times 10^{-1}$
and
 $\unicode[STIX]{x1D707}v_{\unicode[STIX]{x03C0}/2}/(a^{2}\unicode[STIX]{x0394}\unicode[STIX]{x1D70C}g)\approx 2.04\times 10^{-1}$
from the simulation. As shown in figure 2(g), equations (4.3) and (4.4) with these values predict well the settling and drifting velocities at arbitrary orientation angles. When the orientation angles of red blood cells are random, the mean velocity and its standard deviation are given by
 $$\begin{eqnarray}\displaystyle & \displaystyle v_{settle}=\frac{1}{2}(v_{0}+v_{\unicode[STIX]{x03C0}/2})\pm \frac{|v_{\unicode[STIX]{x03C0}/2}-v_{0}|}{2\sqrt{2}}, & \displaystyle\end{eqnarray}$$
 $$\begin{eqnarray}\displaystyle & \displaystyle v_{drift}=\frac{v_{0}-v_{\unicode[STIX]{x03C0}/2}}{\unicode[STIX]{x03C0}}\pm |v_{\unicode[STIX]{x03C0}/2}-v_{0}|\sqrt{\frac{1}{8}-\frac{1}{\unicode[STIX]{x03C0}^{2}}}. & \displaystyle\end{eqnarray}$$
The maximum, minimum and mean velocities are compared with a previous study (Groom & Anderson Reference Groom and Anderson1972) in table 1. Though the mean velocity is in good agreement, the maximum and minimum velocities deviate from the experiment. This disagreement can be explained by individual variabilities in the density difference
 $\unicode[STIX]{x0394}\unicode[STIX]{x1D70C}$
and the size
 $a$
among the cells, which is reported in Groom & Anderson (Reference Groom and Anderson1972), while we kept those parameters constant.
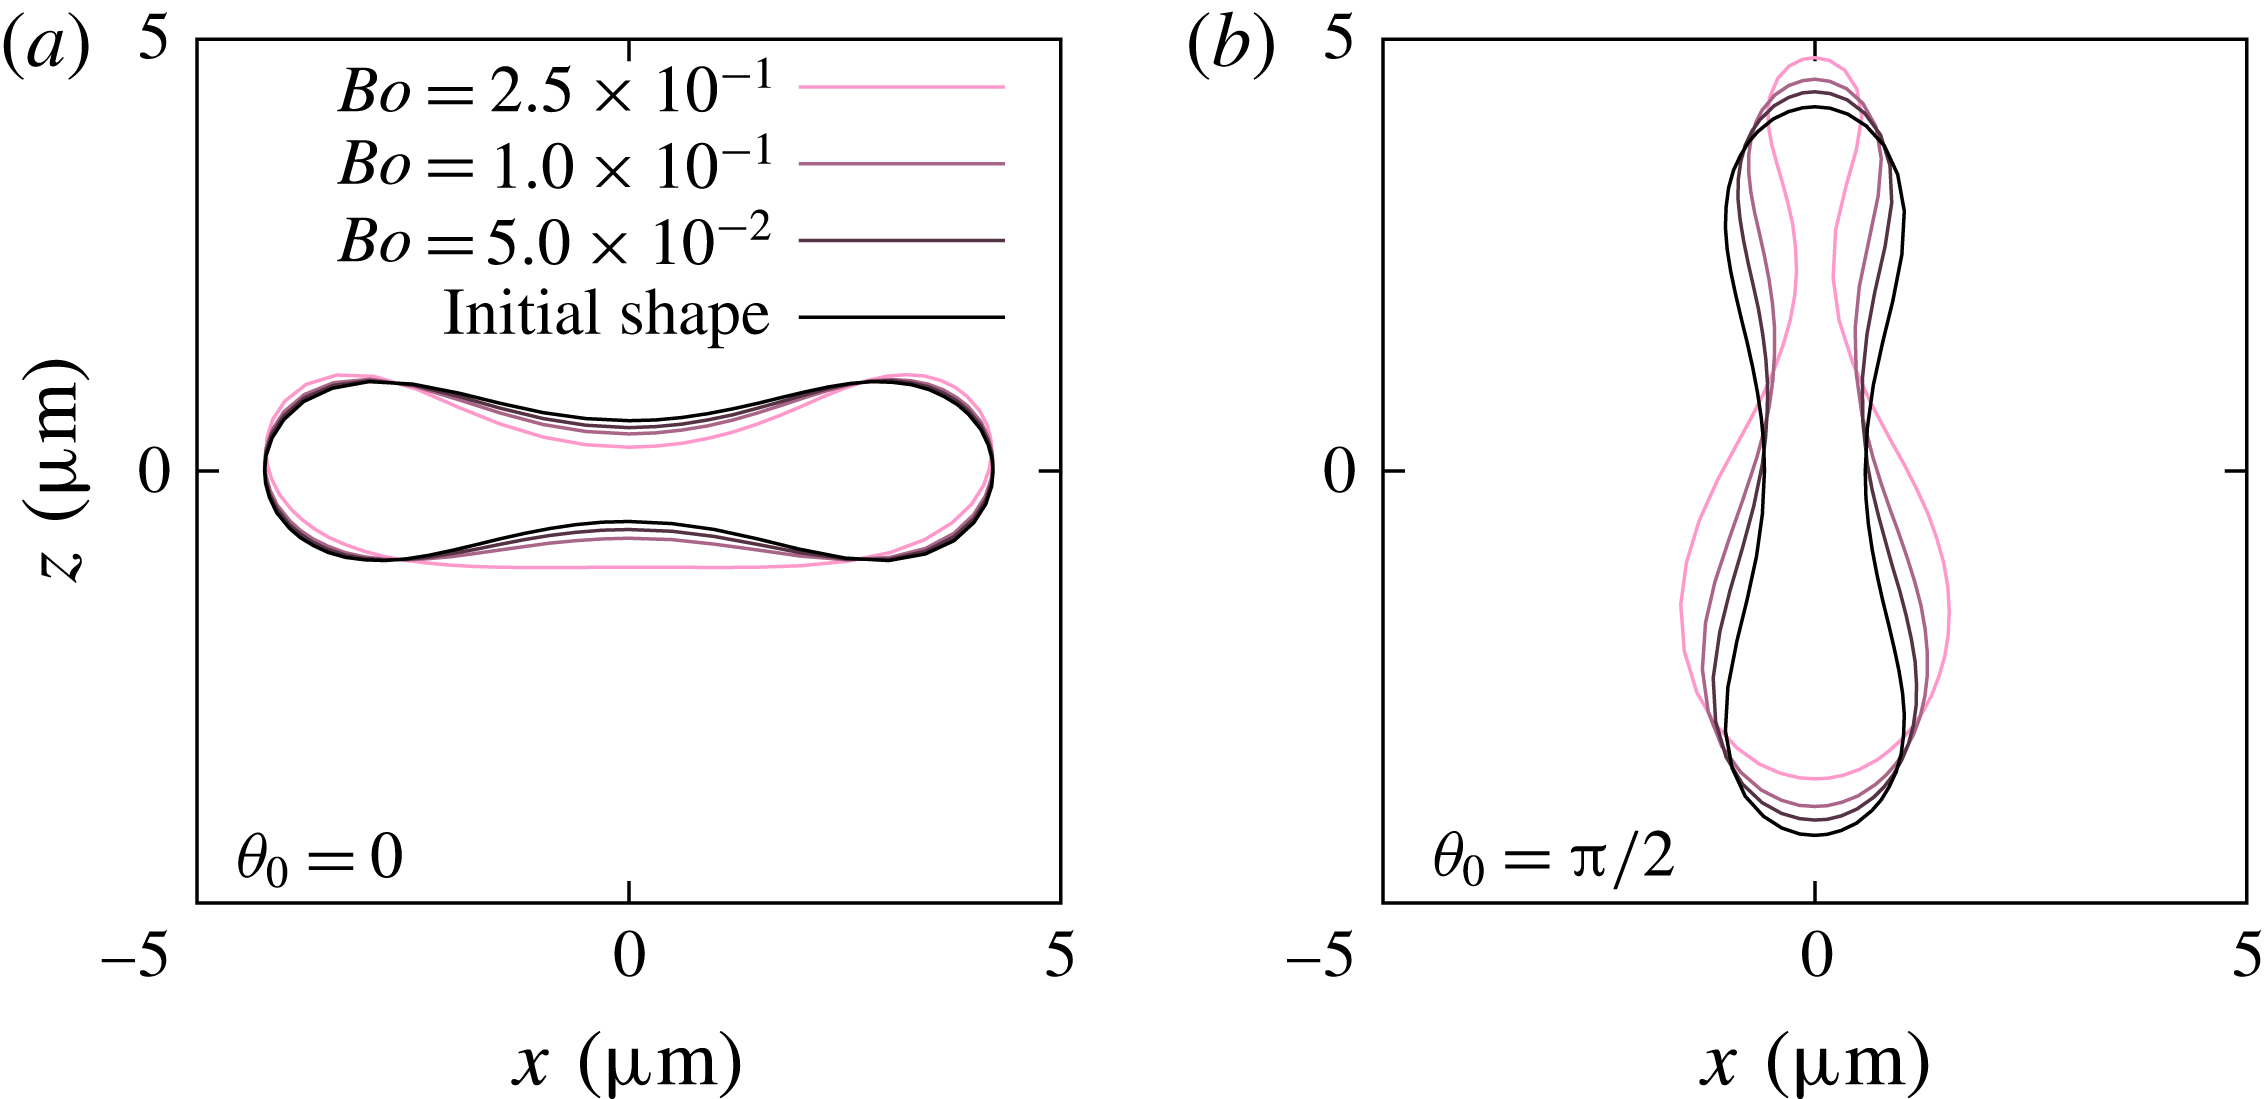
Cross-sectional view of a single settling red blood cell. Direction of gravitation is downwards (negative
 $z$
-direction). Note that the stationary shape does not depend on the viscosity ratio
 $\unicode[STIX]{x1D706}$
.

4.2 Shape and orientation
Next, the Bond number increases to
 $2.5\times 10^{-2}\leqslant Bo\leqslant 2.5\times 10^{-1}$
. Cross-sectional views of red blood cells are shown in figure 3 for the initial orientation angles
 $\unicode[STIX]{x1D703}_{0}=0$
and
 $\unicode[STIX]{x03C0}/2$
. The red blood cell goes to a parachute shape when starting from
 $\unicode[STIX]{x1D703}_{0}=0$
, while it shows a ‘bag-like shape’ (Hoffman & Inoué Reference Hoffman and Inoué2006) for
 $\unicode[STIX]{x1D703}=\unicode[STIX]{x03C0}/2$
. Note that changes of the surface area are always less than 0.2 % even under large deformations. The stationary shape does not depend on the viscosity ratio
 $\unicode[STIX]{x1D706}$
, though
 $\unicode[STIX]{x1D706}$
affects the time to reach the stationary shape. Due to the plane symmetry about the (
 $y,z$
)-plane, the red blood cell does not change its orientation during sedimentation and keeps settling downwards without drifting.
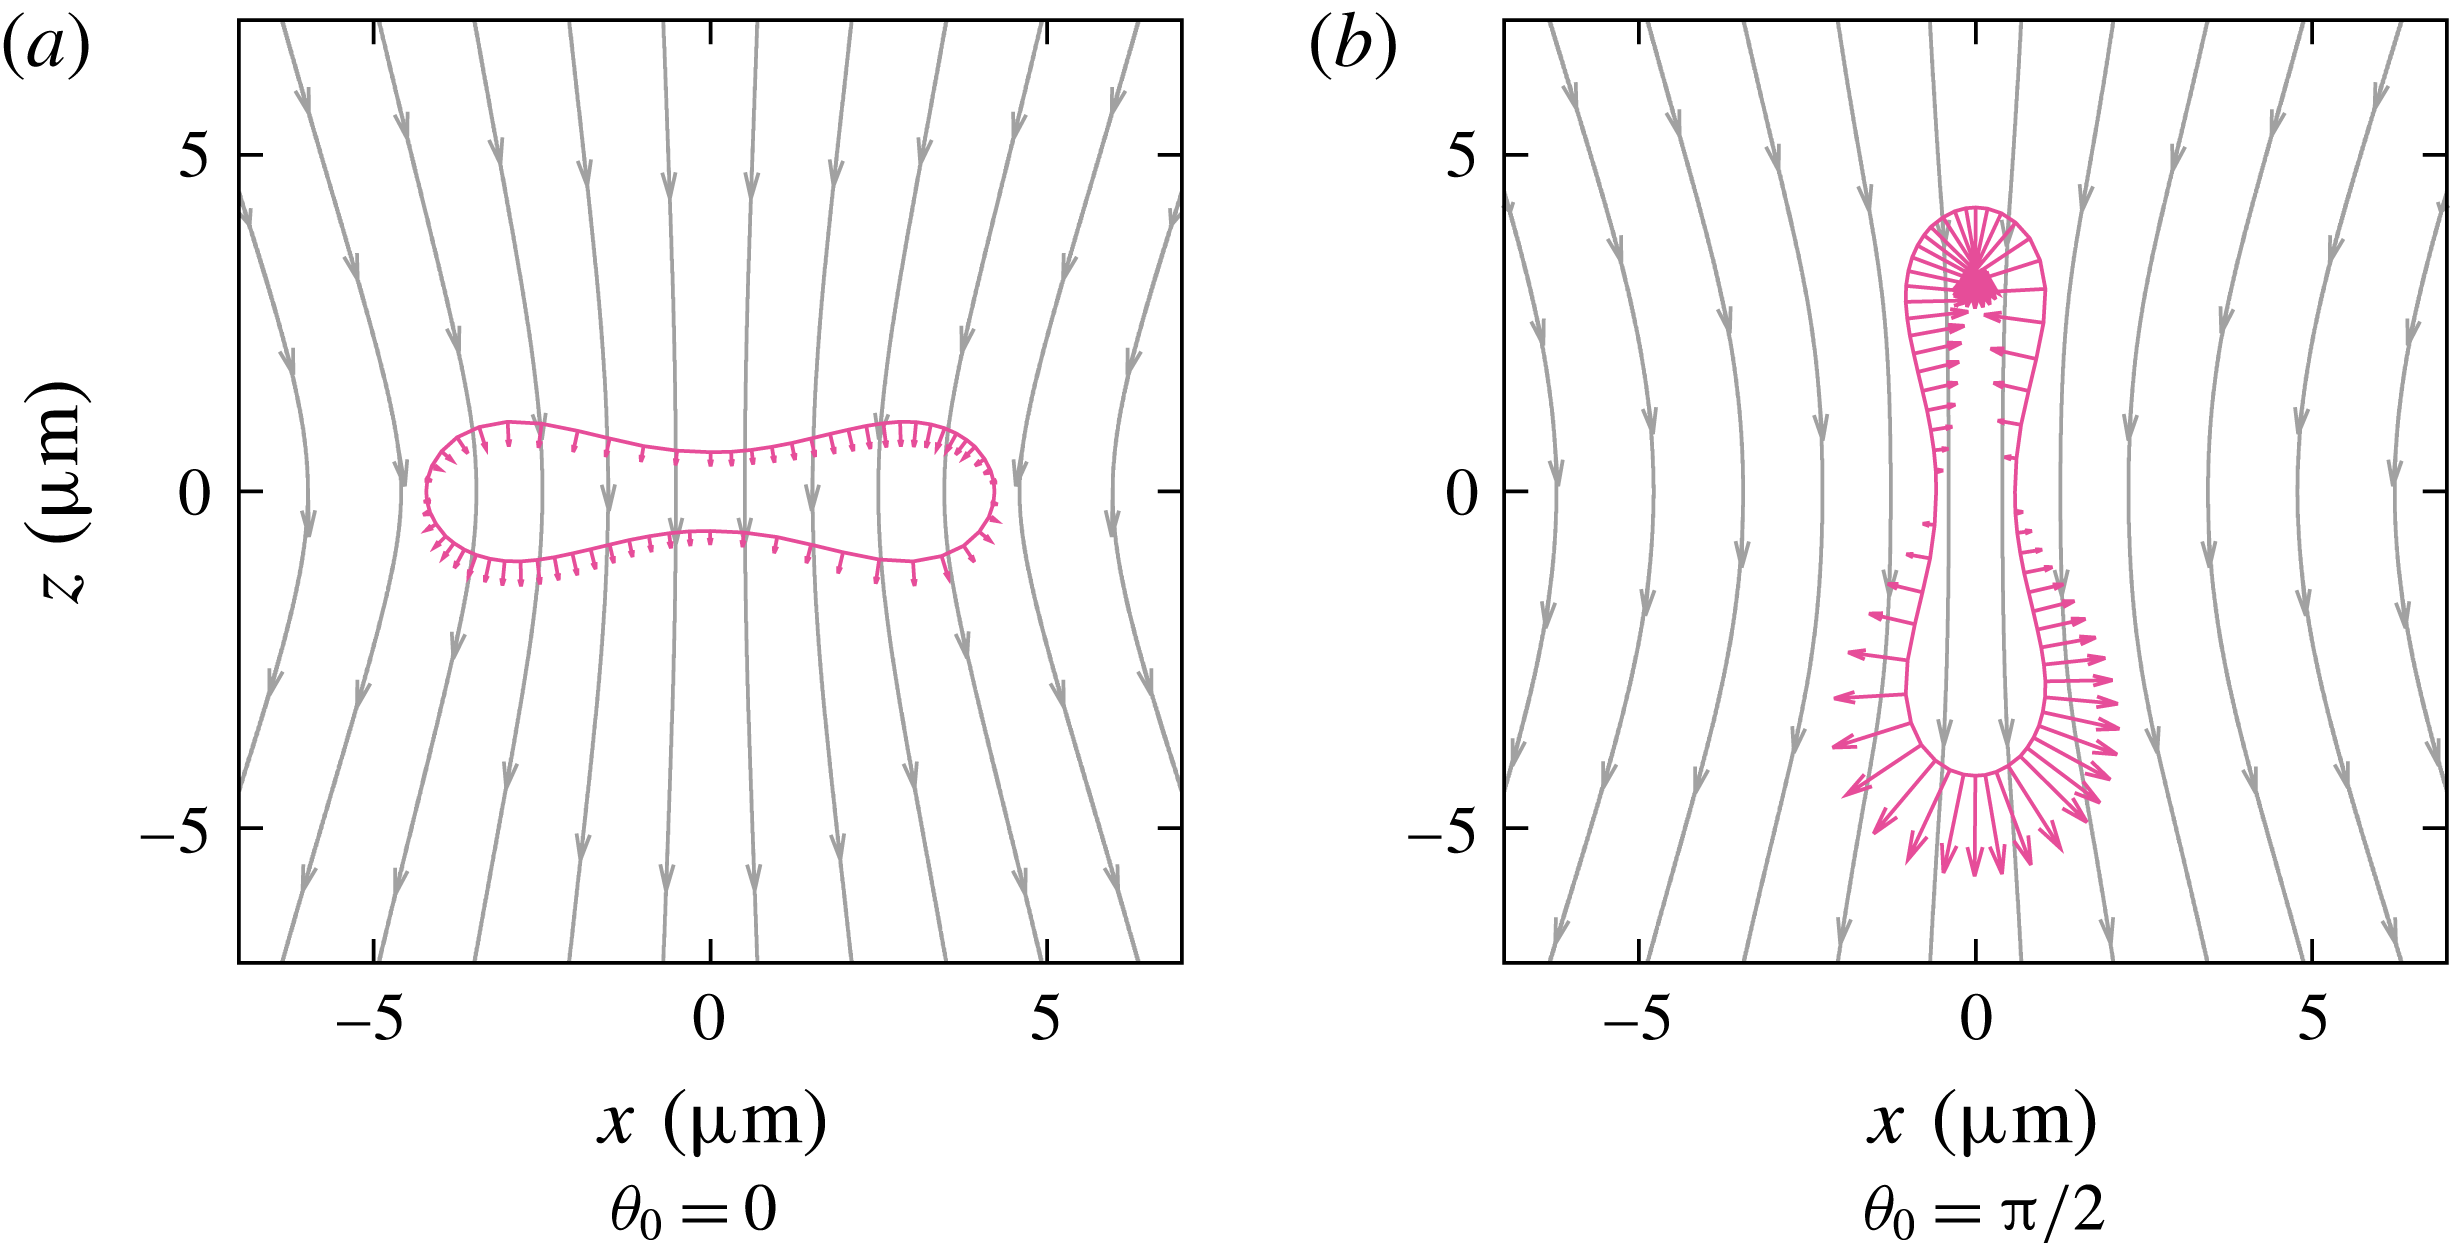
Cross-sectional view of a single settling red blood cell at the initial state, and streamlines in the laboratory frame. Vectors on the cell membrane show force acting on the membrane due to the pressure difference (2.12), where
 $z=0$
is the reference height of the pressure.

Figure 4 shows the direction of the gravitational hydrostatic pressure (2.12). The difference in the pressure between the upper part (positive
 $z$
-direction) and lower part (negative
 $z$
-direction) would drive the red blood cells to deform asymmetrically in the gravitational direction: the upper part is compressed while the lower part is stretched in the (
 $x,y$
)-plane. When the cell shapes at the two initial angles are compared under the same
 $Bo$
,
 $\unicode[STIX]{x1D703}_{0}=\unicode[STIX]{x03C0}/2$
shows larger asymmetry compared to
 $\unicode[STIX]{x1D703}_{0}=0$
since the hydrostatic pressure difference is larger at
 $\unicode[STIX]{x1D703}=\unicode[STIX]{x03C0}/2$
.
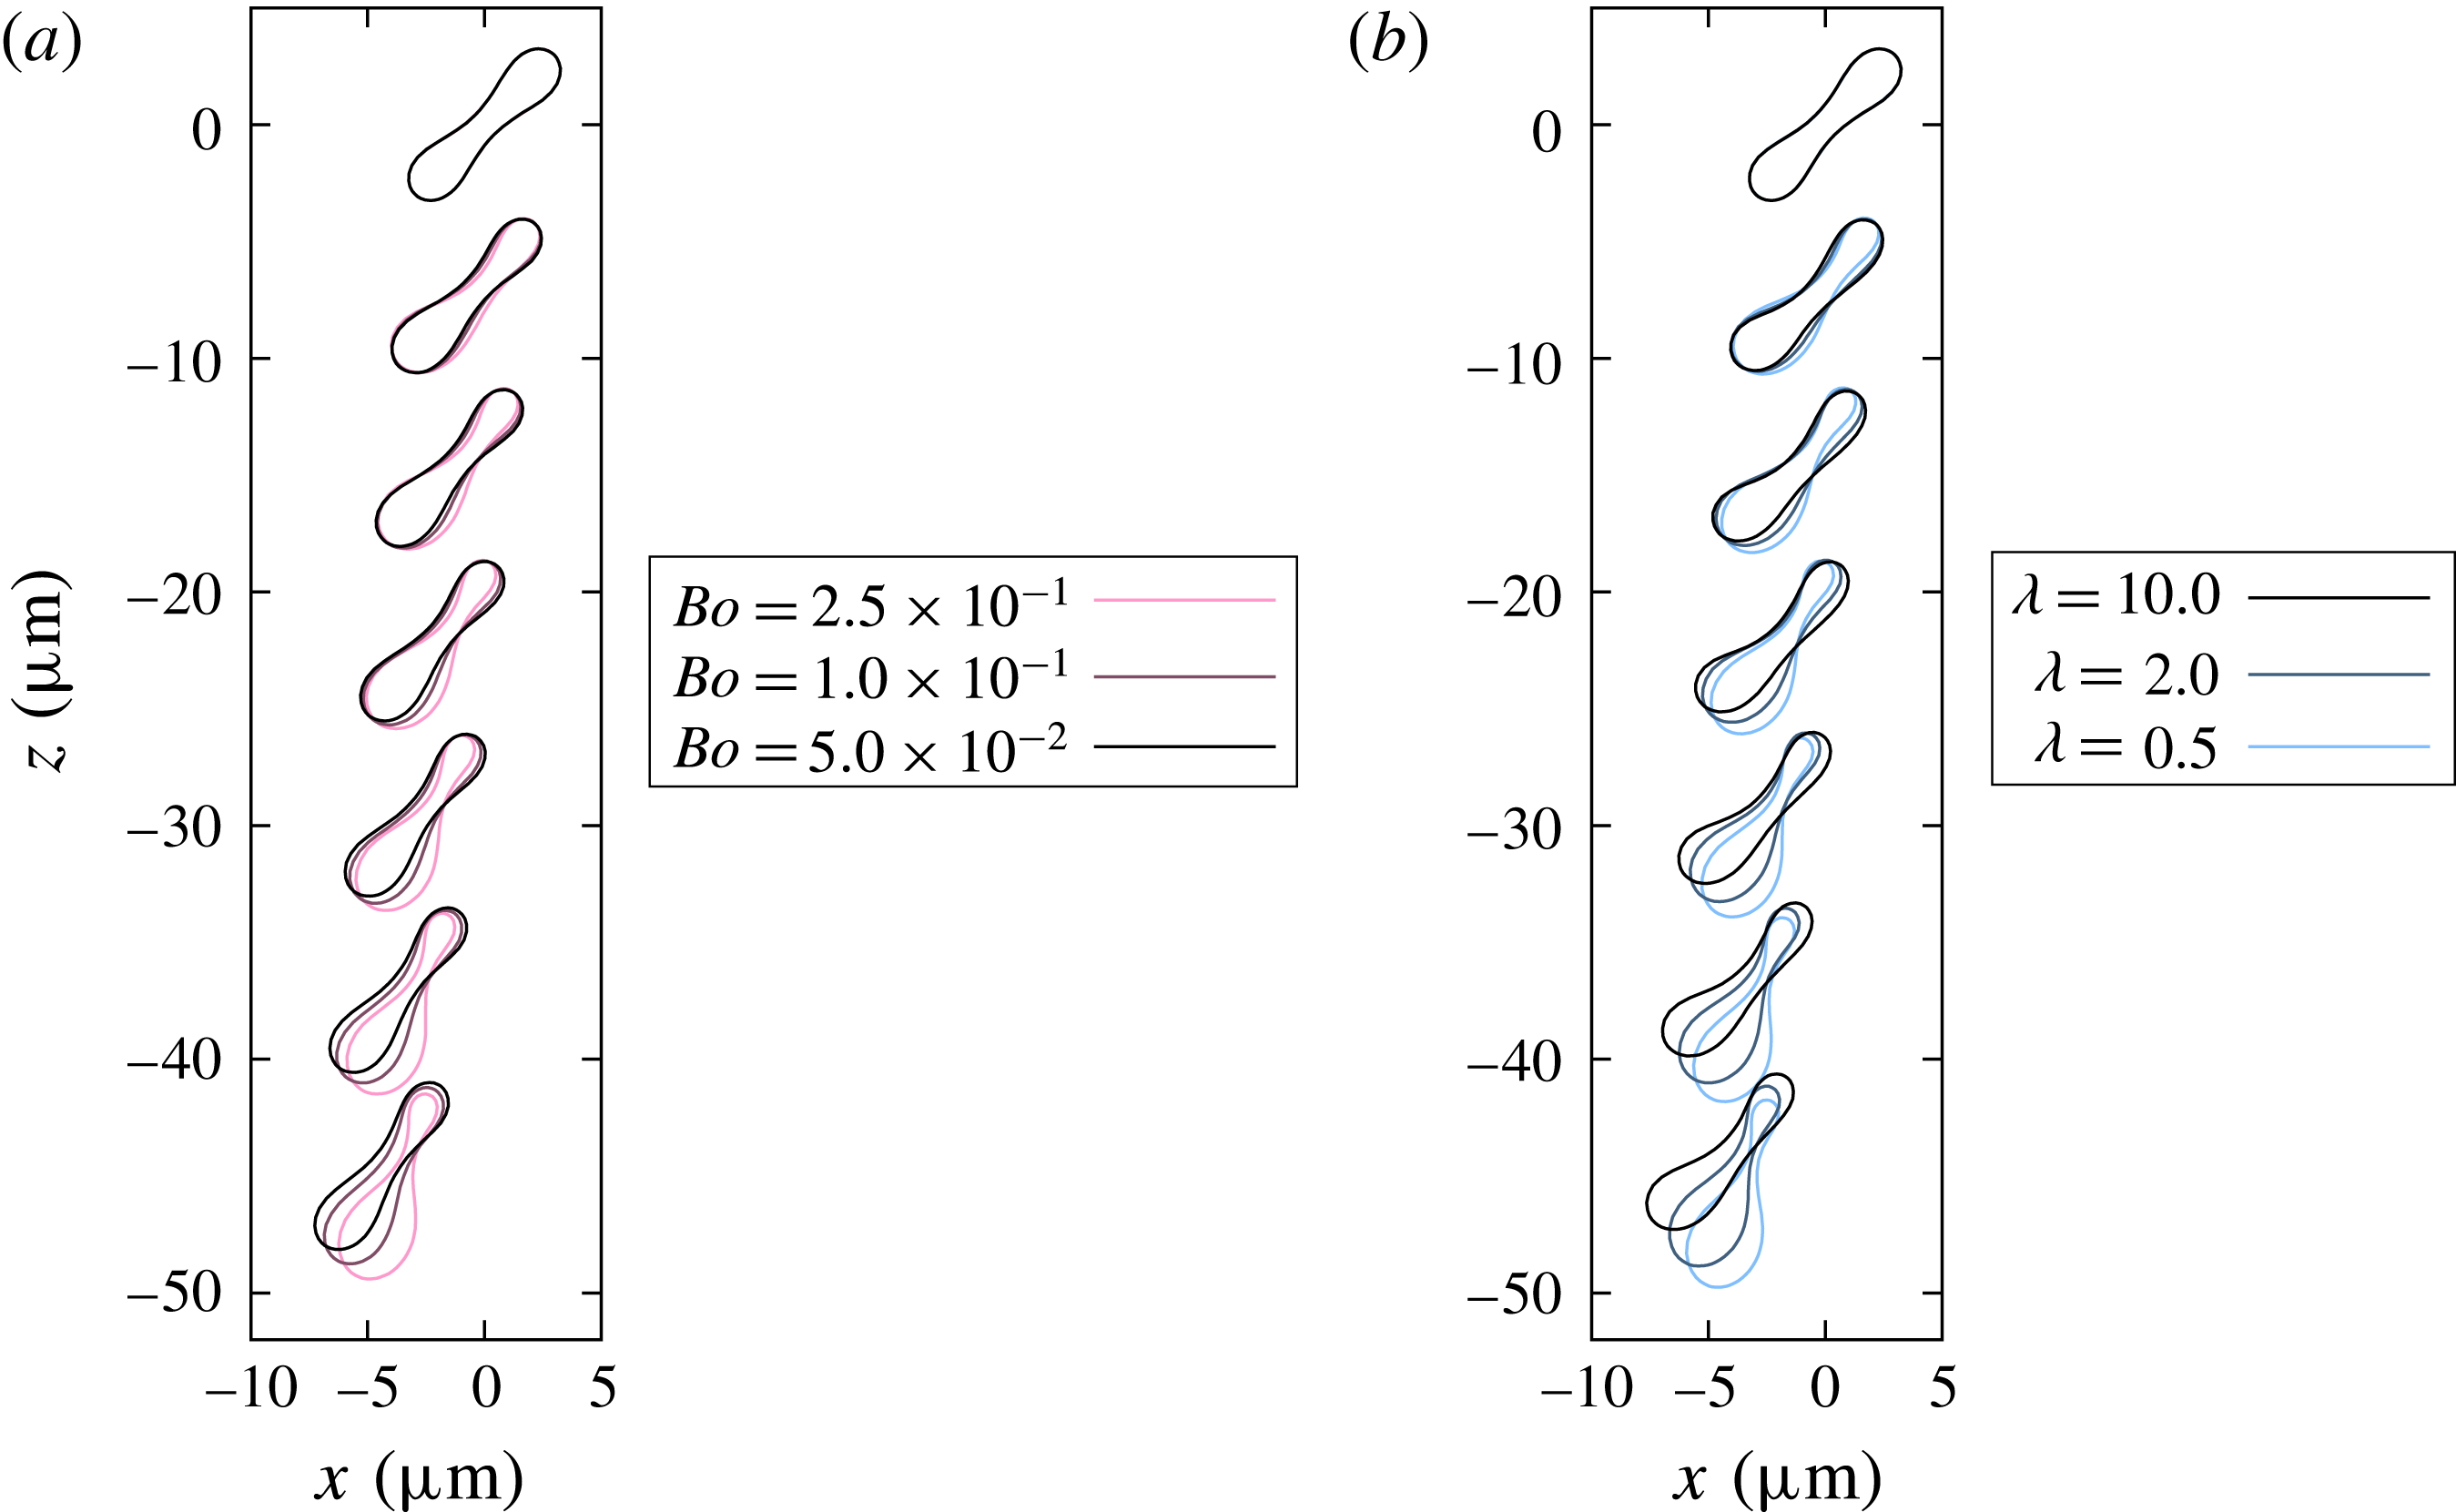
Sedimentation process of a single red blood cell under (a) constant viscosity ratio
 $\unicode[STIX]{x1D706}=1$
but different Bond number and (b) constant Bond number
 $Bo=2.5\times 10^{-1}$
but different viscosity ratio. The initial orientation angle is
 $\unicode[STIX]{x1D703}_{0}=\unicode[STIX]{x03C0}/4$
, and shapes of the red blood cell are shown in intervals of
 $(a\unicode[STIX]{x0394}\unicode[STIX]{x1D70C}g)t/\unicode[STIX]{x1D707}=14$
.

When the initial orientation is not
 $\unicode[STIX]{x1D703}_{0}=0$
or
 $\unicode[STIX]{x03C0}/2$
, the orientation of the cell dynamically changes during the settling process. Figure 5 shows that red blood cells change their orientations toward
 $\unicode[STIX]{x1D703}=\unicode[STIX]{x03C0}/2$
while settling, regardless of the Bond number and the viscosity ratio. For a sufficiently long settling, we observe that red blood cells reorient completely toward
 $\unicode[STIX]{x1D703}=\unicode[STIX]{x03C0}/2$
and their shapes converge to the same shape as shown in figure 3(b). Cell motion under
 $Bo=2.5\times 10^{-1}$
is also shown in the supplementary movie available at http://dx.doi.org/10.1017/jfm.2016.601. Hoffman & Inoué (Reference Hoffman and Inoué2006) reported that red blood cells orient vertically when a sufficiently large gravitational acceleration is applied. The observed reorientation phenomenon is in good agreement with the experimental result. From the figure, it is also found that the speed of the reorientation is faster for higher Bond number or lower viscosity ratio. The angular velocity and the mechanism of the reorientation are discussed in detail in §§ 4.3 and 4.4. At same time as the reorientation, the red blood cells show drifting movement in the horizontal direction, which was not observed in the cases of
 $\unicode[STIX]{x1D703}_{0}=0$
and
 $\unicode[STIX]{x03C0}/2$
.
Peltomaki & Gompper (Reference Peltomaki and Gompper2013) reported that there are three different steady-state shapes for red blood cell sedimentation: parachute, teardrop and fin-tailed spheres. In present study, all the red blood cells changed their orientation toward the vertical angle and deformed into a teardrop shape. Peltomaki & Gompper (Reference Peltomaki and Gompper2013) observed parachute shapes when applying low gravitational forces to red blood cells with relatively high bending stiffness, while fin-tailed shapes were observed when applying high gravitational forces to cells with small bending stiffness. In the present study, we concentrate on the same non-dimensional bending stiffness
 $Be$
(Föppl–von-Kármán number) as real red blood cells. By changing the bending stiffness or setting a larger range of the Bond number, the red blood cell model in this study might also show the parachute or the fin-tailed shape.
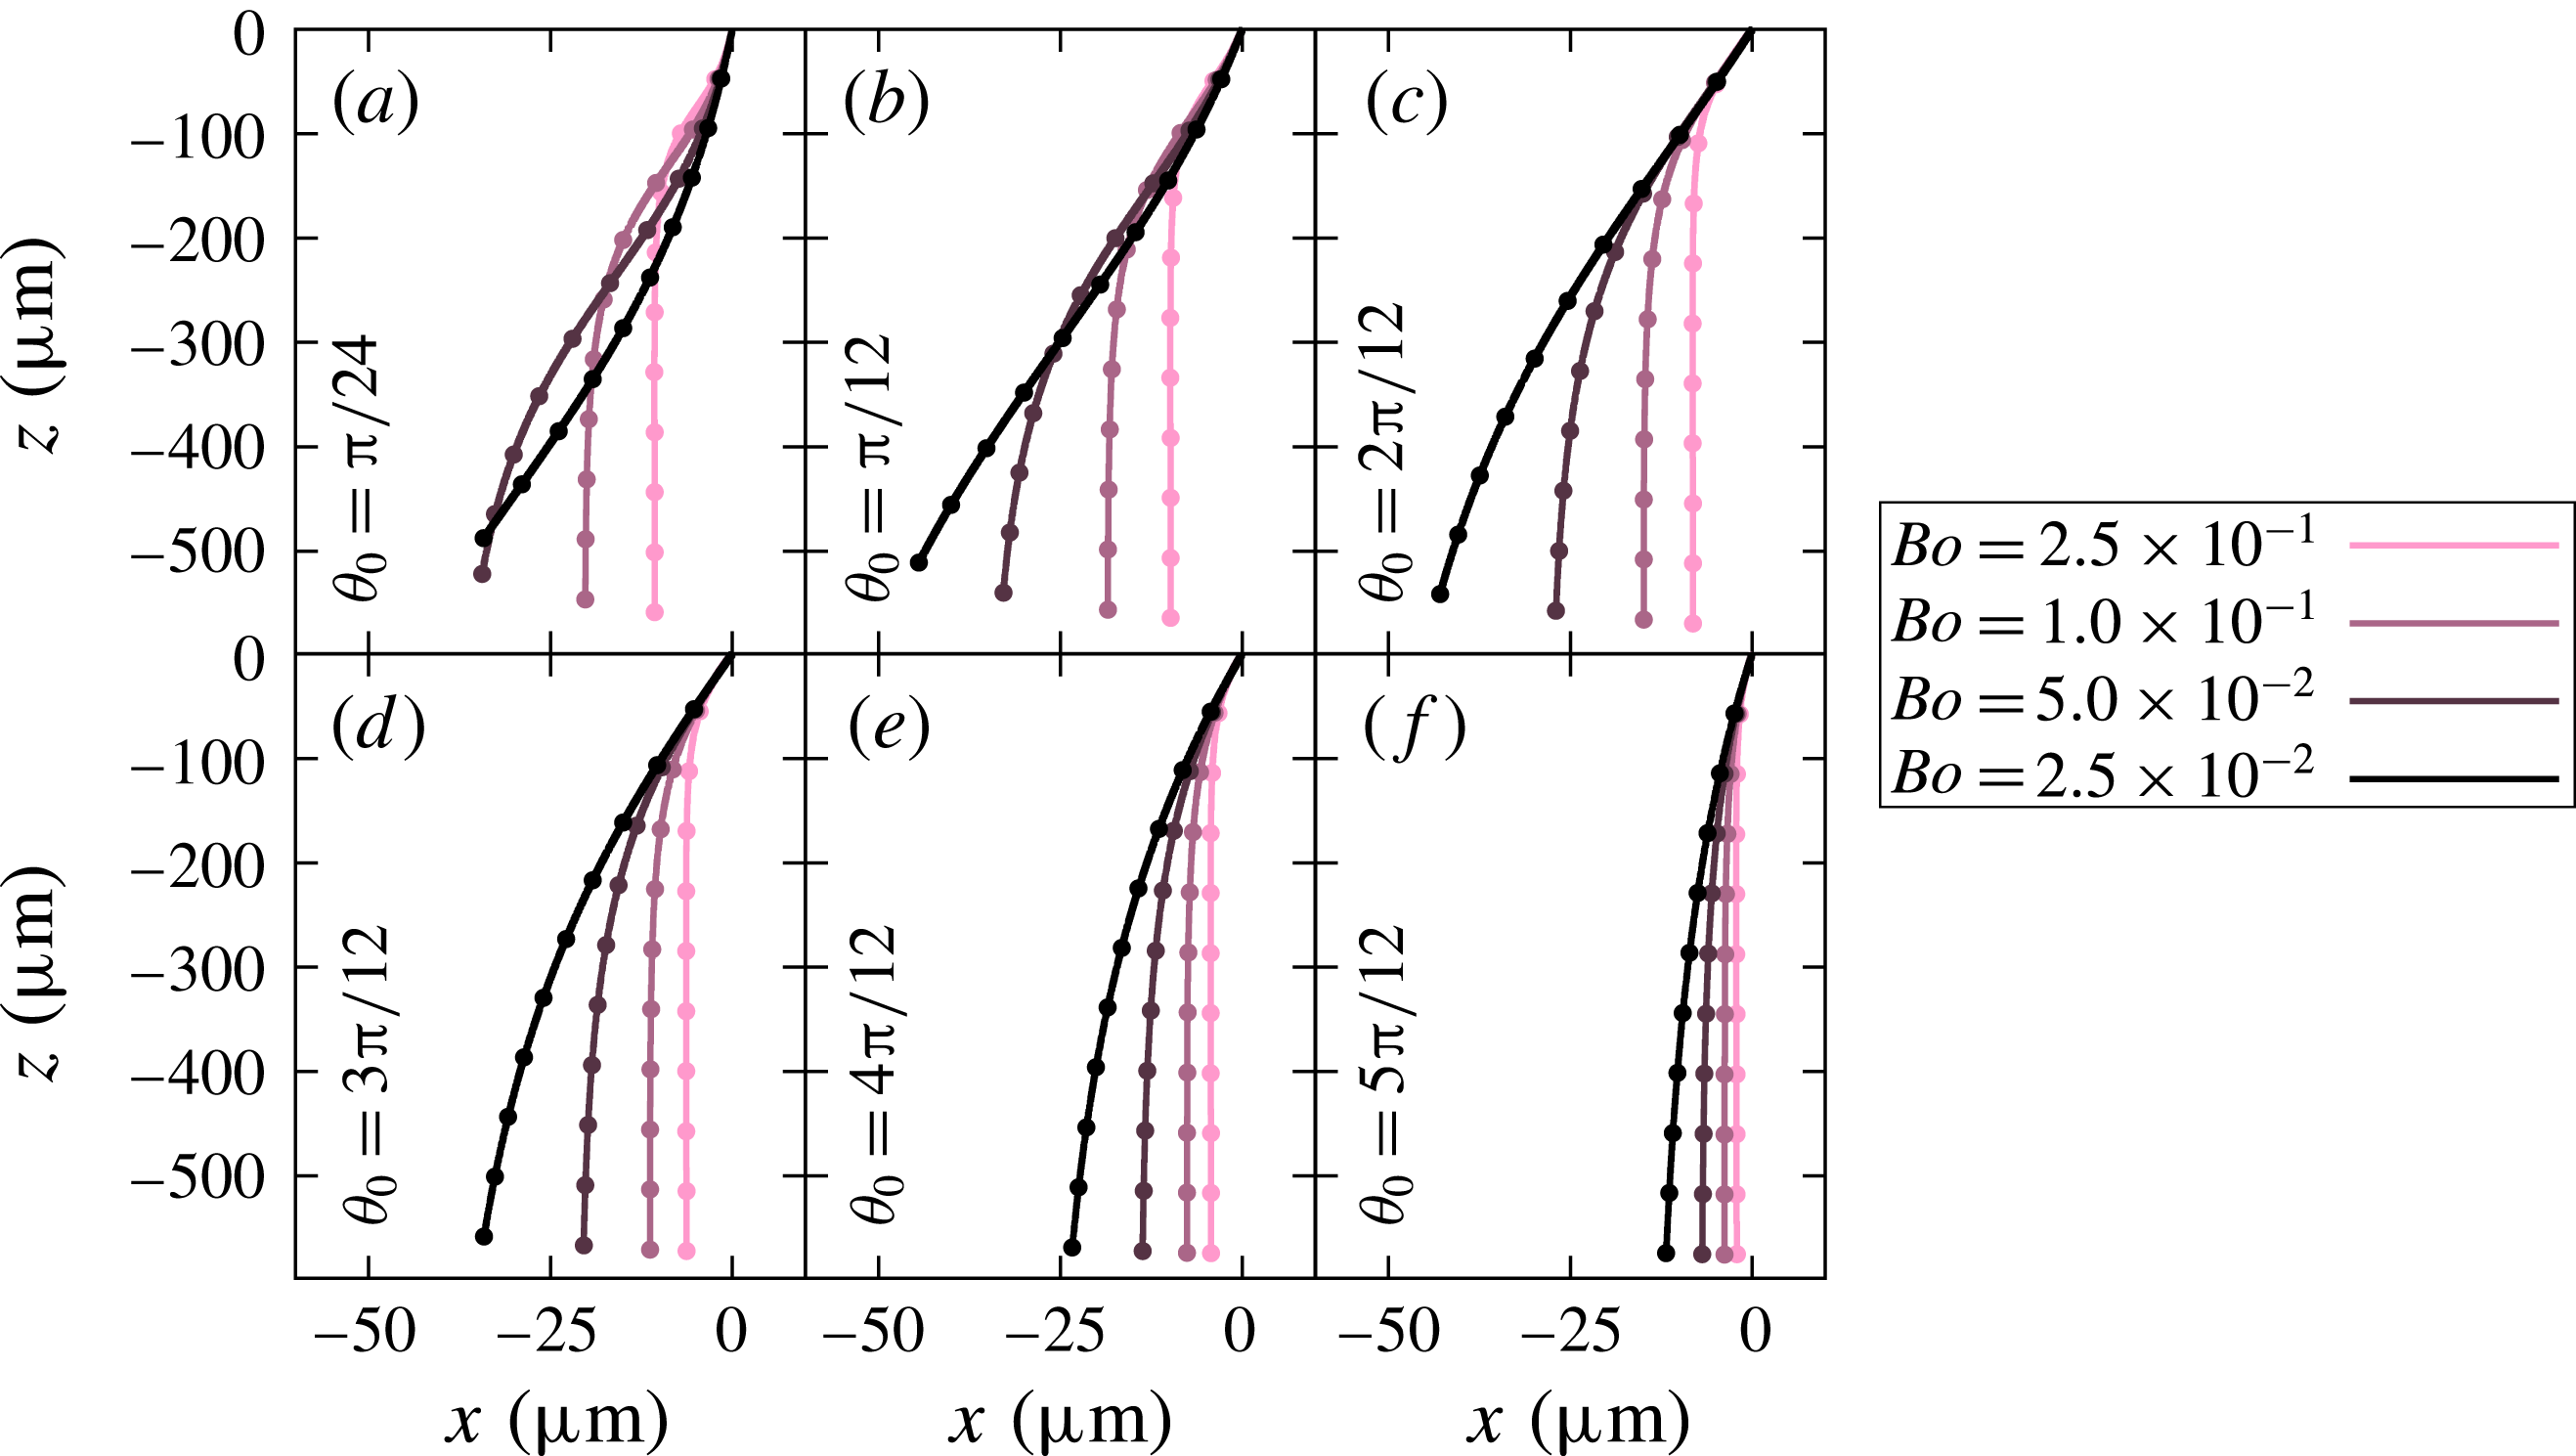
Trajectories of settling red blood cells with the same viscosity ratio
 $\unicode[STIX]{x1D706}=1$
, but different Bond numbers. Note that the initial position of the cells are
 $(x,z)=(0,0)$
. The initial angle
 $\unicode[STIX]{x1D703}_{0}$
is set to different values in (a–f). Dots on the lines show the values for every
 $(a\unicode[STIX]{x0394}\unicode[STIX]{x1D70C}g)t/\unicode[STIX]{x1D707}=100$
.

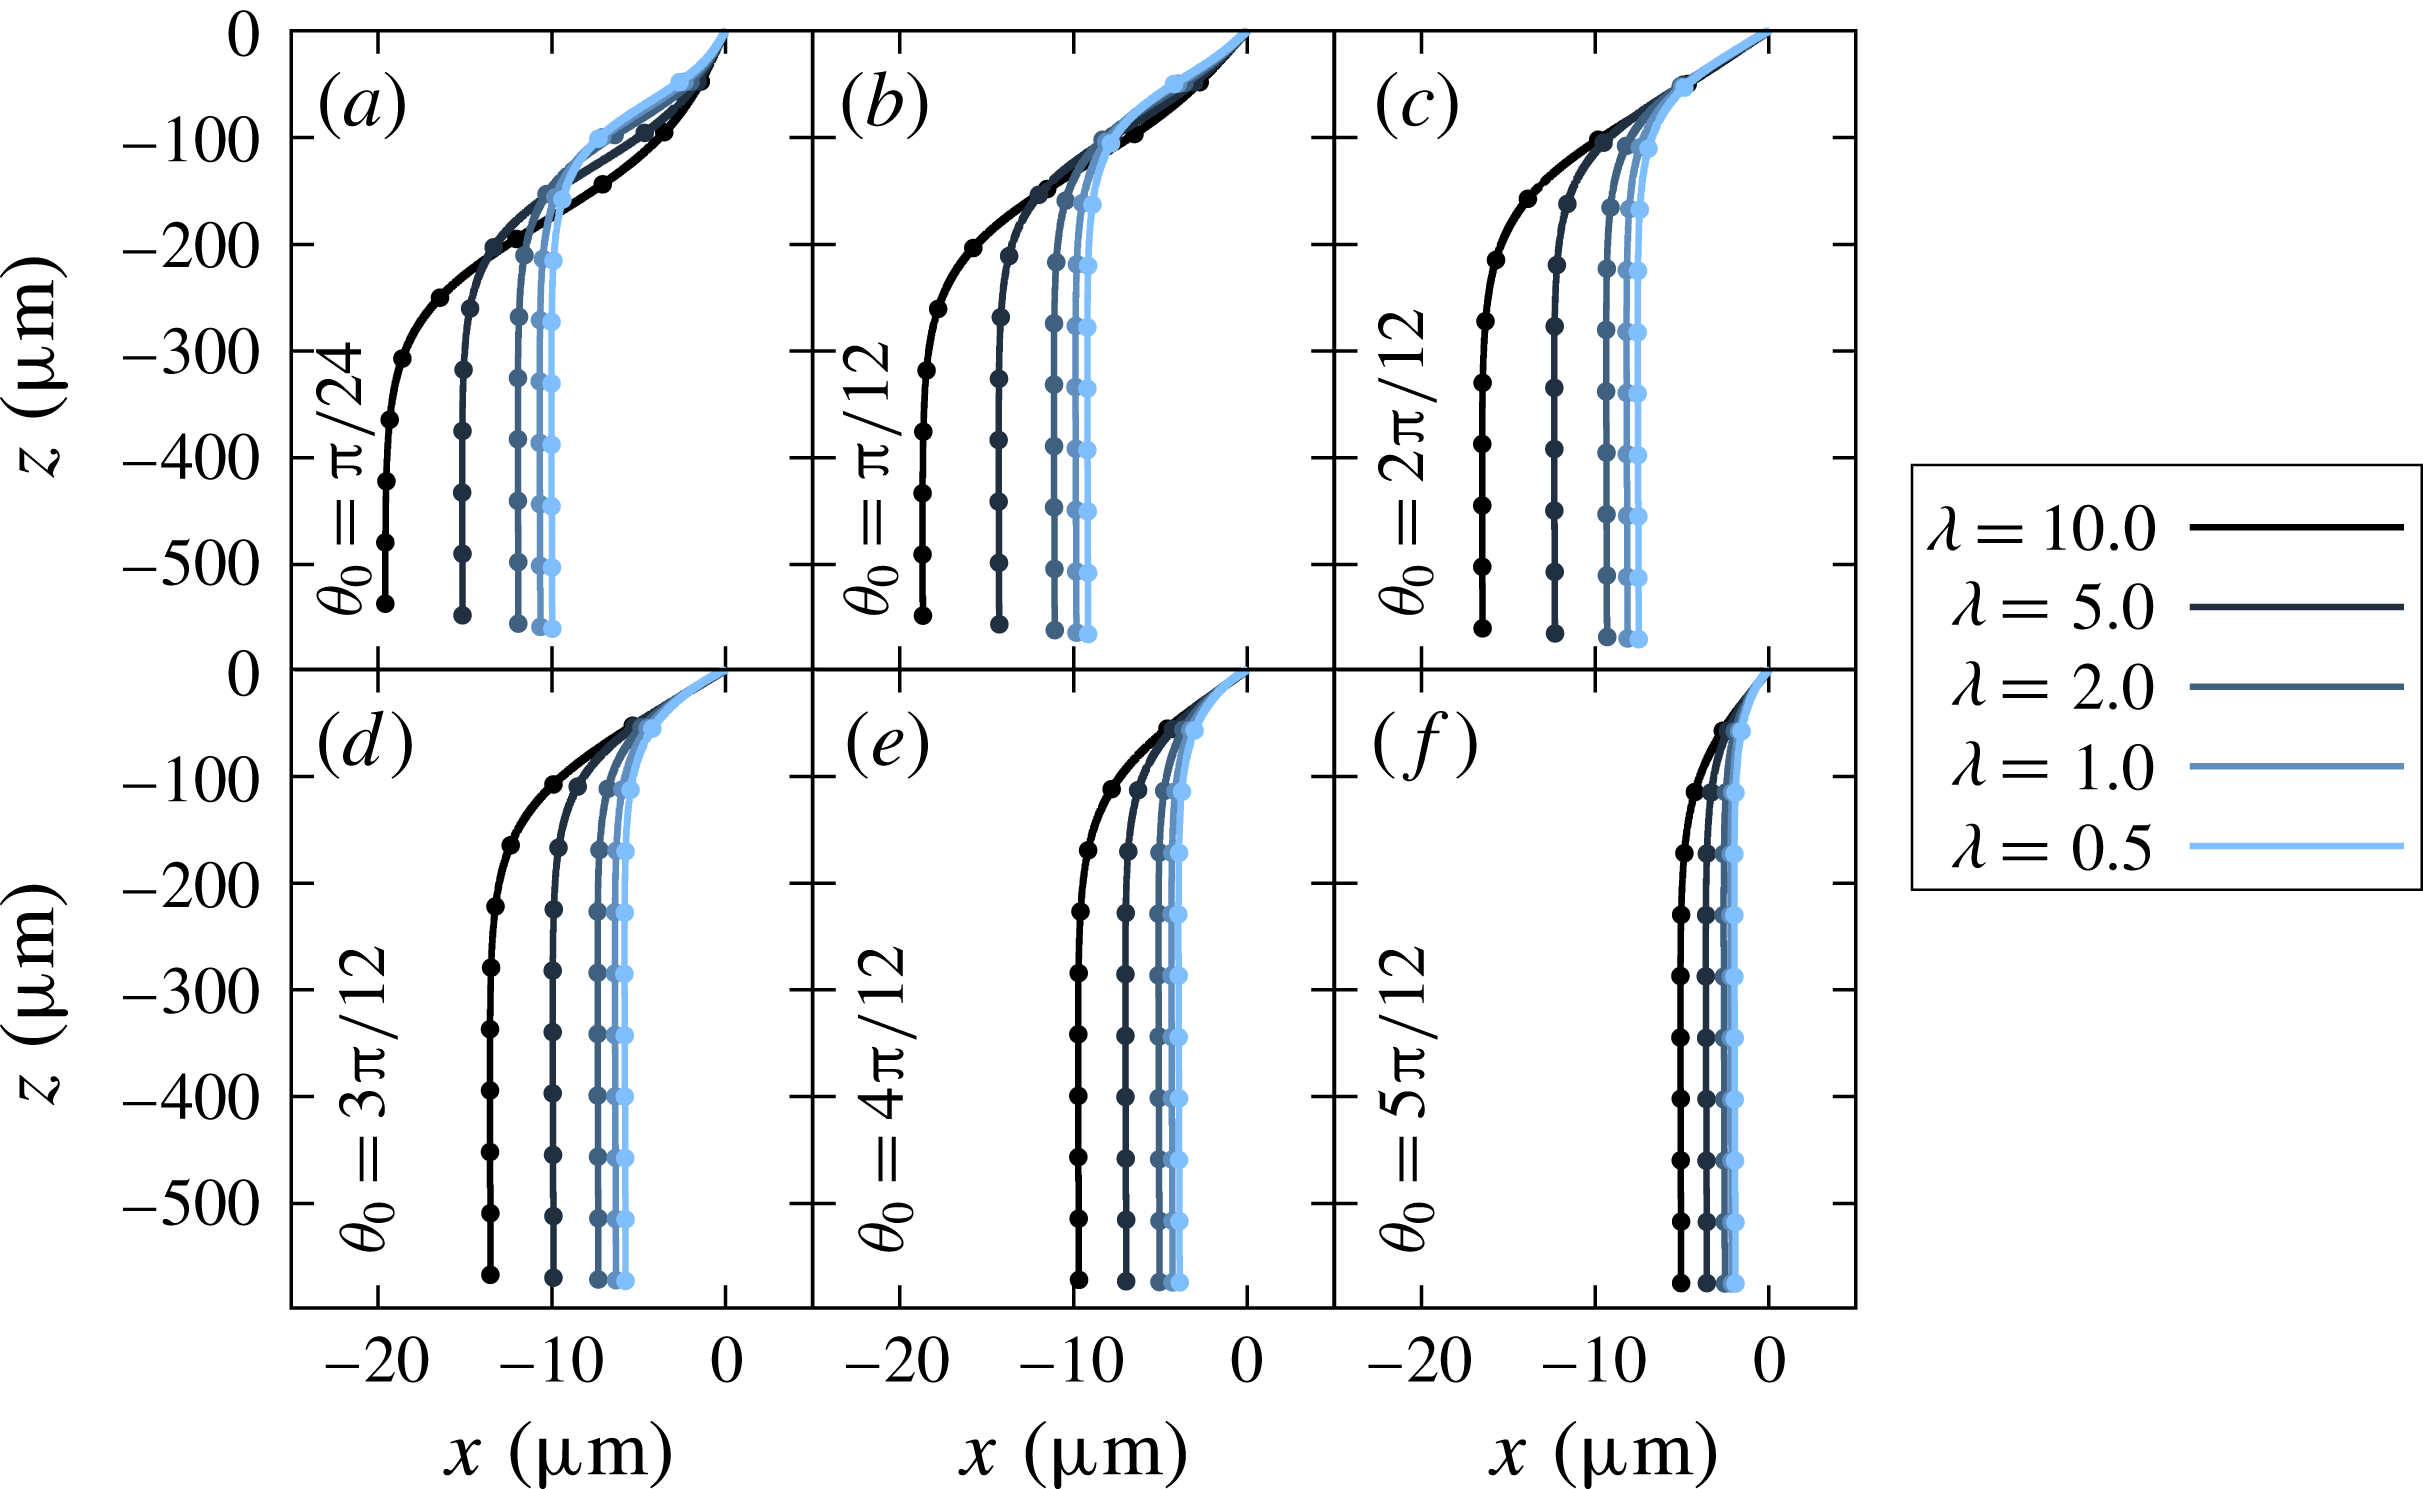
Trajectories of settling red blood cells with same Bond number
 $Bo=2.5\times 10^{-1}$
, but different viscosity ratios. The initial angle
 $\unicode[STIX]{x1D703}_{0}$
is set to different angle in (a–f). Dots on the lines show the values for every
 $(a\unicode[STIX]{x0394}\unicode[STIX]{x1D70C}g)t/\unicode[STIX]{x1D707}=100$
.

Long-term trajectories up to a non-dimensional time of
 $(a\unicode[STIX]{x0394}\unicode[STIX]{x1D70C}g)t/\unicode[STIX]{x1D707}=1000$
are shown in figures 6 and 7. As reported in figure 5, the red blood cell reorients faster for higher
 $Bo$
or lower
 $\unicode[STIX]{x1D706}$
. As a consequence, such a cell drifts for a shorter distance. Since lower initial angles would also contribute to a longer reorientation time, sedimentation starting from higher initial angles
 $\unicode[STIX]{x1D703}_{0}$
also results in shorter drifting distance. In both figures 6 and 7, the trajectories cross each other when the initial angle is low
 $\unicode[STIX]{x1D703}_{0}<\unicode[STIX]{x03C0}/4$
, while the cross-over cannot be seen for higher cases. The difference arises because the drifting velocity is fastest when the cell orientation is
 $\unicode[STIX]{x1D703}\approx \unicode[STIX]{x03C0}/4$
, as shown in later § 4.3. When the initial orientation angle is larger than
 $\unicode[STIX]{x03C0}/4$
, faster reorienting cells travel less distance horizontally because the drifting velocity monotonically decreases with the reorientation. For low initial orientation angles (
 $\unicode[STIX]{x1D703}_{0}<\unicode[STIX]{x03C0}/4$
), on the other hand, slower reorienting cells travel less distance horizontally at the beginning because the drifting velocity is slower for lower orientation angle at
 $\unicode[STIX]{x1D703}<\unicode[STIX]{x03C0}/4$
. Although Canham et al. (Reference Canham, Jay and Tilsworth1971) reported that the drifting velocity is very small, our result shows a possibility that the net drifting distance would reach long distances for small Bond numbers.
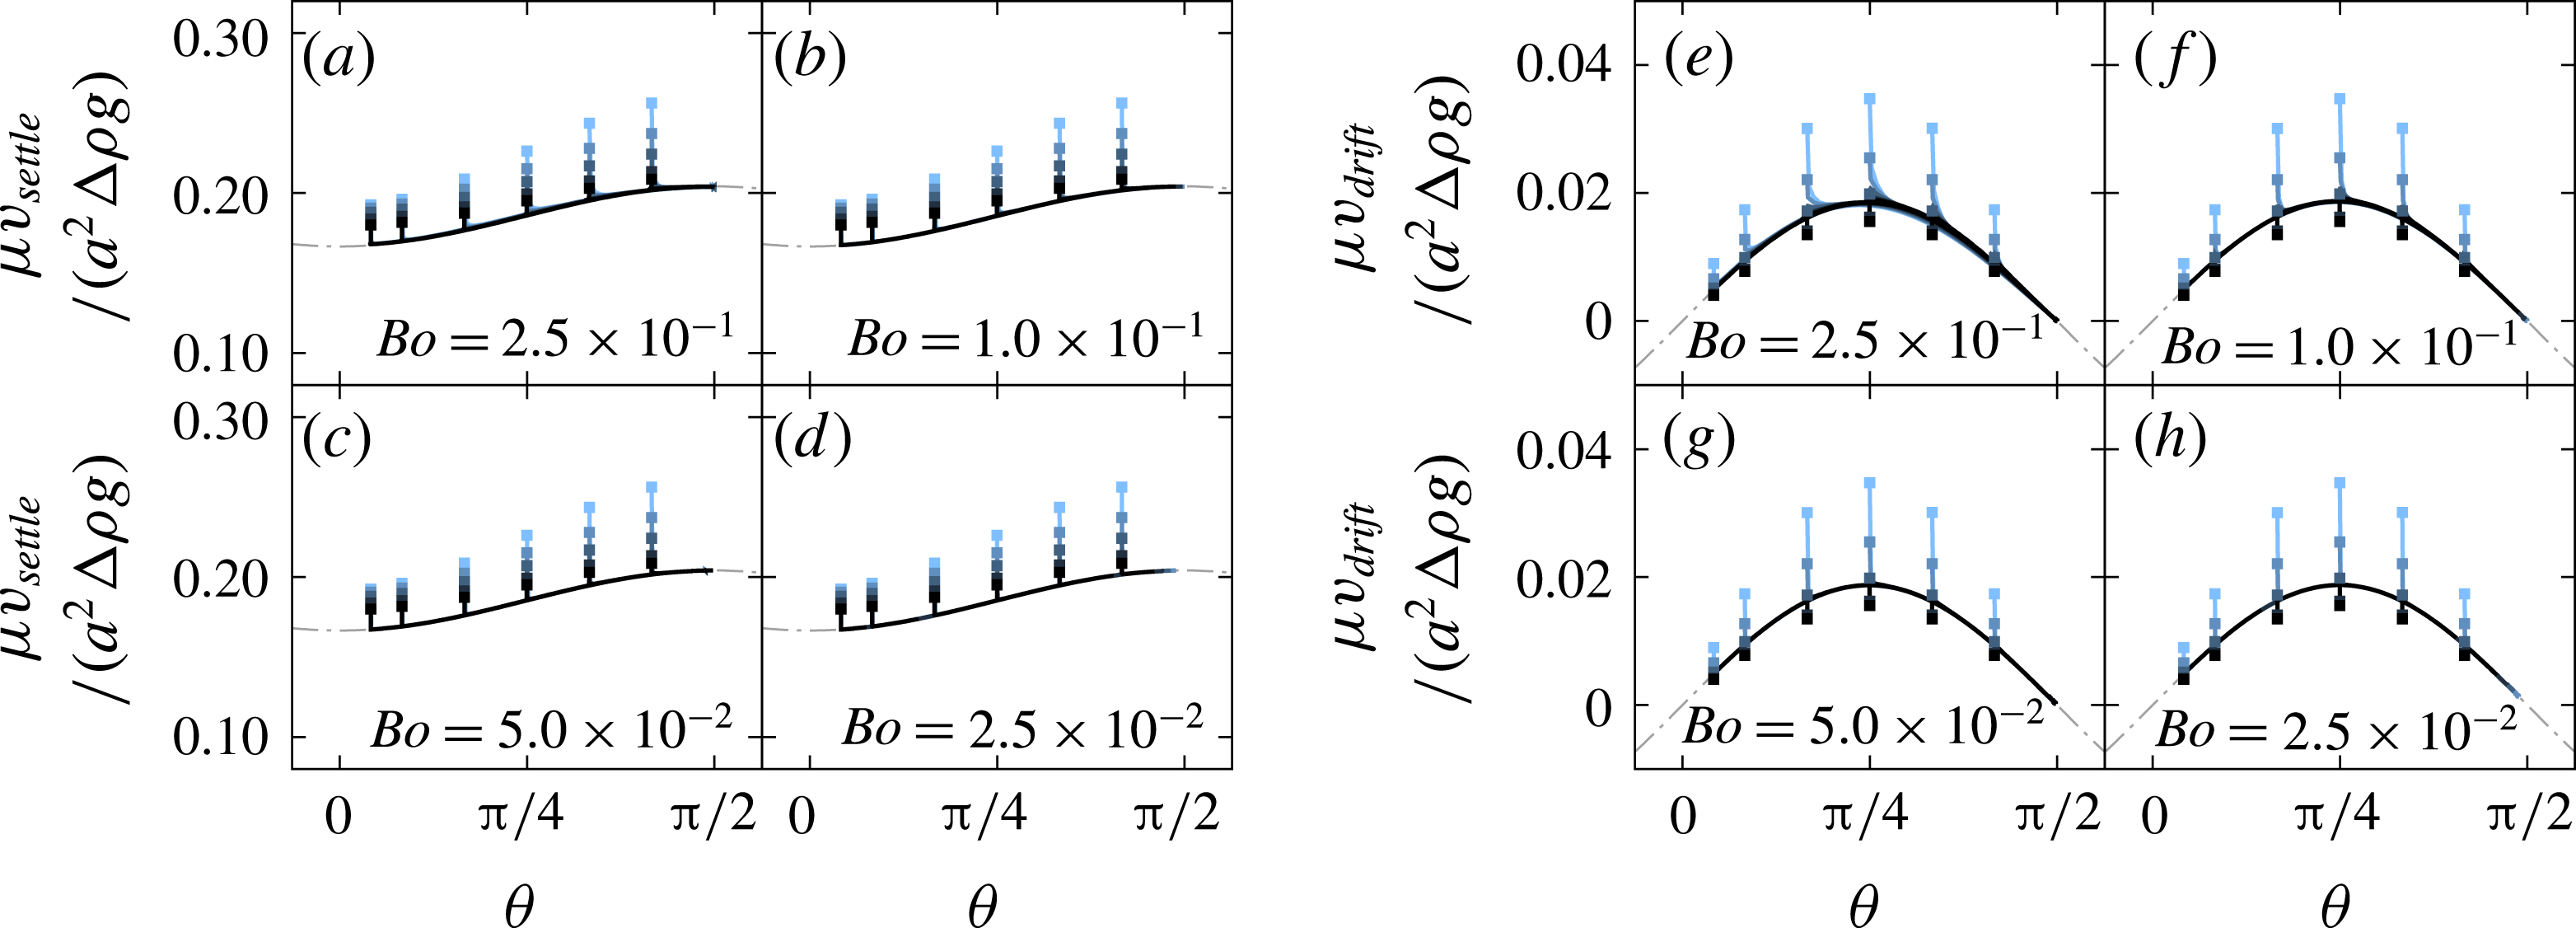
The settling velocity
 $v_{settle}$
and the drifting velocity
 $v_{drift}$
of red blood cells as a function of the instantaneous orientation angle
 $\unicode[STIX]{x1D703}$
. Filled squared plots show the initial states. Grey dotted lines show the velocities when
 $Bo=2.5\times 10^{-3}$
, which is shown in § 4.1.

4.3 Settling/drifting velocity and angular velocity
Figure 8 shows the settling velocity
 $v_{settle}$
and the drifting velocity
 $v_{drift}$
as a function of the instantaneous orientation angle
 $\unicode[STIX]{x1D703}$
. Note that the velocities are normalised by the gravitational driving force. The instantaneous orientation angle
 $\unicode[STIX]{x1D703}$
is given by the angle between the
 $x$
-axis and the vector from the material point
 $n_{A}$
to
 $n_{B}$
, as shown in figure 1(a). Both velocities
 $\unicode[STIX]{x1D707}v_{settle}/(a^{2}\unicode[STIX]{x0394}\unicode[STIX]{x1D70C}g)$
and
 $\unicode[STIX]{x1D707}v_{drift}/(a^{2}\unicode[STIX]{x0394}\unicode[STIX]{x1D70C}g)$
have a weak dependence on the Bond number, and this trend is in good agreement with previous studies (Huang, Abkarian & Viallat Reference Huang, Abkarian and Viallat2011; Peltomaki & Gompper Reference Peltomaki and Gompper2013; Boltz & Kierfeld Reference Boltz and Kierfeld2015). In addition to this result, we also find that the viscosity ratio also has a weak effect on both velocities. In other words, the non-dimensional velocities of the cells can be estimated by using only the instantaneous orientation angle
 $\unicode[STIX]{x1D703}$
, when excluding the transient phase. The velocities did not change drastically because the deformed shape during the sedimentation is not far from the initial shape, for the Bond numbers considered in this paper. Curves of the velocities might change when the cells deform by a large amount under an extremely high Bond number.
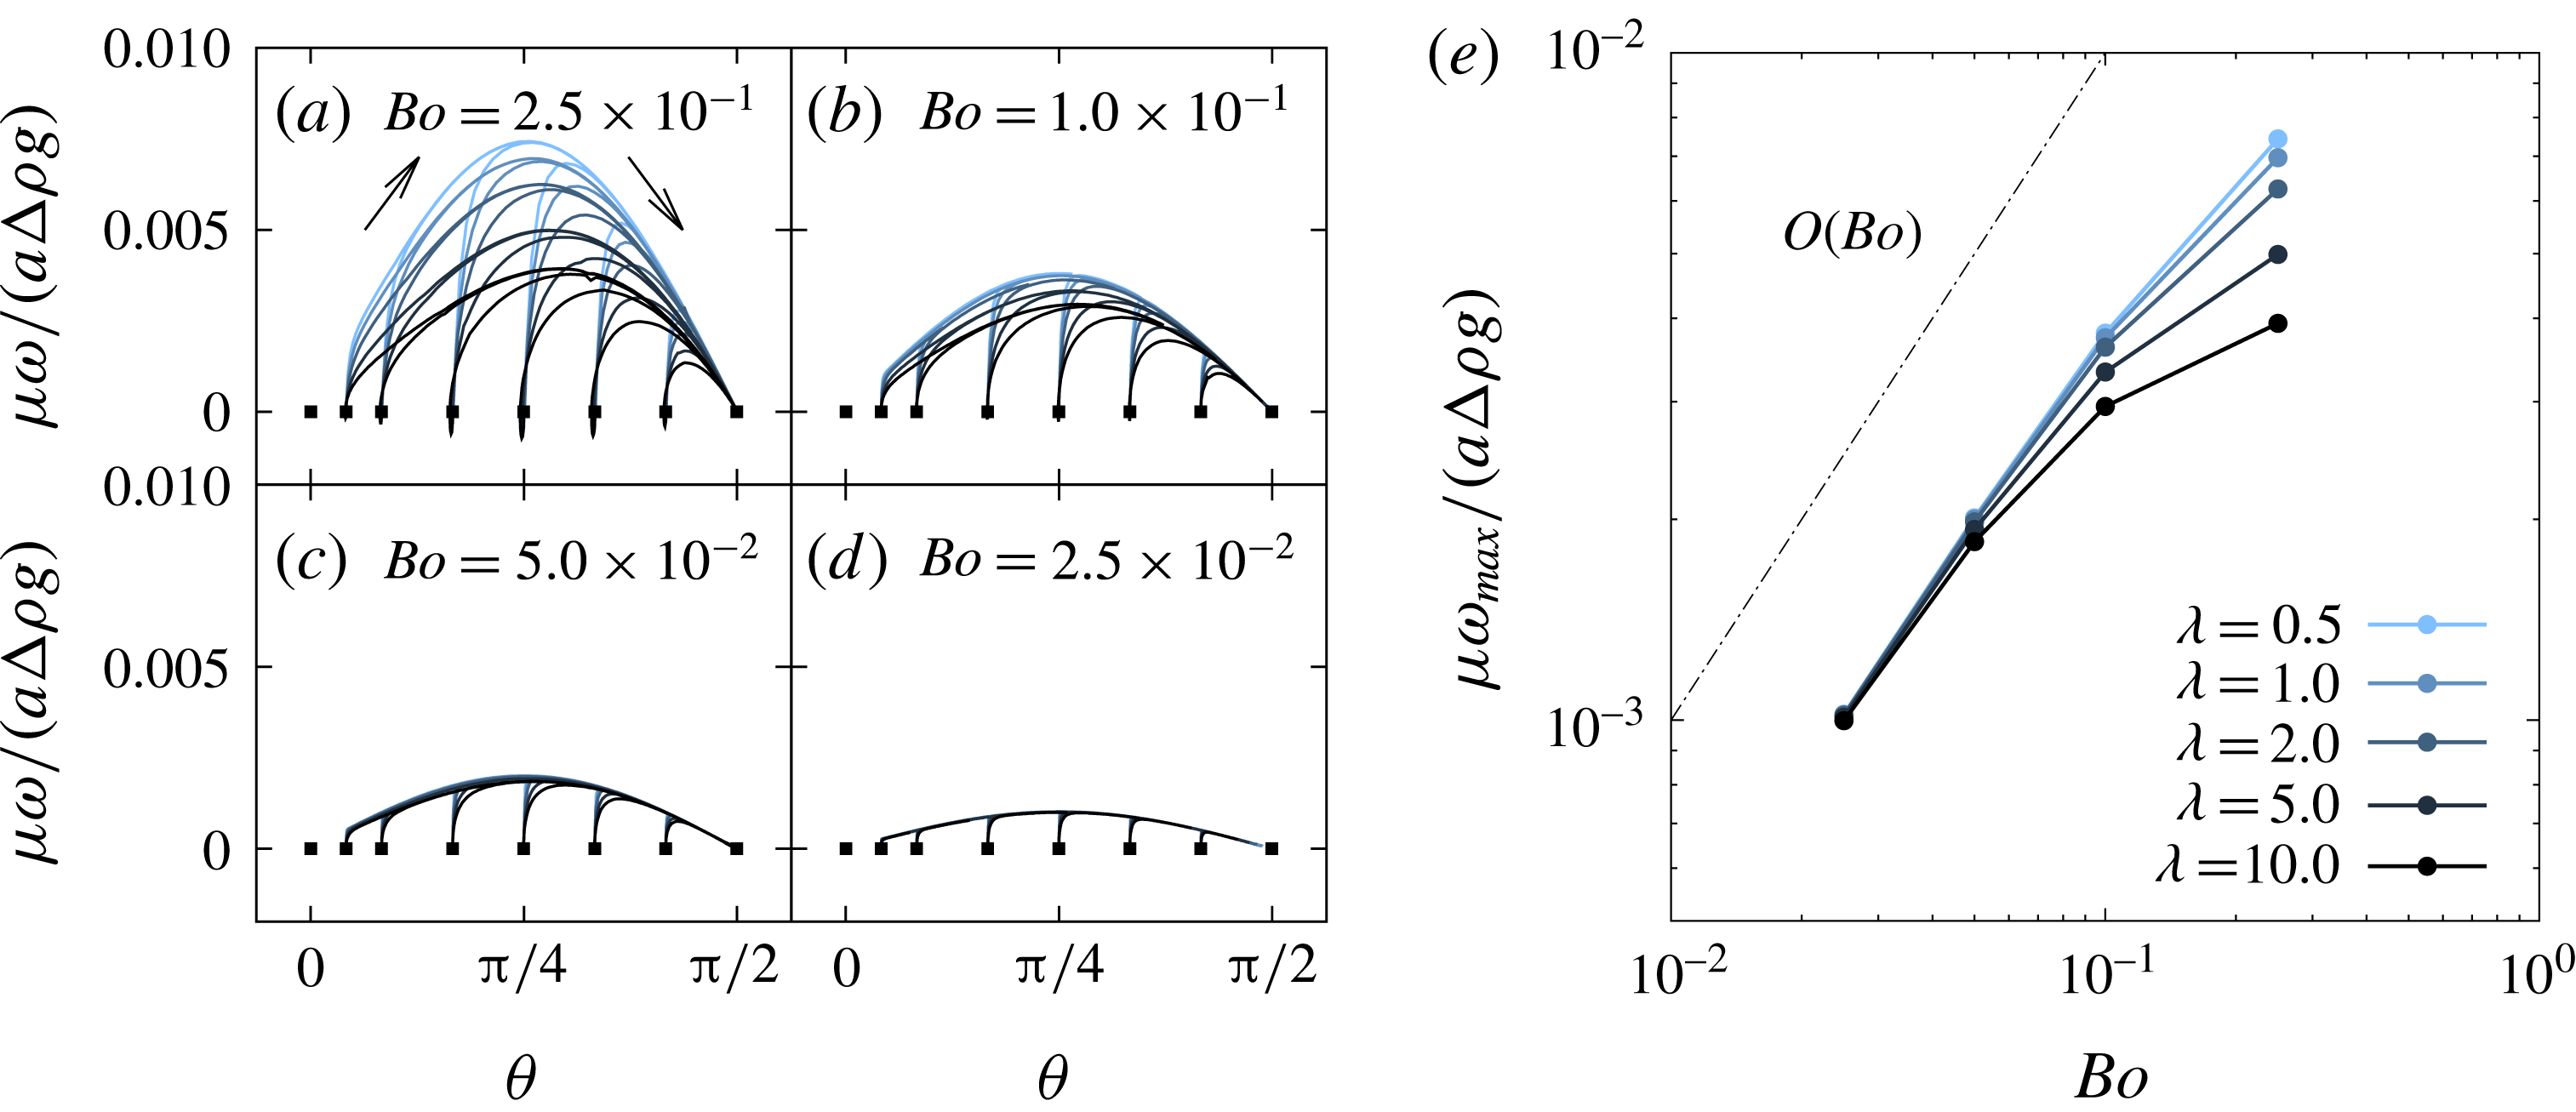
Left-hand side figures (a–d) shows the non-dimensional angular velocity
 $\unicode[STIX]{x1D707}\unicode[STIX]{x1D714}/(a\unicode[STIX]{x0394}\unicode[STIX]{x1D70C}g)$
as a function of the instantaneous orientation angle
 $\unicode[STIX]{x1D703}$
. Filled squared plots show the initial states. Figure (e) shows the maximum angular velocity which is extracted from figures (a–d).

Since the settling and drifting velocities are weak functions of the viscosity ratio and the Bond number, the reorientation time might control the overall trajectories of the red blood cells. The speed of the reorientation is quantified using the following equation:
 $$\begin{eqnarray}\unicode[STIX]{x1D714}=\frac{\text{d}\unicode[STIX]{x1D703}}{\text{d}t}=-\frac{1}{A}\int _{A}\frac{\boldsymbol{r}^{xz}\times (\boldsymbol{v}^{xz}-\boldsymbol{v}_{v}^{xz})}{|\boldsymbol{r}^{xz}|^{2}}\,\text{d}A,\end{eqnarray}$$
where
 $A$
is the surface area of the cell, the superscript
 $xz$
indicates that a vector is projected to (
 $x,z$
)-plane,
 $\boldsymbol{r}$
is the relative position from the volume centroid and
 $\boldsymbol{v}_{v}$
is the volume-averaged velocity.
Figure 9 shows the time history of the relation between the instantaneous orientation angle and the non-dimensional angular velocity. Even with different initial orientation angles, the angular velocities converge to the same line. The angular velocity can be described by a function of the instantaneous orientation angle, similar to the settling and drifting velocities. The figure shows that the angular velocity reaches a maximum near the angle
 $\unicode[STIX]{x03C0}/4$
with a
 $\sin 2\unicode[STIX]{x1D703}$
-like curve. Figure 9(e) shows the maximum angular velocity
 $\unicode[STIX]{x1D714}_{max}$
of each condition, which is extracted from figures (a–d), and it shows that the maximum angular velocity increases linearly with the Bond number. Although a higher viscosity ratio decreases the angular velocity, the viscosity ratio has a weak effect when the Bond number is in the range
 $Bo\leqslant 5.0\times 10^{-2}$
.
4.4 Mechanism of the reorientation
Because an object with a symmetric shape settles without any rotational velocity (Happel & Brenner Reference Happel and Brenner1963), the reorientation of a red blood cell should be caused by the asymmetric shape during the sedimentation process. The simplest modelling of the asymmetric body would be an asymmetric dumbbell, consisting of two different-sized spheres with a rigid rod that connects the spheres (Happel & Brenner Reference Happel and Brenner1963). It is known that this asymmetric dumbbell also reorients because of a discrepancy between two centres: the volume centroid and hydrodynamic centre. The angular velocity of the dumbbell can be described (Mogami, Ishii & Baba Reference Mogami, Ishii and Baba2001) as
 $$\begin{eqnarray}\unicode[STIX]{x1D714}=\frac{\text{d}\unicode[STIX]{x1D703}}{\text{d}t}=\frac{\unicode[STIX]{x0394}\unicode[STIX]{x1D70C}gd}{\unicode[STIX]{x1D707}}R\cos \unicode[STIX]{x1D703},\end{eqnarray}$$
where
 $R$
is a shape coefficient and
 $d$
is the distance between the volume centroid and the hydrodynamic centre. The purpose of this subsection is to confirm that the mechanism of the red blood cell reorientation can be still explained using this simple relation (4.8).
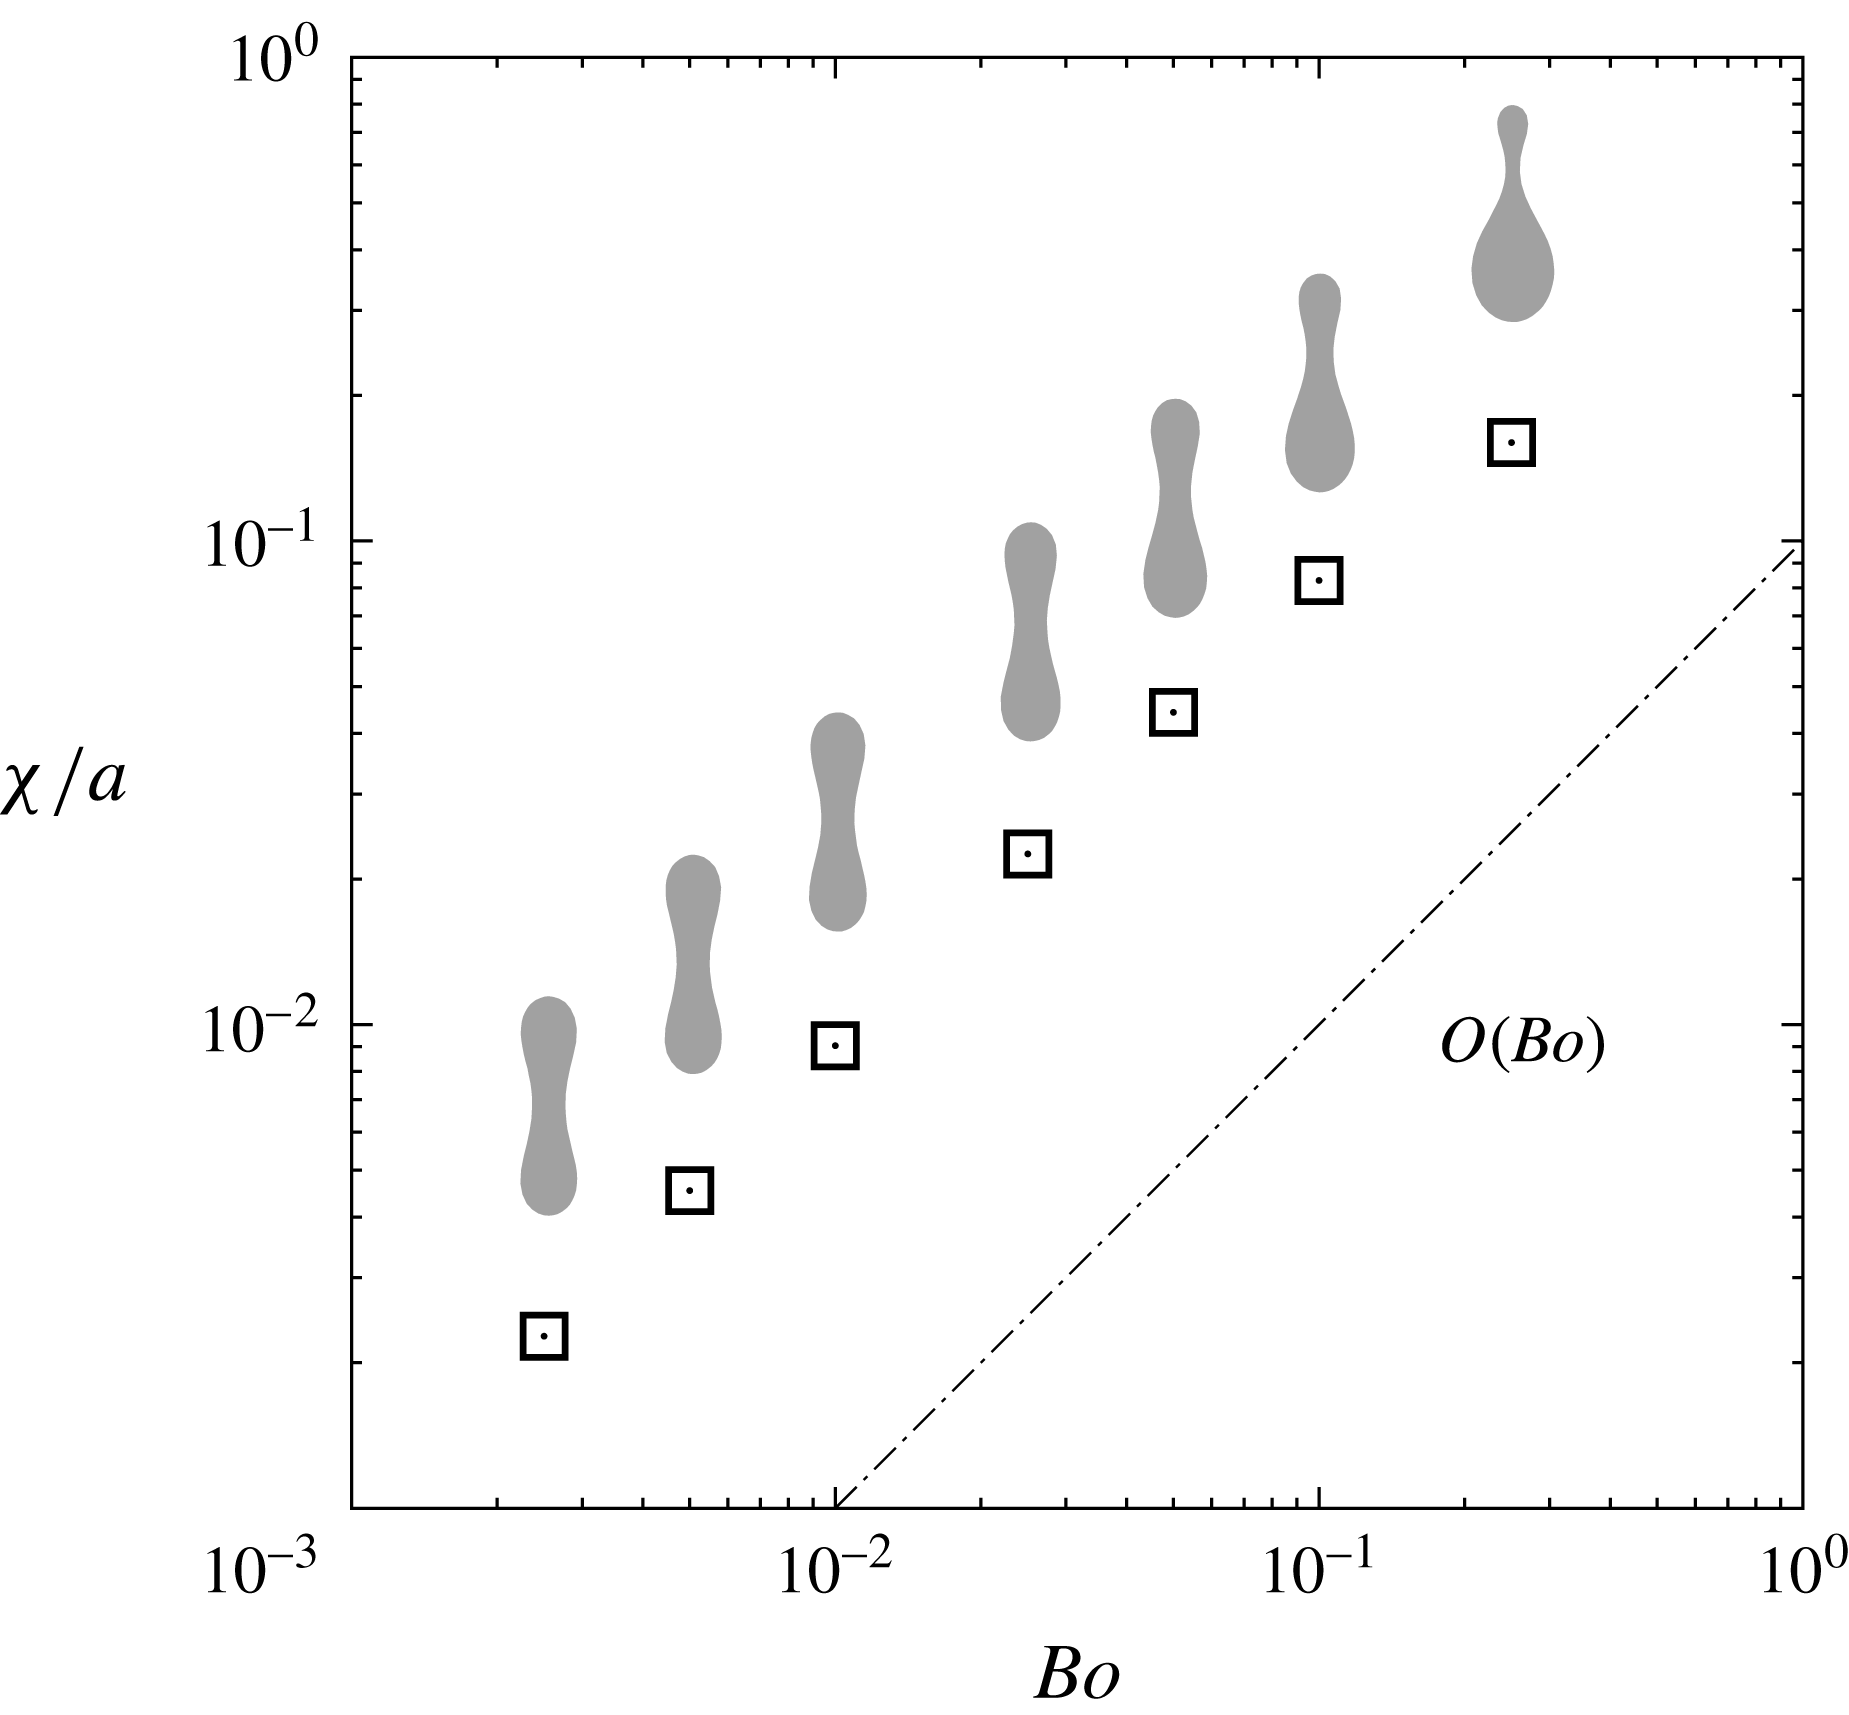
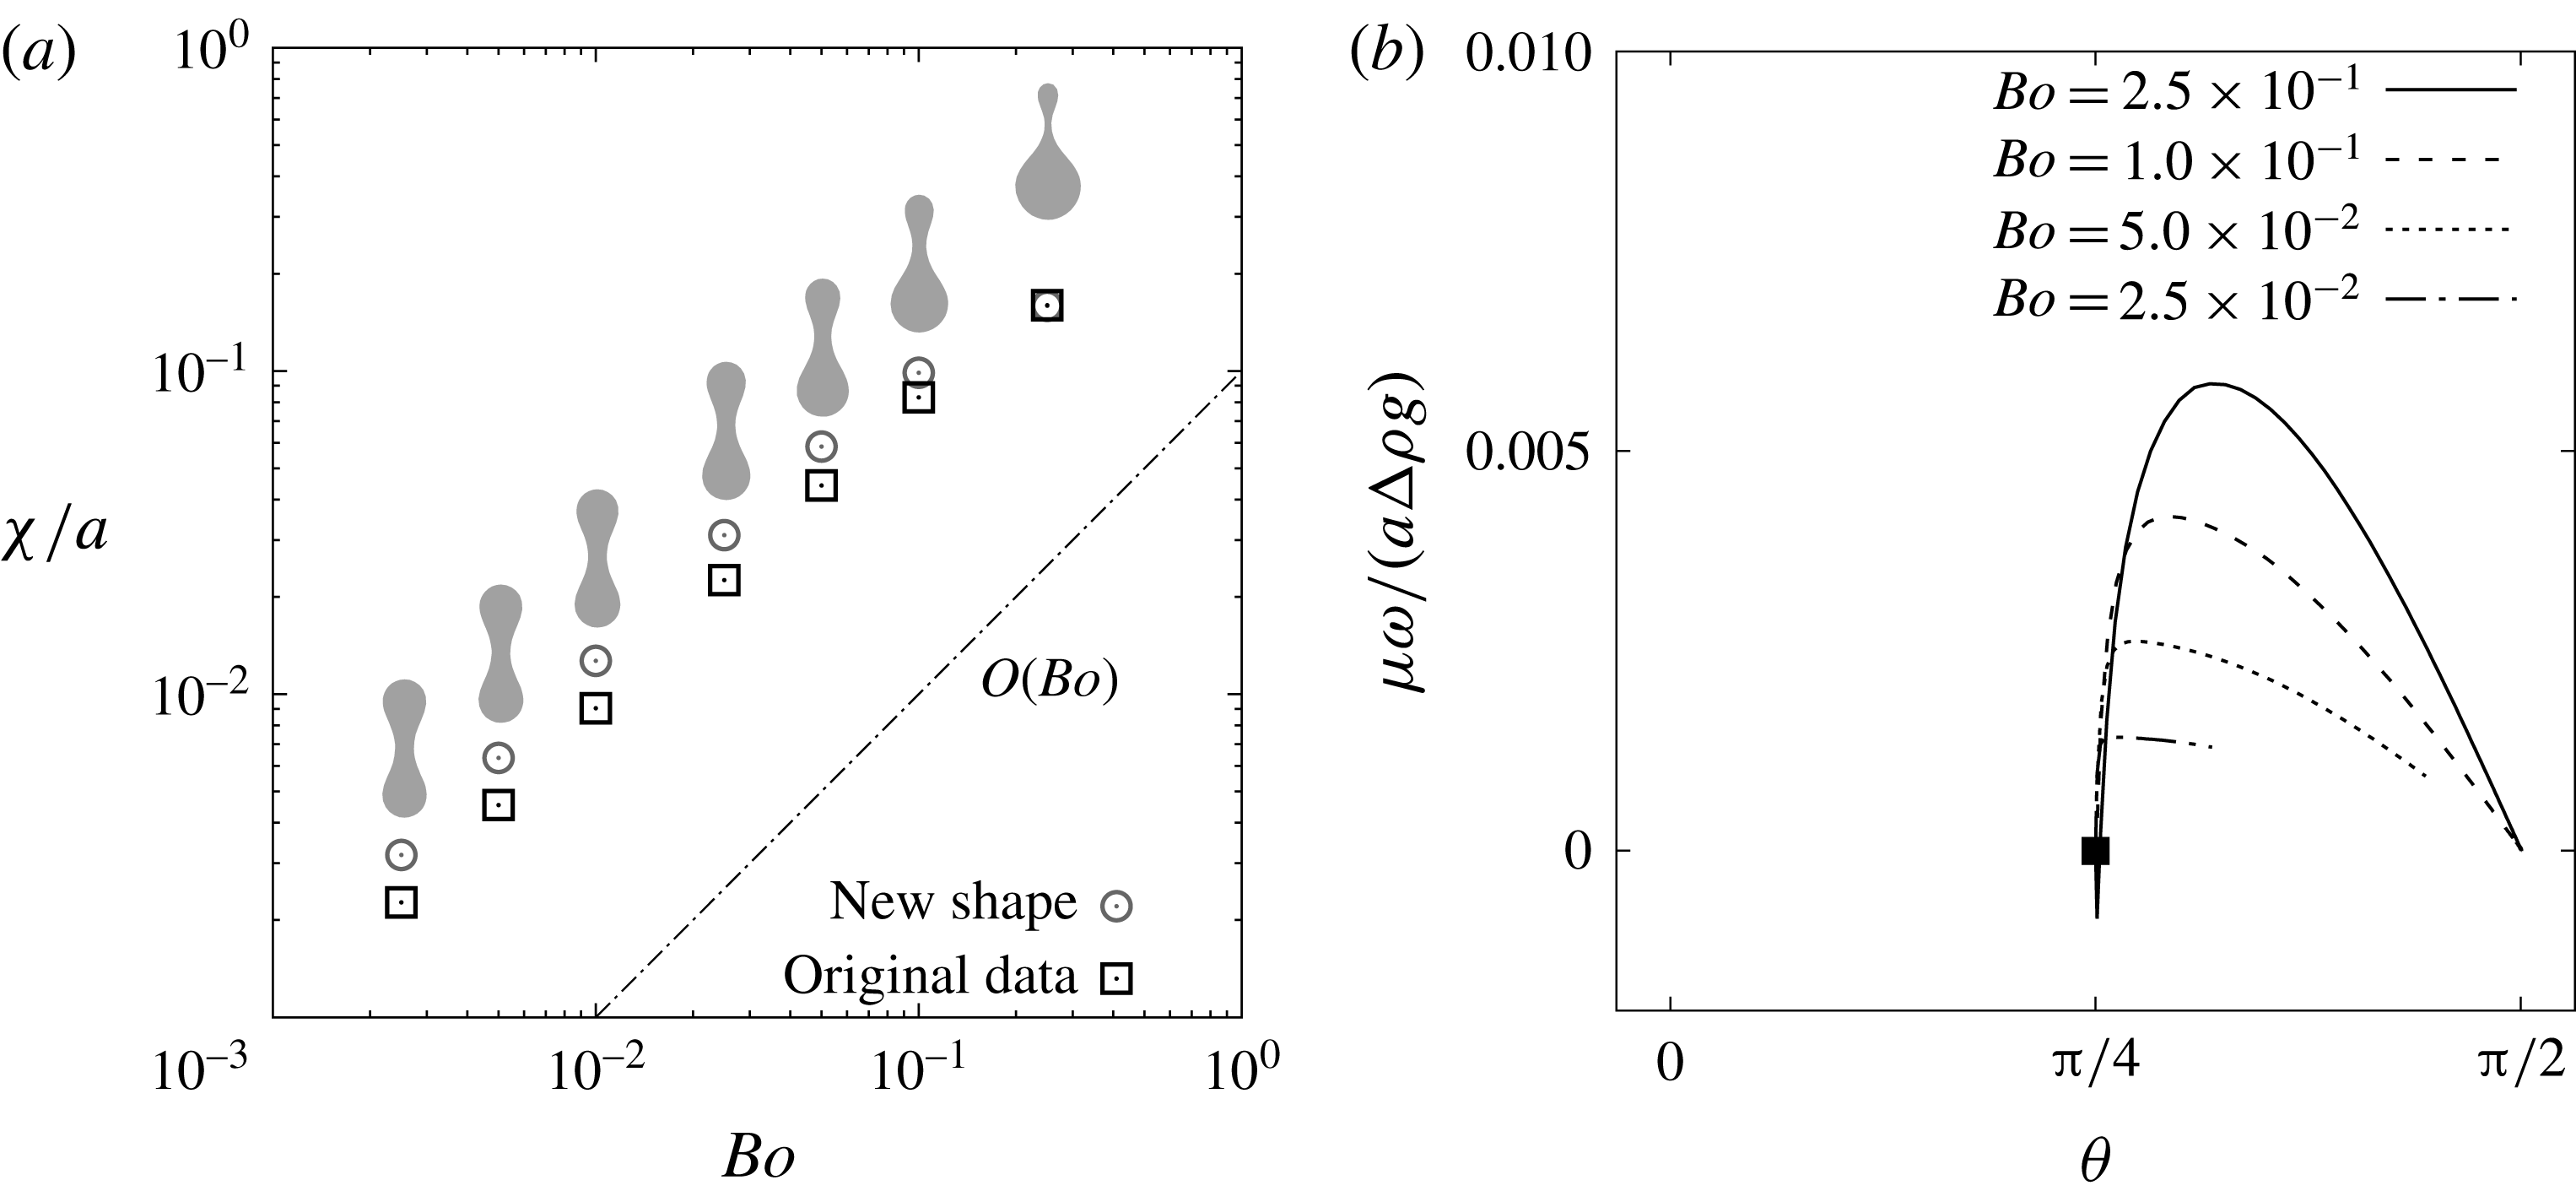
Norm of the asymmetry parameter
 $\unicode[STIX]{x1D712}/a$
as a function of the Bond number
 $Bo$
. Sedimentations with the initial angle
 $\unicode[STIX]{x1D703}_{0}=\unicode[STIX]{x03C0}/2$
are simulated, and the parameter
 $\unicode[STIX]{x1D712}/a$
is obtained after the cell shape reaches the steady state. Cross-sectional shapes of the red blood cell are also shown near the corresponding Bond number.

Because it is complicated to evaluate the time-dependent hydrodynamic centre of a deformable object, we introduce a shape asymmetry vector
 $\unicode[STIX]{x1D74C}$
(Nix et al.
Reference Nix, Imai, Matsunaga, Yamaguchi and Ishikawa2014) as an alternative way to describe the character of the shape.
 $\unicode[STIX]{x1D74C}$
is a vector from the volume centroid
 $\boldsymbol{x}_{v}$
to the areal centroid
 $\boldsymbol{x}_{A}$
, as
 $$\begin{eqnarray}\displaystyle \unicode[STIX]{x1D74C}=\boldsymbol{x}_{A}-\boldsymbol{x}_{V}=\frac{1}{A}\int _{A}\boldsymbol{x}\,\text{d}A-\frac{1}{V}\int _{V}\boldsymbol{x}\,\text{d}V=\frac{1}{A}\int \boldsymbol{r}\,\text{d}A, & & \displaystyle\end{eqnarray}$$
where
 $\boldsymbol{r}=\boldsymbol{x}-\boldsymbol{x}_{V}$
is the relative position from the volume centroid. We assume that the norm of the vector
 $\unicode[STIX]{x1D712}=|\unicode[STIX]{x1D74C}|$
can be used as a substitute for
 $d$
because there is a linear relation between the two values,
 $d$
and
 $\unicode[STIX]{x1D712}$
, as shown in appendix B. Figure 10 shows the norm
 $\unicode[STIX]{x1D712}/a$
at the steady state
 $\unicode[STIX]{x1D703}=\unicode[STIX]{x03C0}/2$
, and it shows that the value increases linearly with the Bond number. Note that
 $\unicode[STIX]{x1D712}$
does not depend on the viscosity ratio. As discussed in § 4.2, the difference in gravitational hydrostatic pressure (2.12) drives the cell to deform asymmetrically; as a result, the volume of the bottom half will become larger than the upper half. The parameter
 $\unicode[STIX]{x1D712}$
describes well that the volume centroid will move to lower part from the consequence of the asymmetry. Now, the equation (4.9) is rewritten by
 $$\begin{eqnarray}\unicode[STIX]{x1D74C}=\unicode[STIX]{x1D74C}-\unicode[STIX]{x1D74C}_{0}=\frac{1}{A}\int _{A}(\boldsymbol{r}-\boldsymbol{r}_{0})\,\text{d}A,\end{eqnarray}$$
where
 $\boldsymbol{r}_{0}$
is the relative position
 $\boldsymbol{r}$
at the initial biconcave shape, and
 $\unicode[STIX]{x1D74C}_{0}=0$
is the shape asymmetry vector at the initial state. At the small deformation limit, there is a linear relation between
 $Bo$
and
 $(\boldsymbol{r}-\boldsymbol{r}_{0})$
, which describes the deformation from the initial state. This might be the reason that
 $\unicode[STIX]{x1D712}/a$
has linear relation with the Bond number, when the Bond number is relatively small.
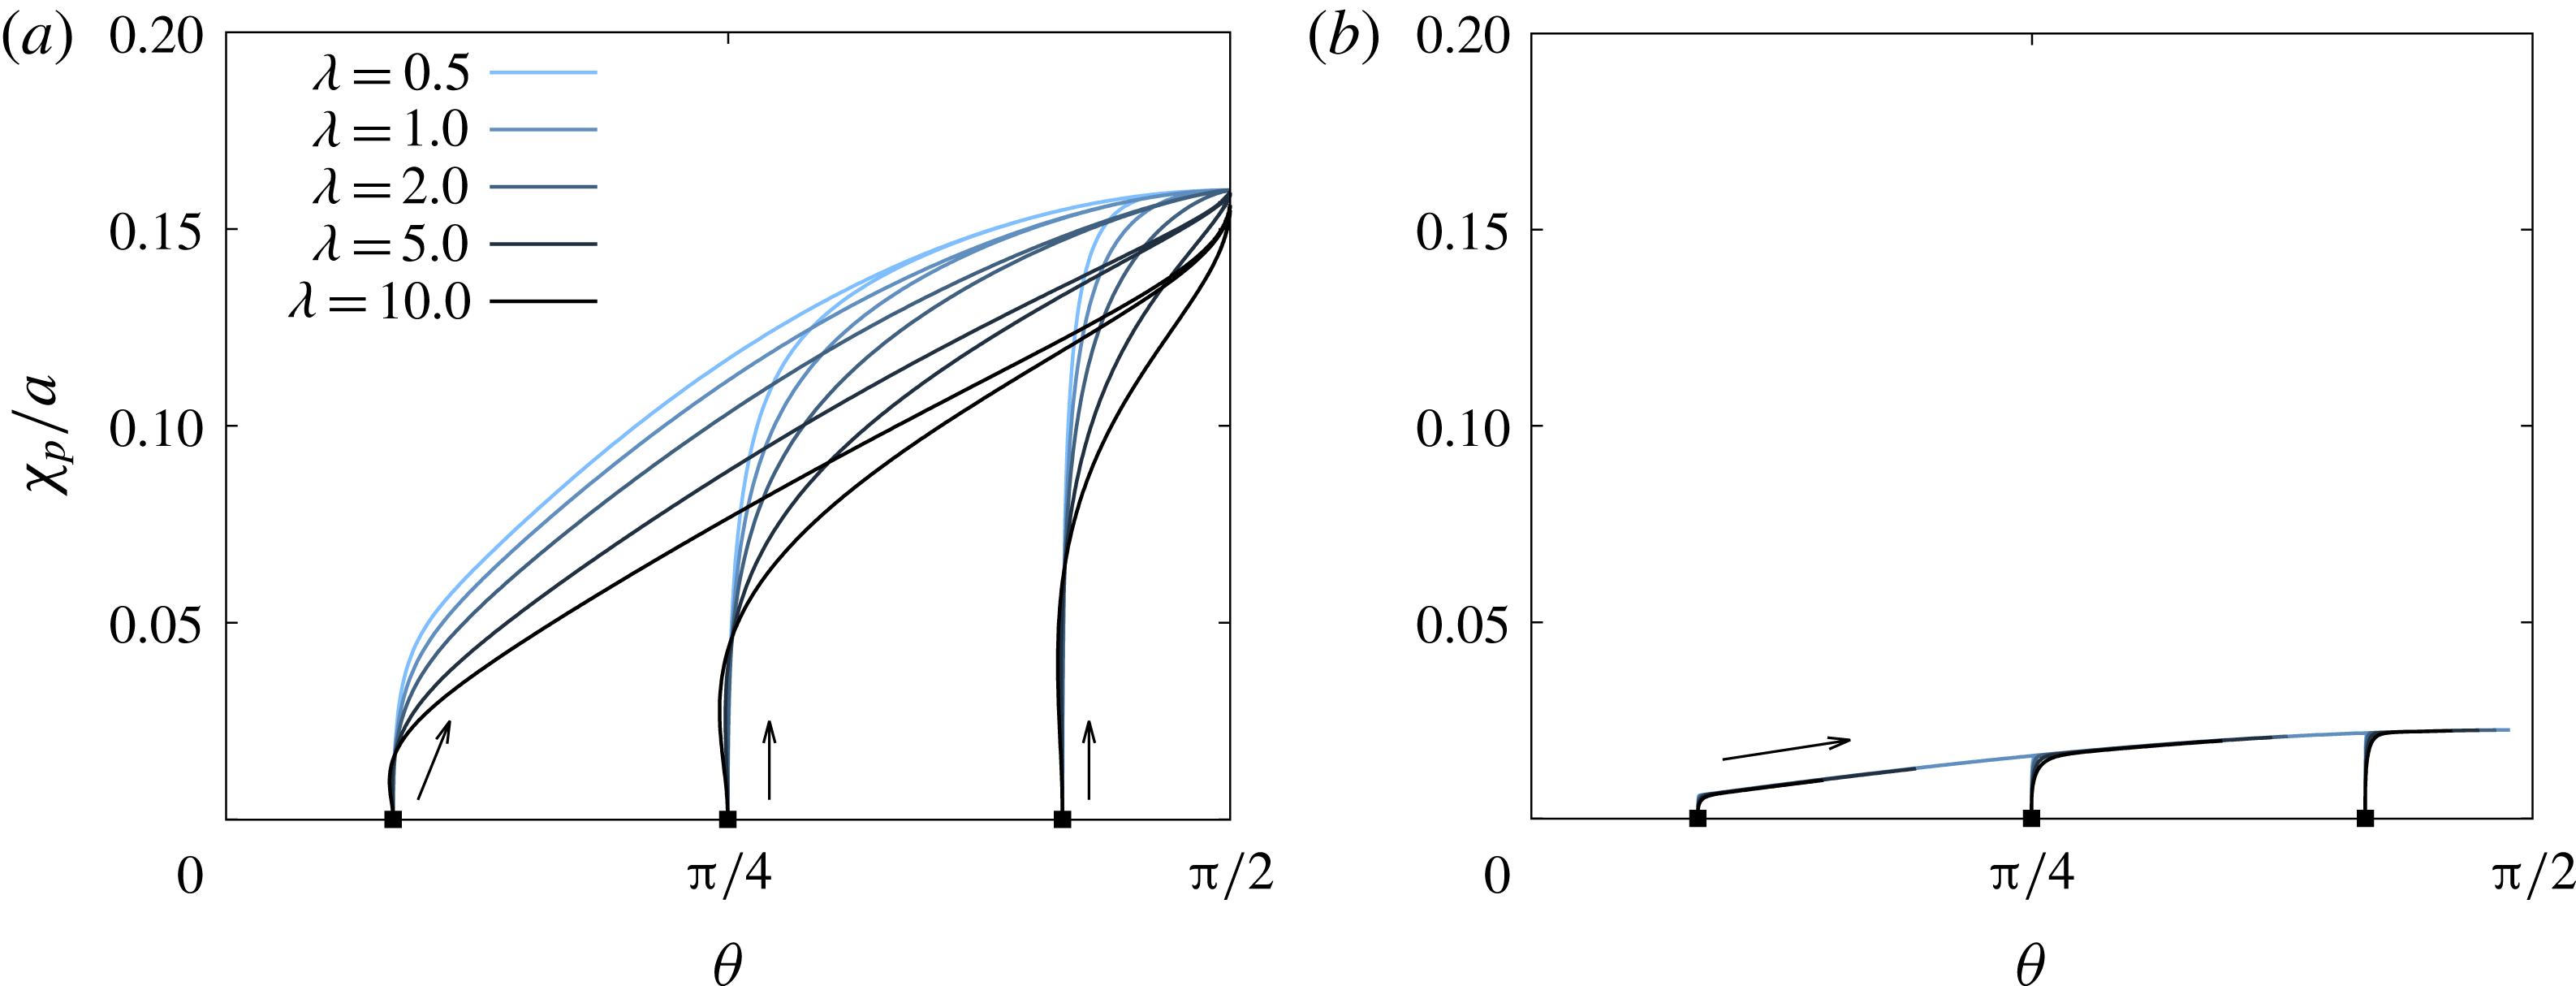
Change in the shape asymmetry
 $\unicode[STIX]{x1D712}_{p}/a$
as a function of instantaneous orientation angle
 $\unicode[STIX]{x1D703}$
, under the Bond number (a)
 $Bo=2.5\times 10^{-1}$
and (b)
 $2.5\times 10^{-2}$
. Filled squared plots show the initial states. Note that the shape asymmetry will converge to the same value, regardless of the viscosity ratio
 $\unicode[STIX]{x1D706}$
and the initial orientation angle
 $\unicode[STIX]{x1D703}_{0}$
.

Figure 11 shows how the shape asymmetry
 $\unicode[STIX]{x1D712}_{p}$
changes during the sedimentation process. Note that
 $\unicode[STIX]{x1D712}_{p}=\unicode[STIX]{x1D74C}\boldsymbol{\cdot }\boldsymbol{e}_{\unicode[STIX]{x1D703}}$
is the shape asymmetry in the direction of the main orientation, where
 $\boldsymbol{e}_{\unicode[STIX]{x1D703}}$
is a unit vector from material point
 $n_{A}$
to
 $n_{B}$
shown in figure 1(a). Cells increase in asymmetry
 $\unicode[STIX]{x1D712}_{p}$
with reorientation and show maximum values at
 $\unicode[STIX]{x1D703}=\unicode[STIX]{x03C0}/2$
. This is because the red blood cells feel larger difference of gravitational hydrostatic pressure for higher orientation angles, as discussed in § 4.2. The result also confirms that
 $\unicode[STIX]{x1D712}_{p}/a$
converge to the same value regardless of the viscosity ratio
 $\unicode[STIX]{x1D706}$
and the initial orientation angle
 $\unicode[STIX]{x1D703}_{0}$
.
In the cases of higher Bond numbers, as shown in figure 11 (a), a cell with a higher viscosity ratio shows slower convergence to the steady-state asymmetry because the inner fluid viscosity determines the deformation speed. This difference in the transient asymmetry would lead to the difference in the angular velocity, which is discussed in following paragraphs. For cells with lower Bond number, as shown in figure 11(b), on the other hand, the asymmetry has a weak dependence on the viscosity ratio because the deformation is small.
Since there is a linear relationship between
 $d$
and
 $\unicode[STIX]{x1D712}$
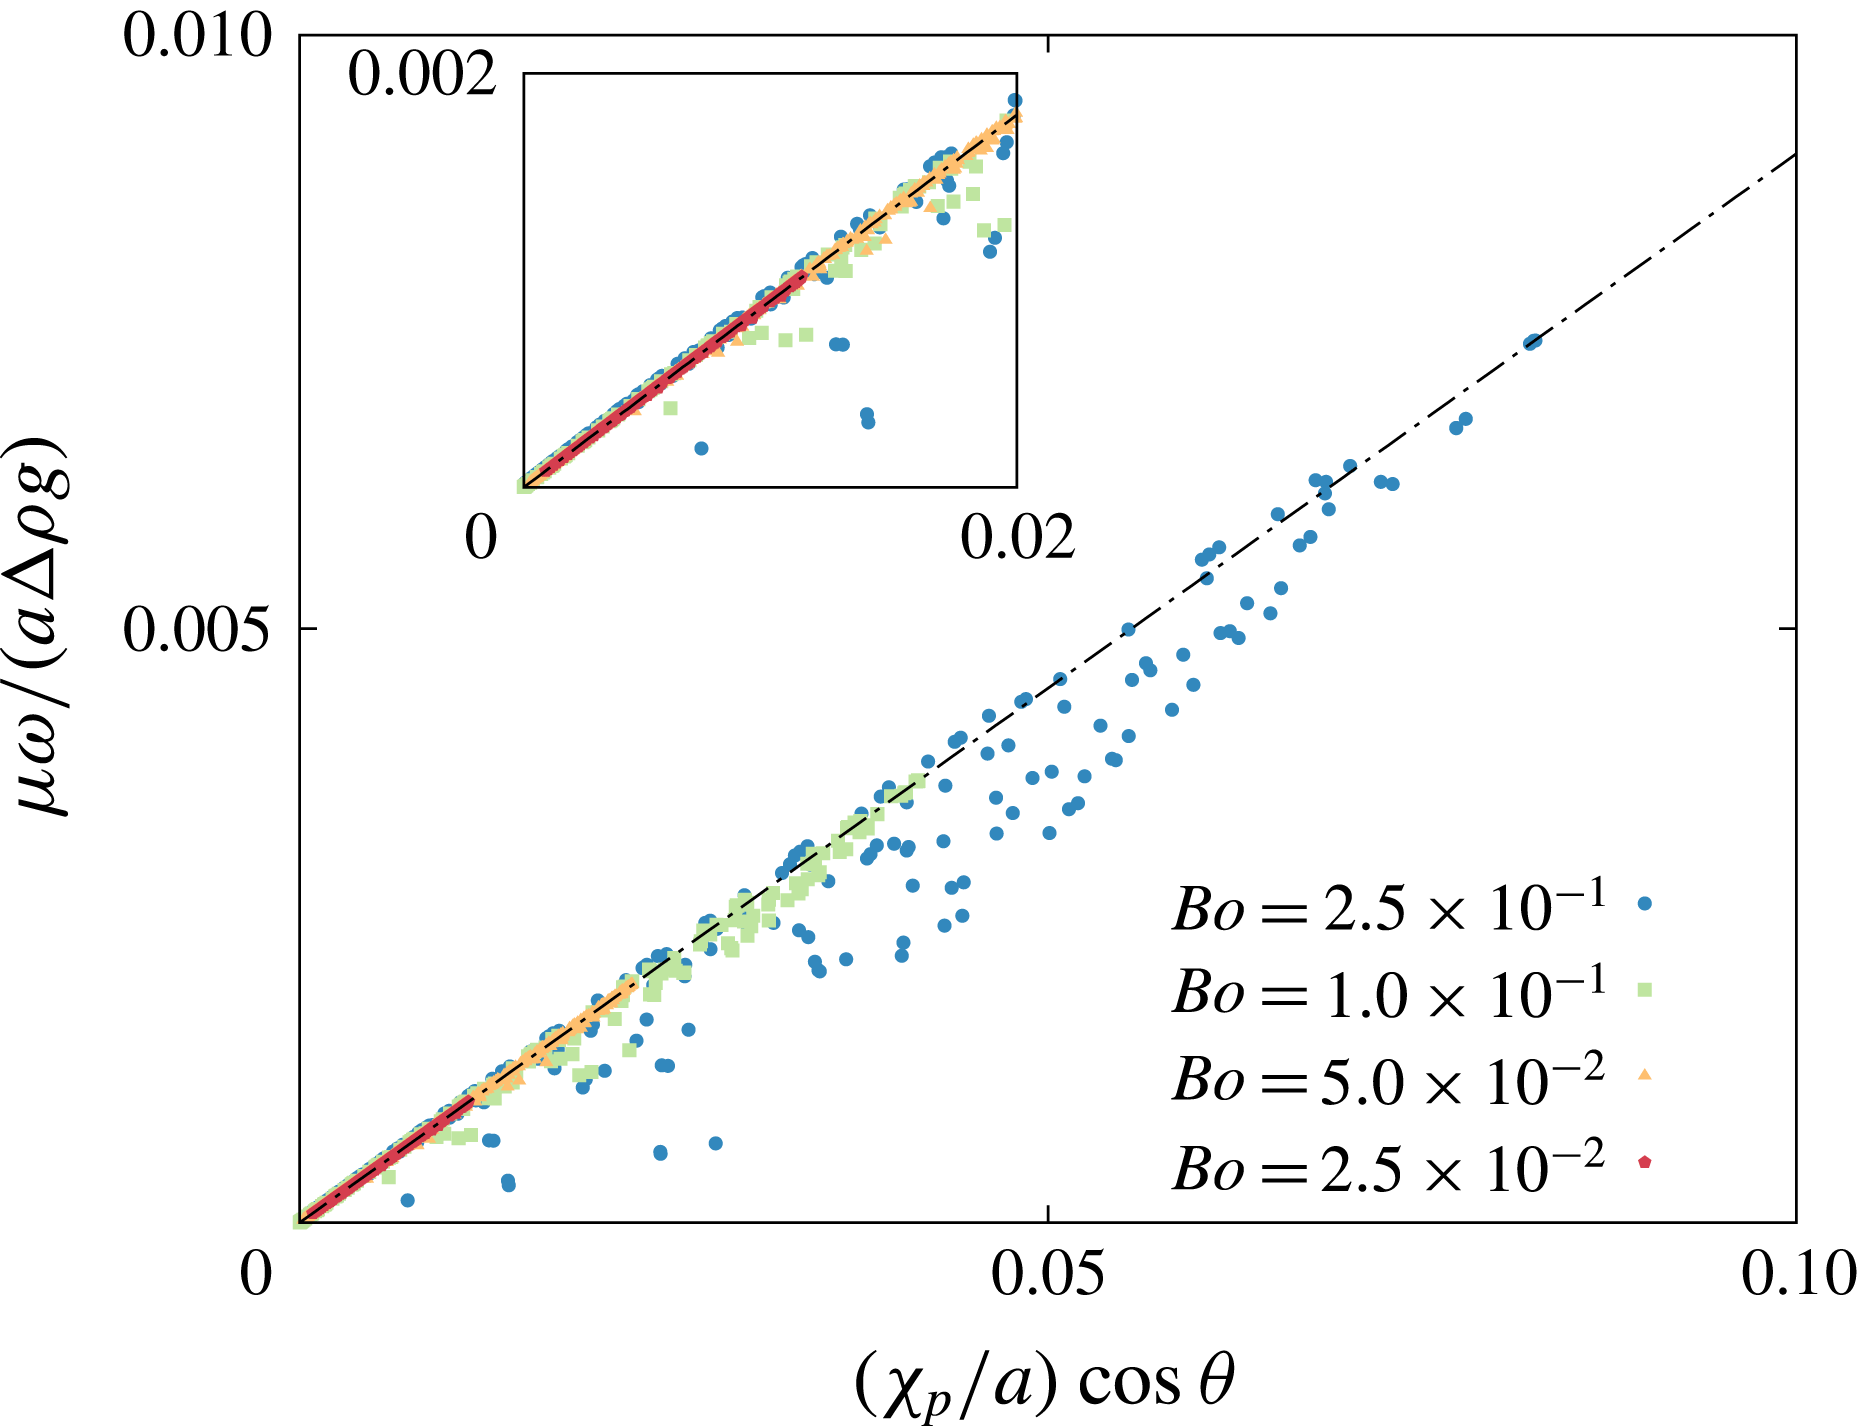
as discussed in appendix B, the angular velocity may be predicted using an equation that is slightly modified from (4.8), as
 $$\begin{eqnarray}\frac{\unicode[STIX]{x1D707}\unicode[STIX]{x1D714}}{a\unicode[STIX]{x0394}\unicode[STIX]{x1D70C}g}=\frac{\unicode[STIX]{x1D712}_{p}}{a}R^{\prime }\cos \unicode[STIX]{x1D703},\end{eqnarray}$$
where
 $R^{\prime }$
is again a shape coefficient. Figure 12 shows relations between the left-hand side and right-hand side of the equation at several points in time. Though plots with
 $Bo=2.5\times 10^{-1}$
deviate from others in the transient phase, it can be concluded that (4.11) describes well the mechanism of the reorientation since most of the plots converge to the same line. In the current result, the coefficient
 $R^{\prime }=0.09$
fits to the converged line well as shown in the figure. From this result, the angular velocity can be explained by the shape asymmetry and the instantaneous orientation angle.
4.5 Estimation of reorientation time
Now it can be understood that the angular velocities in figure 9(a–d) draw a
 $\sin 2\unicode[STIX]{x1D703}$
-like curve because the right-hand side of (4.11) contains components of
 $\sin \unicode[STIX]{x1D703}$
and
 $\cos \unicode[STIX]{x1D703}$
, where the asymmetry
 $\unicode[STIX]{x1D712}_{p}$
is responsible for the
 $\sin \unicode[STIX]{x1D703}$
-like change, as shown in figure 11.
When assuming that the angular velocity can be expressed as
 $$\begin{eqnarray}\frac{\text{d}\unicode[STIX]{x1D703}}{\text{d}t}=\unicode[STIX]{x1D714}_{0}\sin 2\unicode[STIX]{x1D703},\end{eqnarray}$$
where
 $\unicode[STIX]{x1D714}_{0}$
is the maximum amplitude of the angular velocity, the time required
 $T$
for a red blood cell to turn from angle
 $\unicode[STIX]{x1D703}_{1}$
to
 $\unicode[STIX]{x1D703}_{2}$
can be derived as
 $$\begin{eqnarray}T=\frac{1}{\unicode[STIX]{x1D714}_{0}}\int _{\unicode[STIX]{x1D703}_{1}}^{\unicode[STIX]{x1D703}_{2}}\frac{\text{d}\unicode[STIX]{x1D703}}{\sin 2\unicode[STIX]{x1D703}}=\frac{1}{2\unicode[STIX]{x1D714}_{0}}\ln \left(\frac{\tan \unicode[STIX]{x1D703}_{2}}{\tan \unicode[STIX]{x1D703}_{1}}\right).\end{eqnarray}$$
Though the curves of the angular velocity shown in figure 9 slightly deviate from (4.12), especially for high
 $\unicode[STIX]{x1D706}$
or
 $Bo$
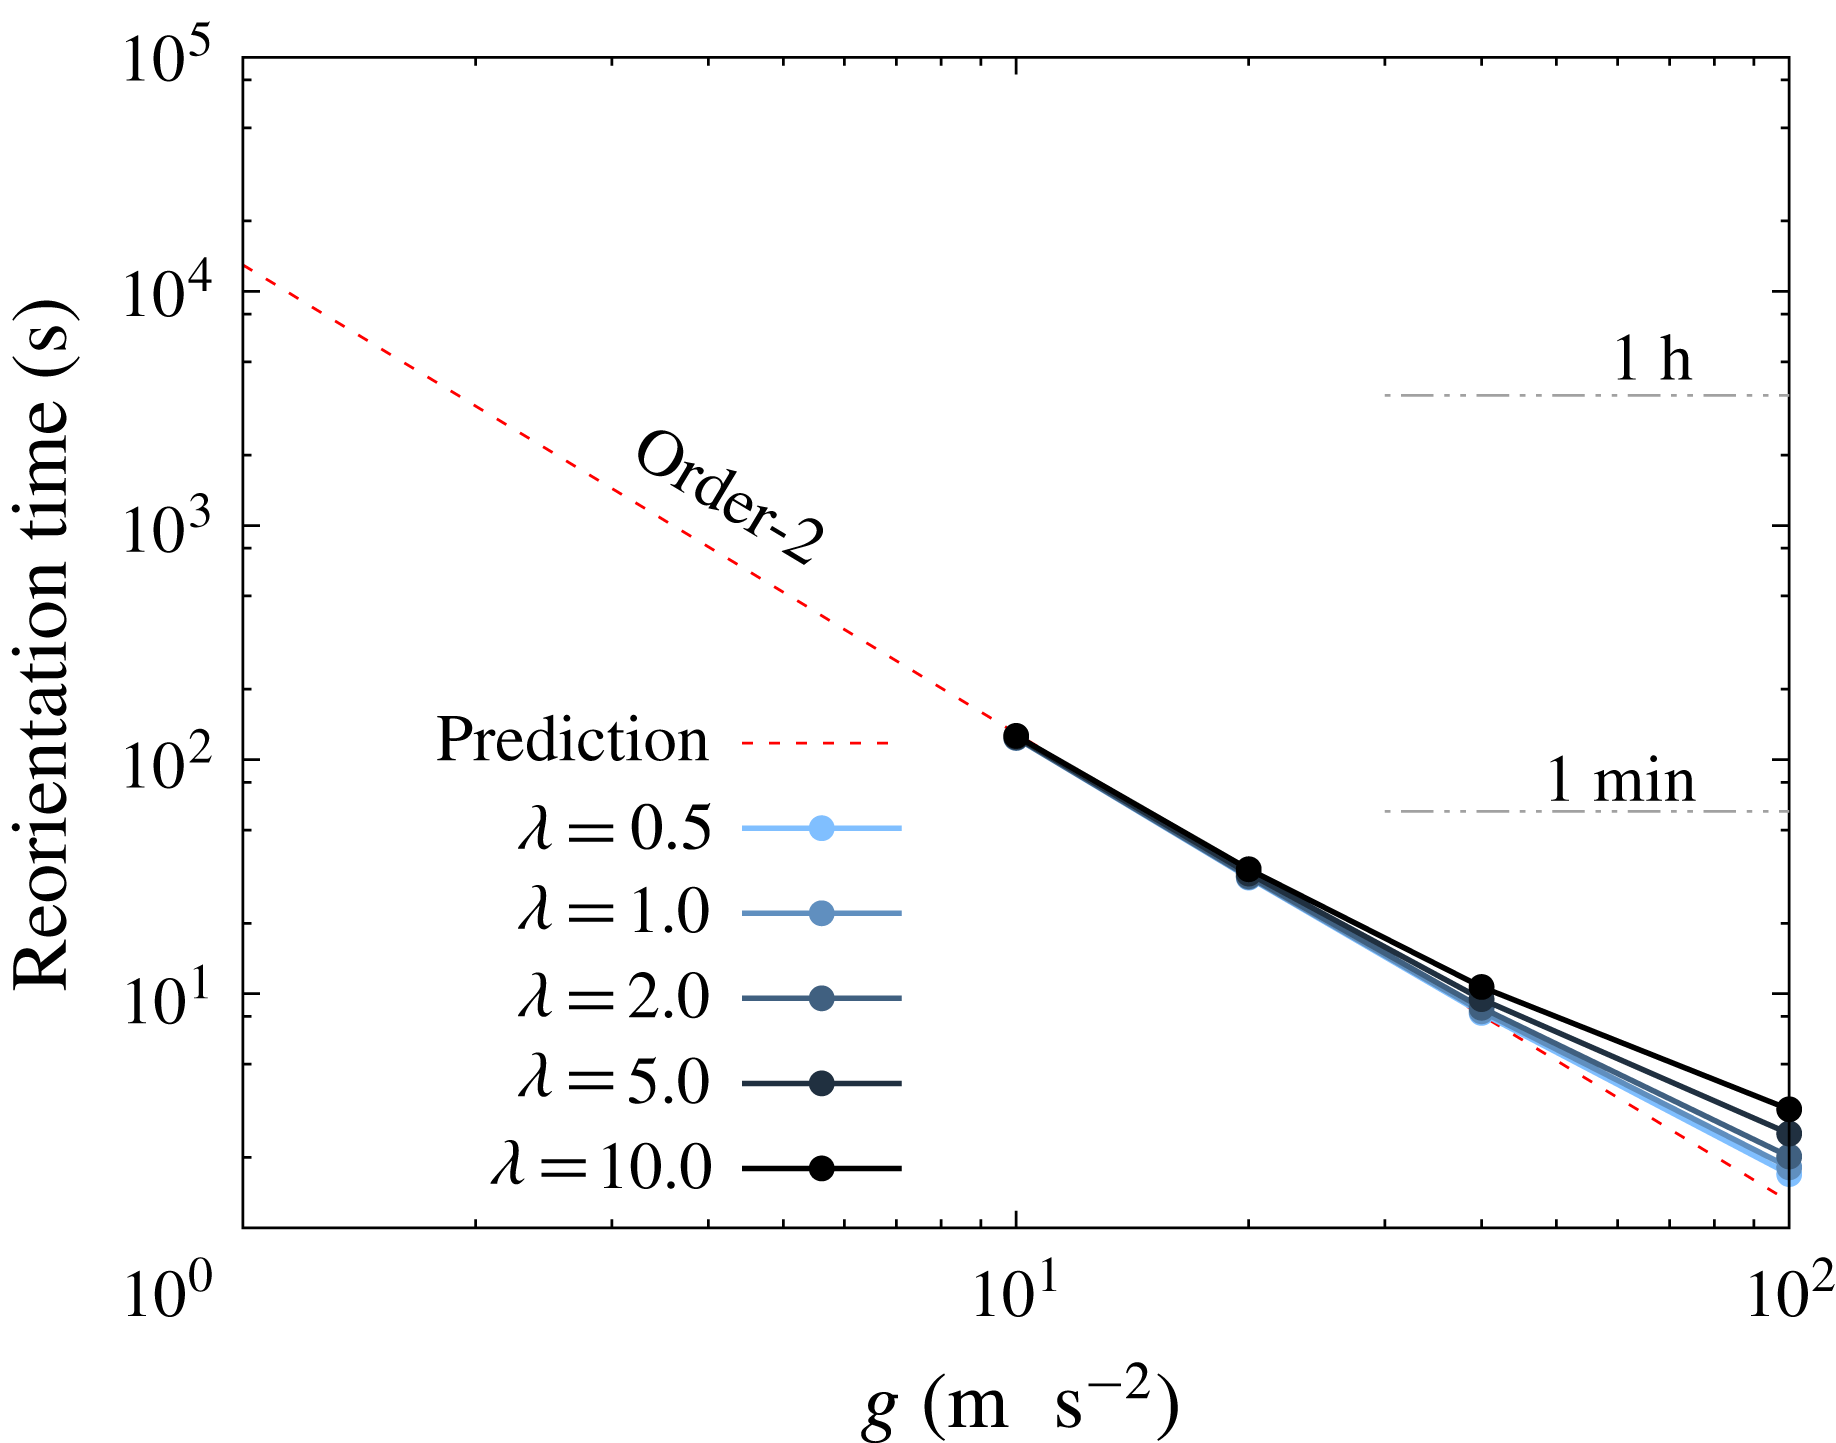
cases, the equation can still be used for a rough estimation. Figure 13 shows the reorientation time
 $T$
from an angle
 $\unicode[STIX]{x1D703}_{1}=\unicode[STIX]{x03C0}/24$
to
 $\unicode[STIX]{x1D703}_{2}=11\unicode[STIX]{x03C0}/24$
. The time is evaluated by substituting the maximum angular velocity
 $\unicode[STIX]{x1D714}_{max}$
, which is obtained from figure 9(e), to
 $\unicode[STIX]{x1D714}_{0}$
in (4.13). In the case of high
 $g$
, the cells reorient quickly and the reorientation process is of the order of seconds. It takes a longer time for lower
 $g$
, and the time scale of this reorientation is of the order of minutes for
 $10g$
.
Relations between the left-hand side and right-hand side of (4.11) at every time interval of
 $(a\unicode[STIX]{x0394}\unicode[STIX]{x1D70C}g)t/\unicode[STIX]{x1D707}=50$
. Each coloured plot consists of simulations with six different initial orientations and five different viscosity ratios, under fixed Bond number. Dotted line shows (4.11) under
 $R^{\prime }=0.09$
.

Estimated time for a single red blood cell to reorient from angle
 $\unicode[STIX]{x1D703}_{1}=\unicode[STIX]{x03C0}/24$
to
 $\unicode[STIX]{x1D703}_{2}=11\unicode[STIX]{x03C0}/24$
, which is obtained from (4.13). The range of gravitational acceleration is changed from
 $1g$
to
 $100g$
. The red dotted line shows the prediction using an extrapolation of the
 $O(Bo)$
curve in figure 9(g). Note that parameters
 $a=2.82~\unicode[STIX]{x03BC}\text{m}$
,
 $\unicode[STIX]{x1D707}=1.34\times 10^{-3}~\text{Pa}~\text{s}$
and
 $\unicode[STIX]{x0394}\unicode[STIX]{x1D70C}=0.078~\text{g}~\text{cm}^{-3}$
are used to convert the result to real units.

Though we did not simulate the full reorientation process under standard gravity, we still can extrapolate from the
 $O(Bo)$
curve in figure 9(g). According to the prediction, which is shown in a red dotted line in figure 13, the estimated reorientation time is more than an hour under standard gravity. Groom & Anderson (Reference Groom and Anderson1972) measured the orientation of blood cells with haematocrit of 0.15 %, and reported that 58 % of cells were rather vertical (
 $\unicode[STIX]{x1D703}>\unicode[STIX]{x03C0}/4$
) and the other 42 % were rather horizontal. A larger number with vertical orientations might be explained by this slow-but-finite process of reorientation, and the number of the vertically oriented cells may further increase with longer observation time.
4.6 Effect of stress-free shape
The reference stress-free state of the red blood cell has been actively discussed in recent years (Lim, Wortis & Mukhopadhyay Reference Lim, Wortis and Mukhopadhyay2002; Dupire, Socol & Viallat Reference Dupire, Socol and Viallat2012; Tsubota et al.
Reference Tsubota, Wada and Liu2014; Peng et al.
Reference Peng, Mashayekh and Zhu2014; Sinha & Graham Reference Sinha and Graham2015), and many models have been suggested for precise description of the membrane. In order to check how sensitive our conclusion is by changing the stress-free state, we finally test sedimentations with a different red blood cell model. The new shape is obtained by deflating the stretch-free oblate spheroid (reduced volume
 $\unicode[STIX]{x1D70F}\approx 0.90$
, aspect ratio
 $\unicode[STIX]{x1D6FD}=1.84$
, reference curvature
 $c_{0}=0$
) until the shape reaches the reduced volume of the red blood cell
 $\unicode[STIX]{x1D70F}_{RBC}\approx 0.637$
(Evans & Fung Reference Evans and Fung1972). This reduced volume
 $\unicode[STIX]{x1D70F}=0.90$
and the deflation method are same conditions used in Peng et al. (Reference Peng, Mashayekh and Zhu2014).
Result with a different stress-free shape: (a) Norm of the asymmetry parameter
 $\unicode[STIX]{x1D712}/a$
as a function of the Bond number
 $Bo$
. (b) Non-dimensional angular velocity
 $\unicode[STIX]{x1D707}\unicode[STIX]{x1D714}/(a\unicode[STIX]{x0394}\unicode[STIX]{x1D70C}g)$
as a function of the instantaneous orientation angle
 $\unicode[STIX]{x1D703}$
. The viscosity ratio is
 $\unicode[STIX]{x1D706}=1.0$
, and a filled squared plot shows the initial state.

In conclusion, changing the stress-free state did not change our conclusion. Figure 14(a) shows that the asymmetry parameter
 $\unicode[STIX]{x1D712}$
increases linearly with the Bond number, same as figure 10. The angular velocities from the initial angle
 $\unicode[STIX]{x1D703}_{0}=\unicode[STIX]{x03C0}/4$
are shown in figure 14(b), and the results are again qualitatively the same as figure 9(a–d). The results imply that the stress-free shape would not drastically revise the trends, under the values of
 $Bo$
and
 $Be$
considered in this paper.
5 Conclusion
In the present study, we have investigated the reorientation phenomenon of a single red blood cell during sedimentation, under a range of the Bond number
 $2.5\times 10^{-3}\leqslant Bo\leqslant 2.5\times 10^{-1}$
and the viscosity ratio
 $0.5\leqslant \unicode[STIX]{x1D706}\leqslant 10.0$
. In our numerical study based on the boundary element method, the red blood cells all change their orientation toward vertical orientation. A previous experiment (Hoffman & Inoué Reference Hoffman and Inoué2006) reported that the cells reorient toward vertical orientation under strong centrifugation, and our numerical result has good agreement with their results. The reorientation phenomenon is explained by a shape asymmetry caused by the gravitational driving force, and the asymmetry increases almost linearly with the Bond number. When velocities are normalised by the driving force, settling/drifting velocities are weak functions of
 $Bo$
and
 $\unicode[STIX]{x1D706}$
, while the angular velocity of the reorientation drastically changes with
 $Bo$
and
 $\unicode[STIX]{x1D706}$
: the angular velocity is smaller for lower
 $Bo$
or higher
 $\unicode[STIX]{x1D706}$
. As a consequence, trajectories of the sedimentation are also affected by the angular velocity, and blood cells with slower reorientation travel a longer distance in the drifting direction. We also explained the mechanism of the reorientation using an asymmetric dumbbell. From the analysis, we show that the magnitude of the angular velocity can be divided into two main factors: the shape asymmetry and the instantaneous orientation angle. The reorientation toward a vertical orientation may not be the case when the cell is in the vicinity of a bottom wall, as shown in appendix C.
A previous experiment under standard gravity (Groom & Anderson Reference Groom and Anderson1972) reported that there were a larger number of vertically oriented cells compared to horizontal ones during the sedimentation. Since our results explain the experimental results well under standard gravity and high accelerations (Hoffman & Inoué Reference Hoffman and Inoué2006), our current study would be helpful to understand the underlying mechanism of sedimentation and reorientation. The settling of whole blood includes rouleaux formations and complicated fluid mechanical interactions between cells, and the system is known to be chaotic. The present findings of a single-cell system are an important milestone to understand the whole system of multi-cell settling. We hope that our findings will be useful for understanding ESR, and for better manipulation of cells with density contrast.
Acknowledgements
This research was supported by JSPS KAKENHI Grant numbers 25000008, 26107703 and 14J04025, and German Science Foundation research initiative SFB1027.
Supplementary movie
A supplementary movie is available at http://dx.doi.org/10.1017/jfm.2016.601.
Appendix A. Numerical set-up and comparison with previous studies
In this appendix, we first show numerical convergence with respect to the discrete time step
 $\unicode[STIX]{x0394}t$
and mesh size. Second, we check the validity of our software from simulations of a buoyant drop (Koh & Leal Reference Koh and Leal1989) in § A.2 and a settling spherical capsule (Boltz & Kierfeld Reference Boltz and Kierfeld2015) in § A.3.
A.1 Validation of numerical set-ups
We show that the discrete time step
 $\unicode[STIX]{x0394}t$
and mesh size are sufficiently small in our simulations. For the validation, we simulate a process of a red blood cell (Bond number
 $Bo=2.5\times 10^{-1}$
and viscosity ratio
 $\unicode[STIX]{x1D706}=1$
) changing its orientation from the initial angle
 $\unicode[STIX]{x1D703}_{0}=5\unicode[STIX]{x03C0}/12$
to
 $\unicode[STIX]{x1D703}\approx \unicode[STIX]{x03C0}/2$
during settling.
First, we compare the result with two different mesh numbers
 $N_{E}=5120$
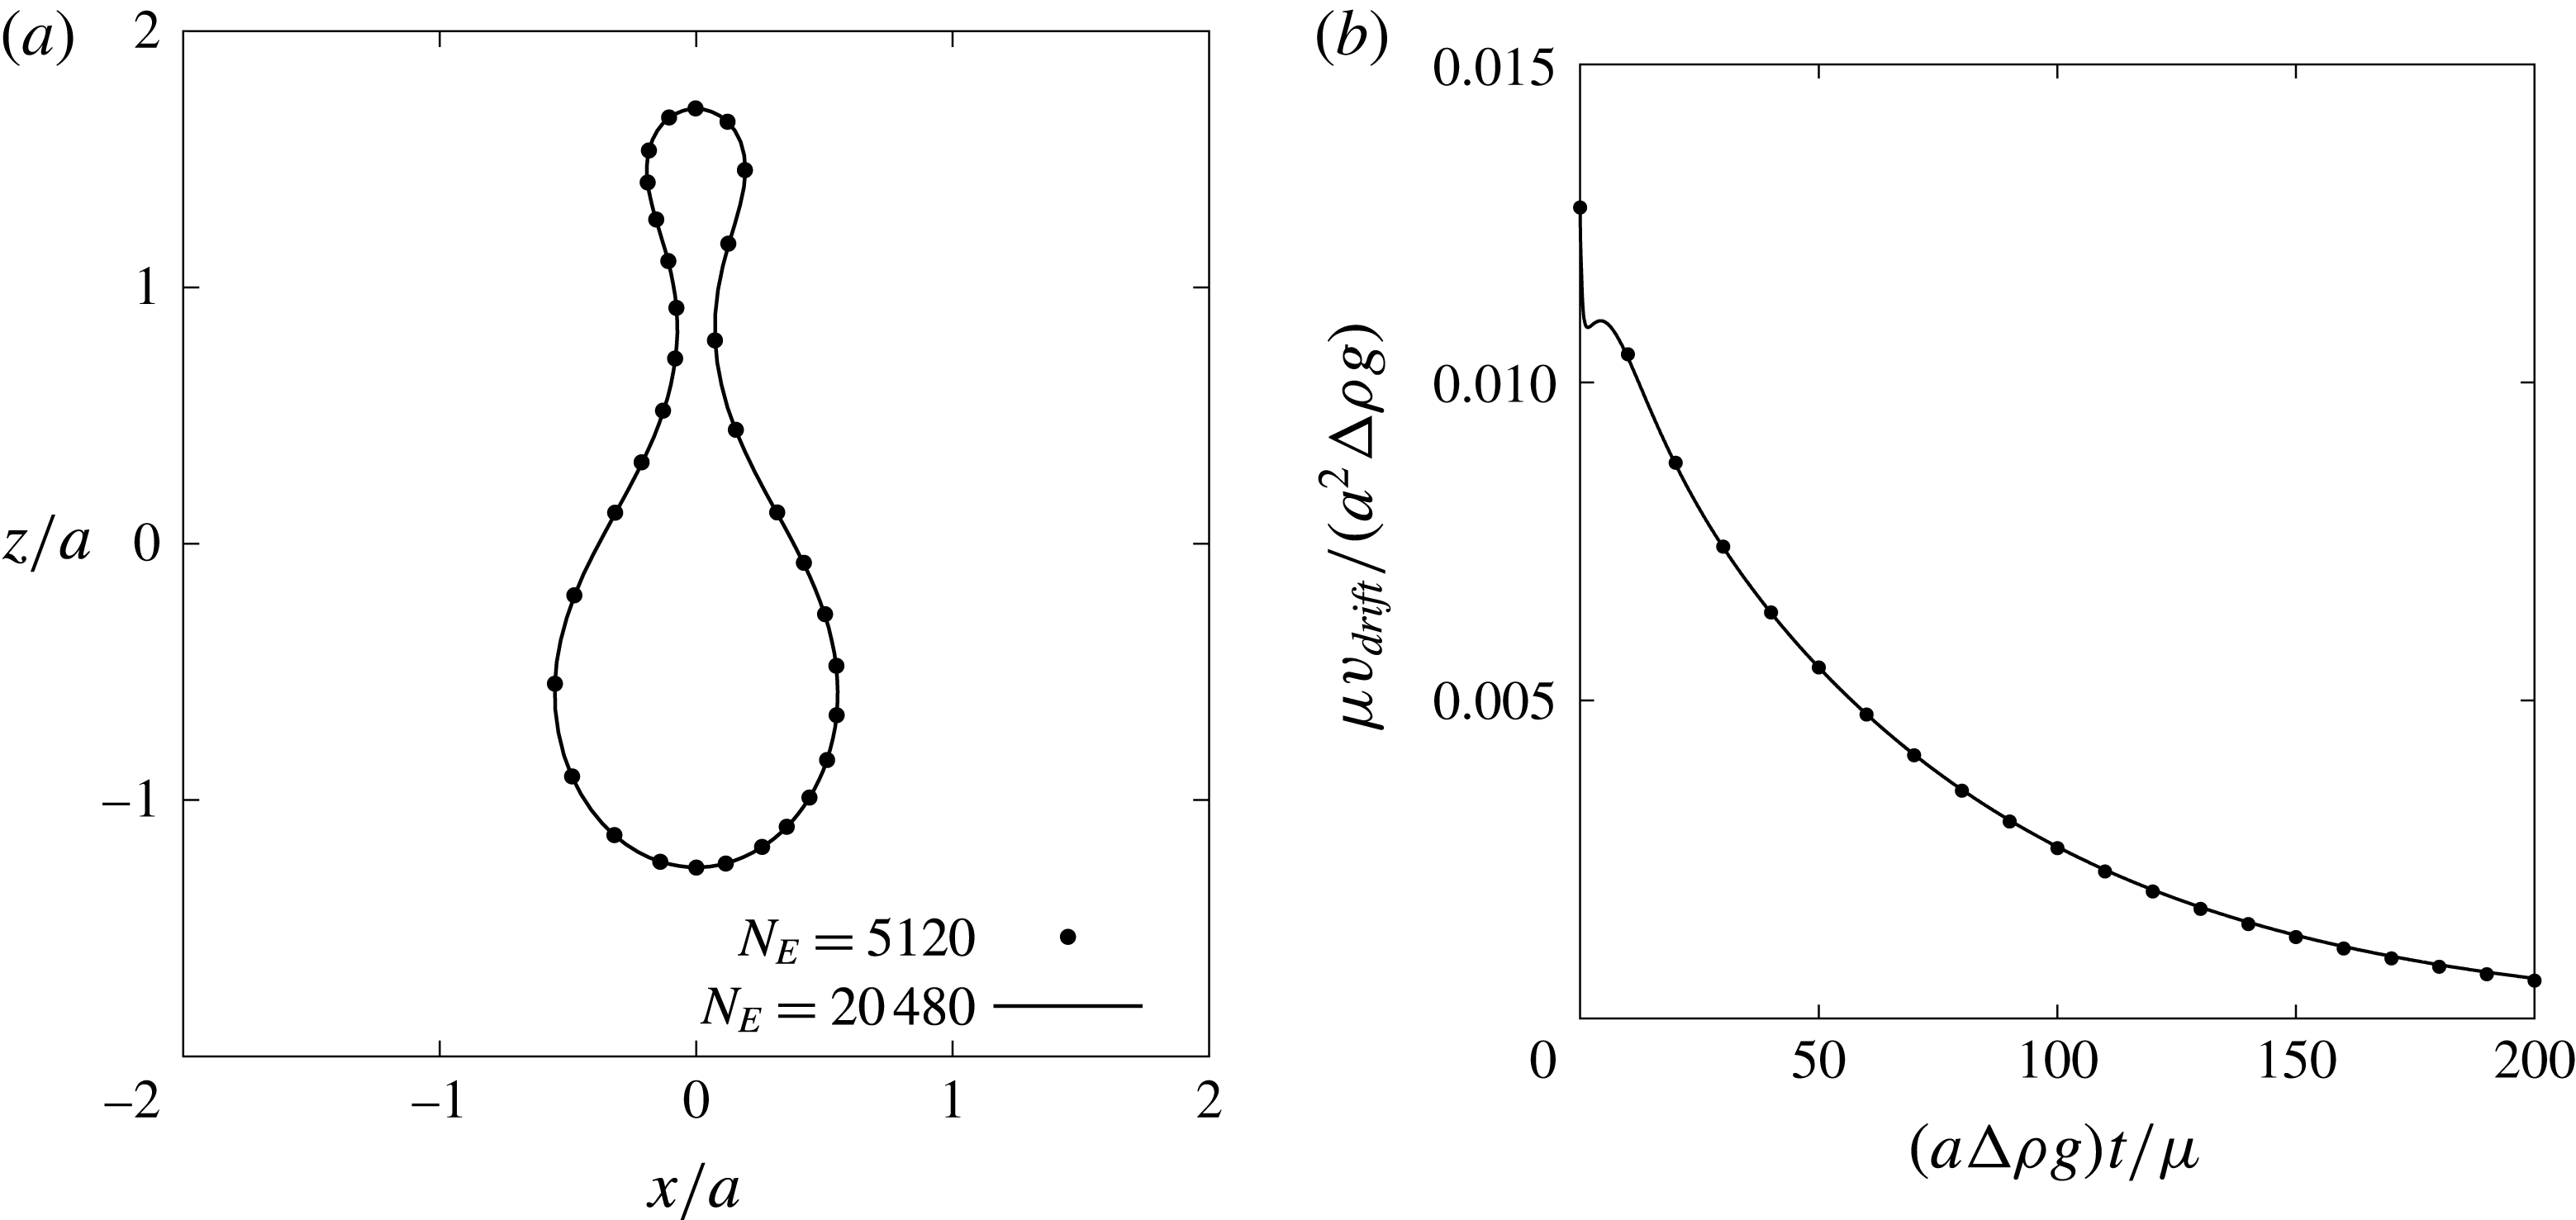
and 20 480. Figure 15 shows that (a) cross-sectional shape at
 $(a\unicode[STIX]{x0394}\unicode[STIX]{x1D70C}g)t/\unicode[STIX]{x1D707}=200$
and (b) the drifting velocity are in good agreement in two different simulations. The difference between the two drifting velocities was always
 $\unicode[STIX]{x1D707}v_{drift}/(a^{2}\unicode[STIX]{x0394}\unicode[STIX]{x1D70C}g)\approx O(10^{-5})$
. We also compare results for two different discrete times of
 $\unicode[STIX]{x0394}t=2.0\times 10^{-4}$
and
 $1.0\times 10^{-5}$
, and the velocity difference was again very small
 $\unicode[STIX]{x1D707}v_{drift}/(a^{2}\unicode[STIX]{x0394}\unicode[STIX]{x1D70C}g)<O(10^{-6})$
.
Effect of the mesh number
 $N_{E}$
on (a) cross-sectional shape at time
 $(a\unicode[STIX]{x0394}\unicode[STIX]{x1D70C}g)t/\unicode[STIX]{x1D707}=200$
and (b) the drifting velocity
 $v_{drift}$
. A red blood cell at Bond number
 $Bo=2.5\times 10^{-1}$
, viscosity ratio
 $\unicode[STIX]{x1D706}=1.0$
and initial angle
 $\unicode[STIX]{x1D703}_{0}=5\unicode[STIX]{x03C0}/12$
is simulated with two different mesh numbers
 $N_{E}=5120$
and 20 480.

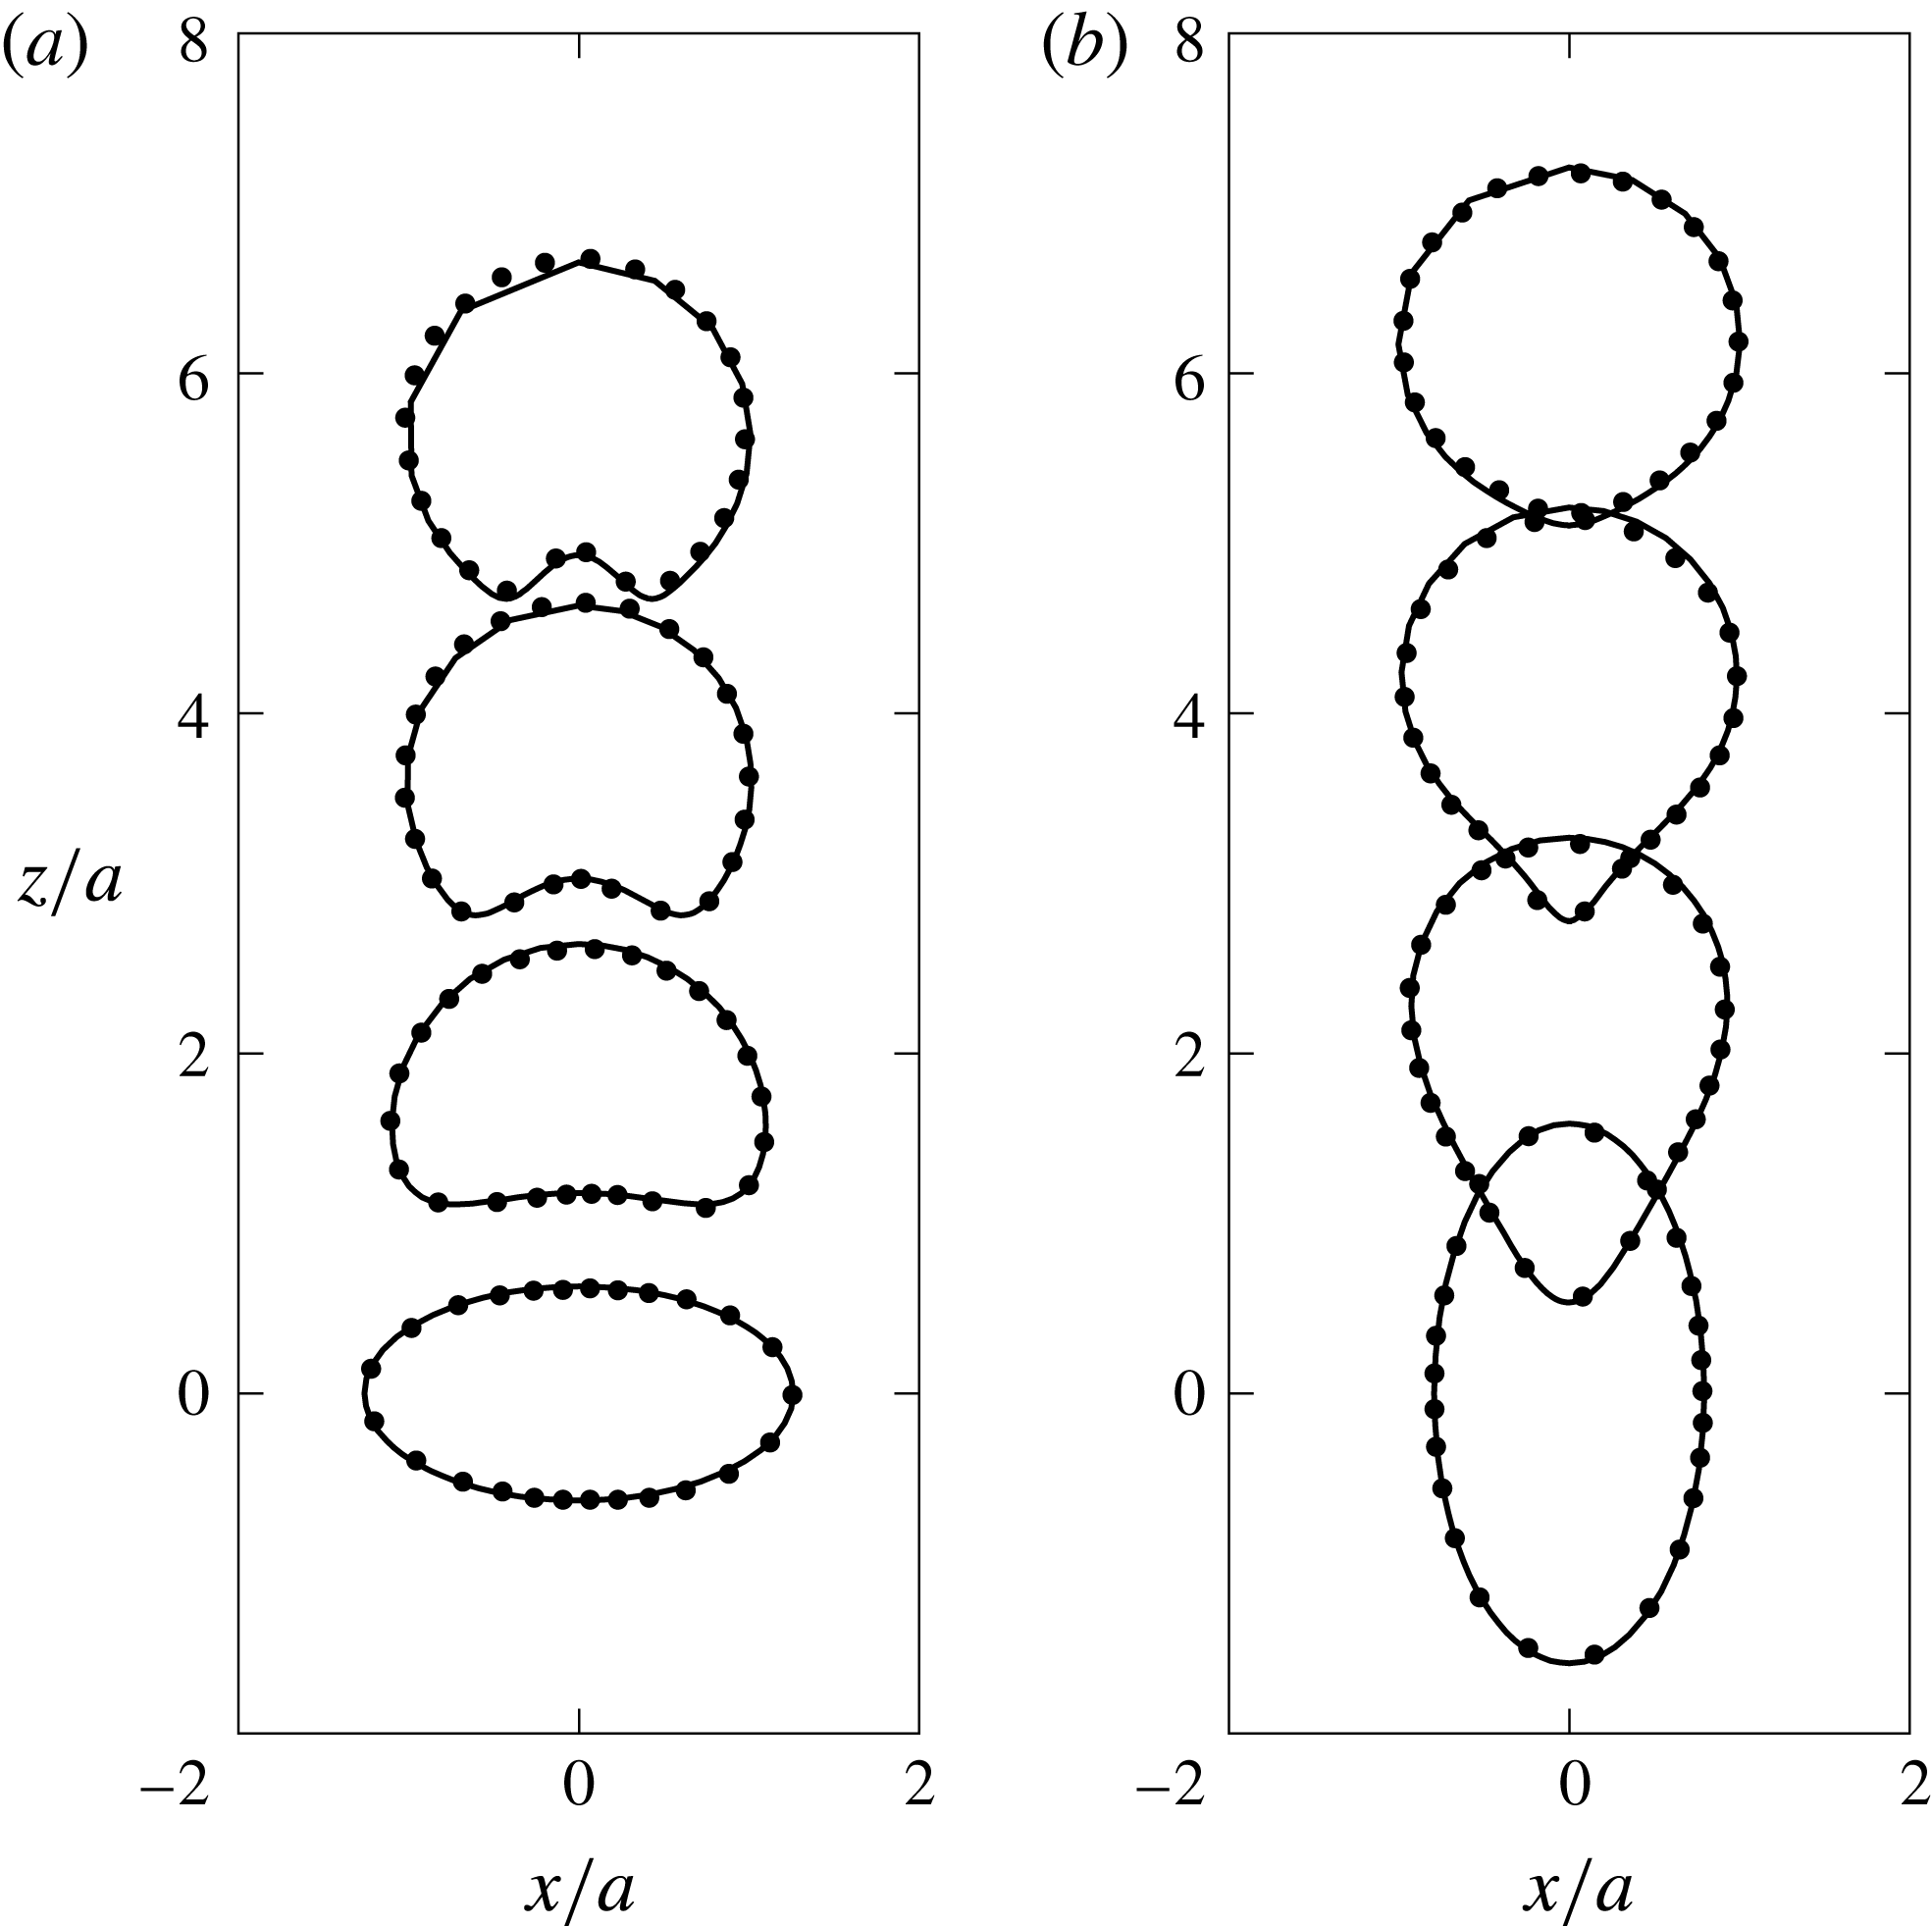
Time history of shapes of a single buoyant drop, which has an initial shape of (a) an oblate spheroid with aspect ratio
 $\unicode[STIX]{x1D6FD}=2.0$
and (b) prolate spheroid with
 $\unicode[STIX]{x1D6FD}=0.5$
. Solid lines show the cross-sectional view of our three-dimensional simulation, while dots represent the result of Koh & Leal (Reference Koh and Leal1989), which assumes axisymmetry with respect to the
 $z$
-axis. The Bond number of each case is (a)
 $Bo_{drop}=12.25$
and (b)
 $4.375$
, and the viscosity ratio is same for both cases,
 $\unicode[STIX]{x1D706}=0.5$
.

A.2 Comparison: motion of a buoyant drop
In order to switch the system from a capsule to a buoyant drop, the surface load
 $\boldsymbol{q}$
shown in (2.11) and (2.12) is changed to
 $$\begin{eqnarray}\boldsymbol{q}=\boldsymbol{q}_{g}+\boldsymbol{q}_{b}=\{\unicode[STIX]{x0394}\unicode[STIX]{x1D70C}(\boldsymbol{x}_{r}\boldsymbol{\cdot }\boldsymbol{g})+2H\unicode[STIX]{x1D705}\}\boldsymbol{n},\end{eqnarray}$$
where
 $\unicode[STIX]{x1D705}$
is the coefficient of surface tension and the Bond number in this system is defined as
 $Bo_{drop}=a^{2}\unicode[STIX]{x0394}\unicode[STIX]{x1D70C}g/\unicode[STIX]{x1D705}$
. We keep all other numerical set-up the same as the capsule simulations.
Figure 16 shows the motion of a buoyant drop with two different initial states, and the snapshots are shown at multiples of
 $(a\unicode[STIX]{x0394}\unicode[STIX]{x1D70C}g)t/\unicode[STIX]{x1D707}=7$
. Note that the capillary number
 $Ca$
that appears in Koh & Leal (Reference Koh and Leal1989) is converted to the Bond number via the relation
 $Bo_{drop}=Ca(9\unicode[STIX]{x1D706}+6)/(2\unicode[STIX]{x1D706}+2)$
(Pozrikidis Reference Pozrikidis1990). The figure shows that our simulation reproduces well the shapes and ascent velocities of the previous study, even under large deformations.
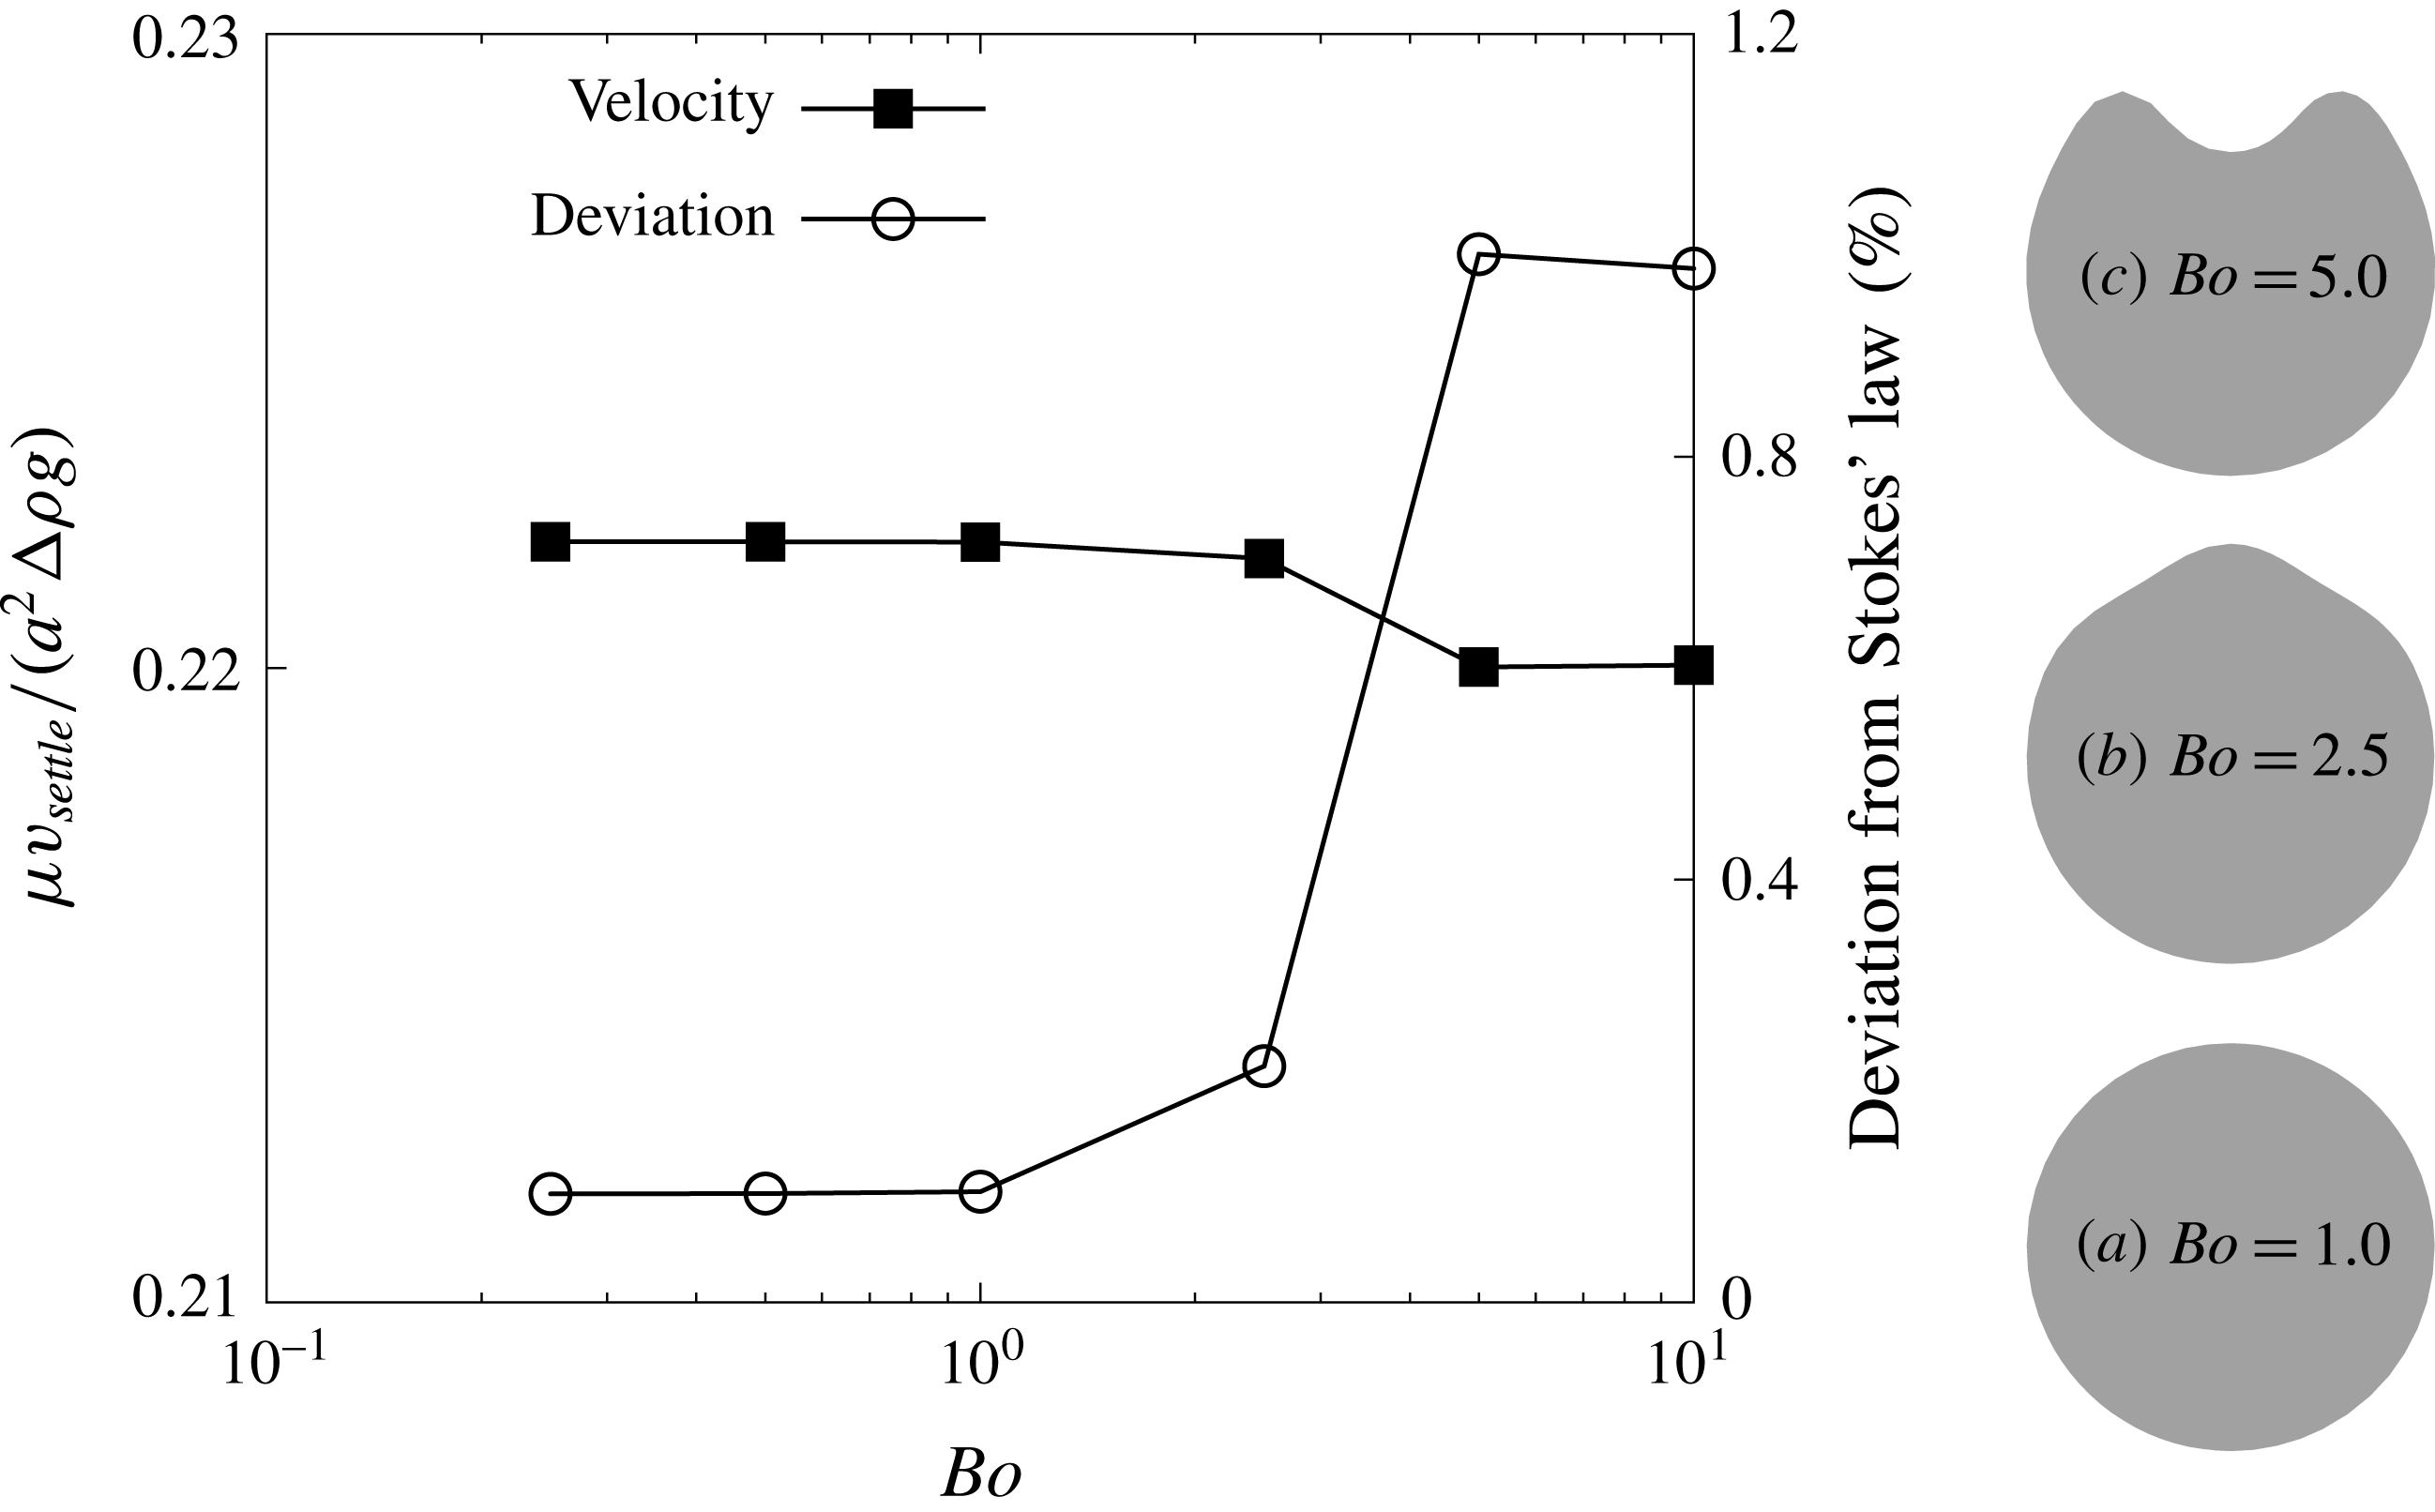
Square plots show the settling velocity of a spherical capsule
 $v_{settle}$
as a function of the Bond number, while circled plots show the deviation from the Stokes velocity
 $\unicode[STIX]{x1D707}U/(a^{2}\unicode[STIX]{x0394}\unicode[STIX]{x1D70C}g)=2/9$
. Three grey shapes show the cross-sectional view of the capsule at three different Bond numbers. Note that the direction of gravitation is downwards.

A.3 Comparison: sedimentation of a spherical capsule
Sedimentation of a spherical capsule with radius
 $a$
, non-dimensional bending stiffness
 $Be=1.0\times 10^{-2}$
 $(c_{0}=0)$
and viscosity ratio
 $\unicode[STIX]{x1D706}=1$
is simulated, as shown in figure 17. If the capsule membrane is sufficiently stiff (
 $Bo\rightarrow 0$
), the settling velocity
 $v_{settle}$
would converge to that of a rigid sphere
 $U=2a^{2}\unicode[STIX]{x0394}\unicode[STIX]{x1D70C}g/(9\unicode[STIX]{x1D707})$
, which is obtained from Stokes’ law. The figure shows that the settling velocity converges to
 $\unicode[STIX]{x1D707}v_{settle}/(a^{2}\unicode[STIX]{x0394}\unicode[STIX]{x1D70C}g)=2/9$
when the Bond number is decreased, and the deviation from Stokes’ law is only
 ${\approx}0.1\,\%$
. Note that the small error arises because the mesh topology is a polyhedron, and the error can be reduced by increasing the number of mesh elements.
Boltz & Kierfeld (Reference Boltz and Kierfeld2015) simulated the sedimentation of a Hookean spherical capsule in an axisymmetric system and reported a detailed diagram of three different stationary shapes. A capsule experiences first a pseudo-spherical shape, then a pear shape and finally a buckled shape with increasing
 $Bo$
. Our results shown in figure 17 also exhibit (a) pseudo-spherical shape, (b) pear shape and (c) buckled shape in the same order as Boltz & Kierfeld (Reference Boltz and Kierfeld2015), so we can conclude that there is qualitative agreement with this previous study.
Appendix B. Linearity of asymmetry parameters
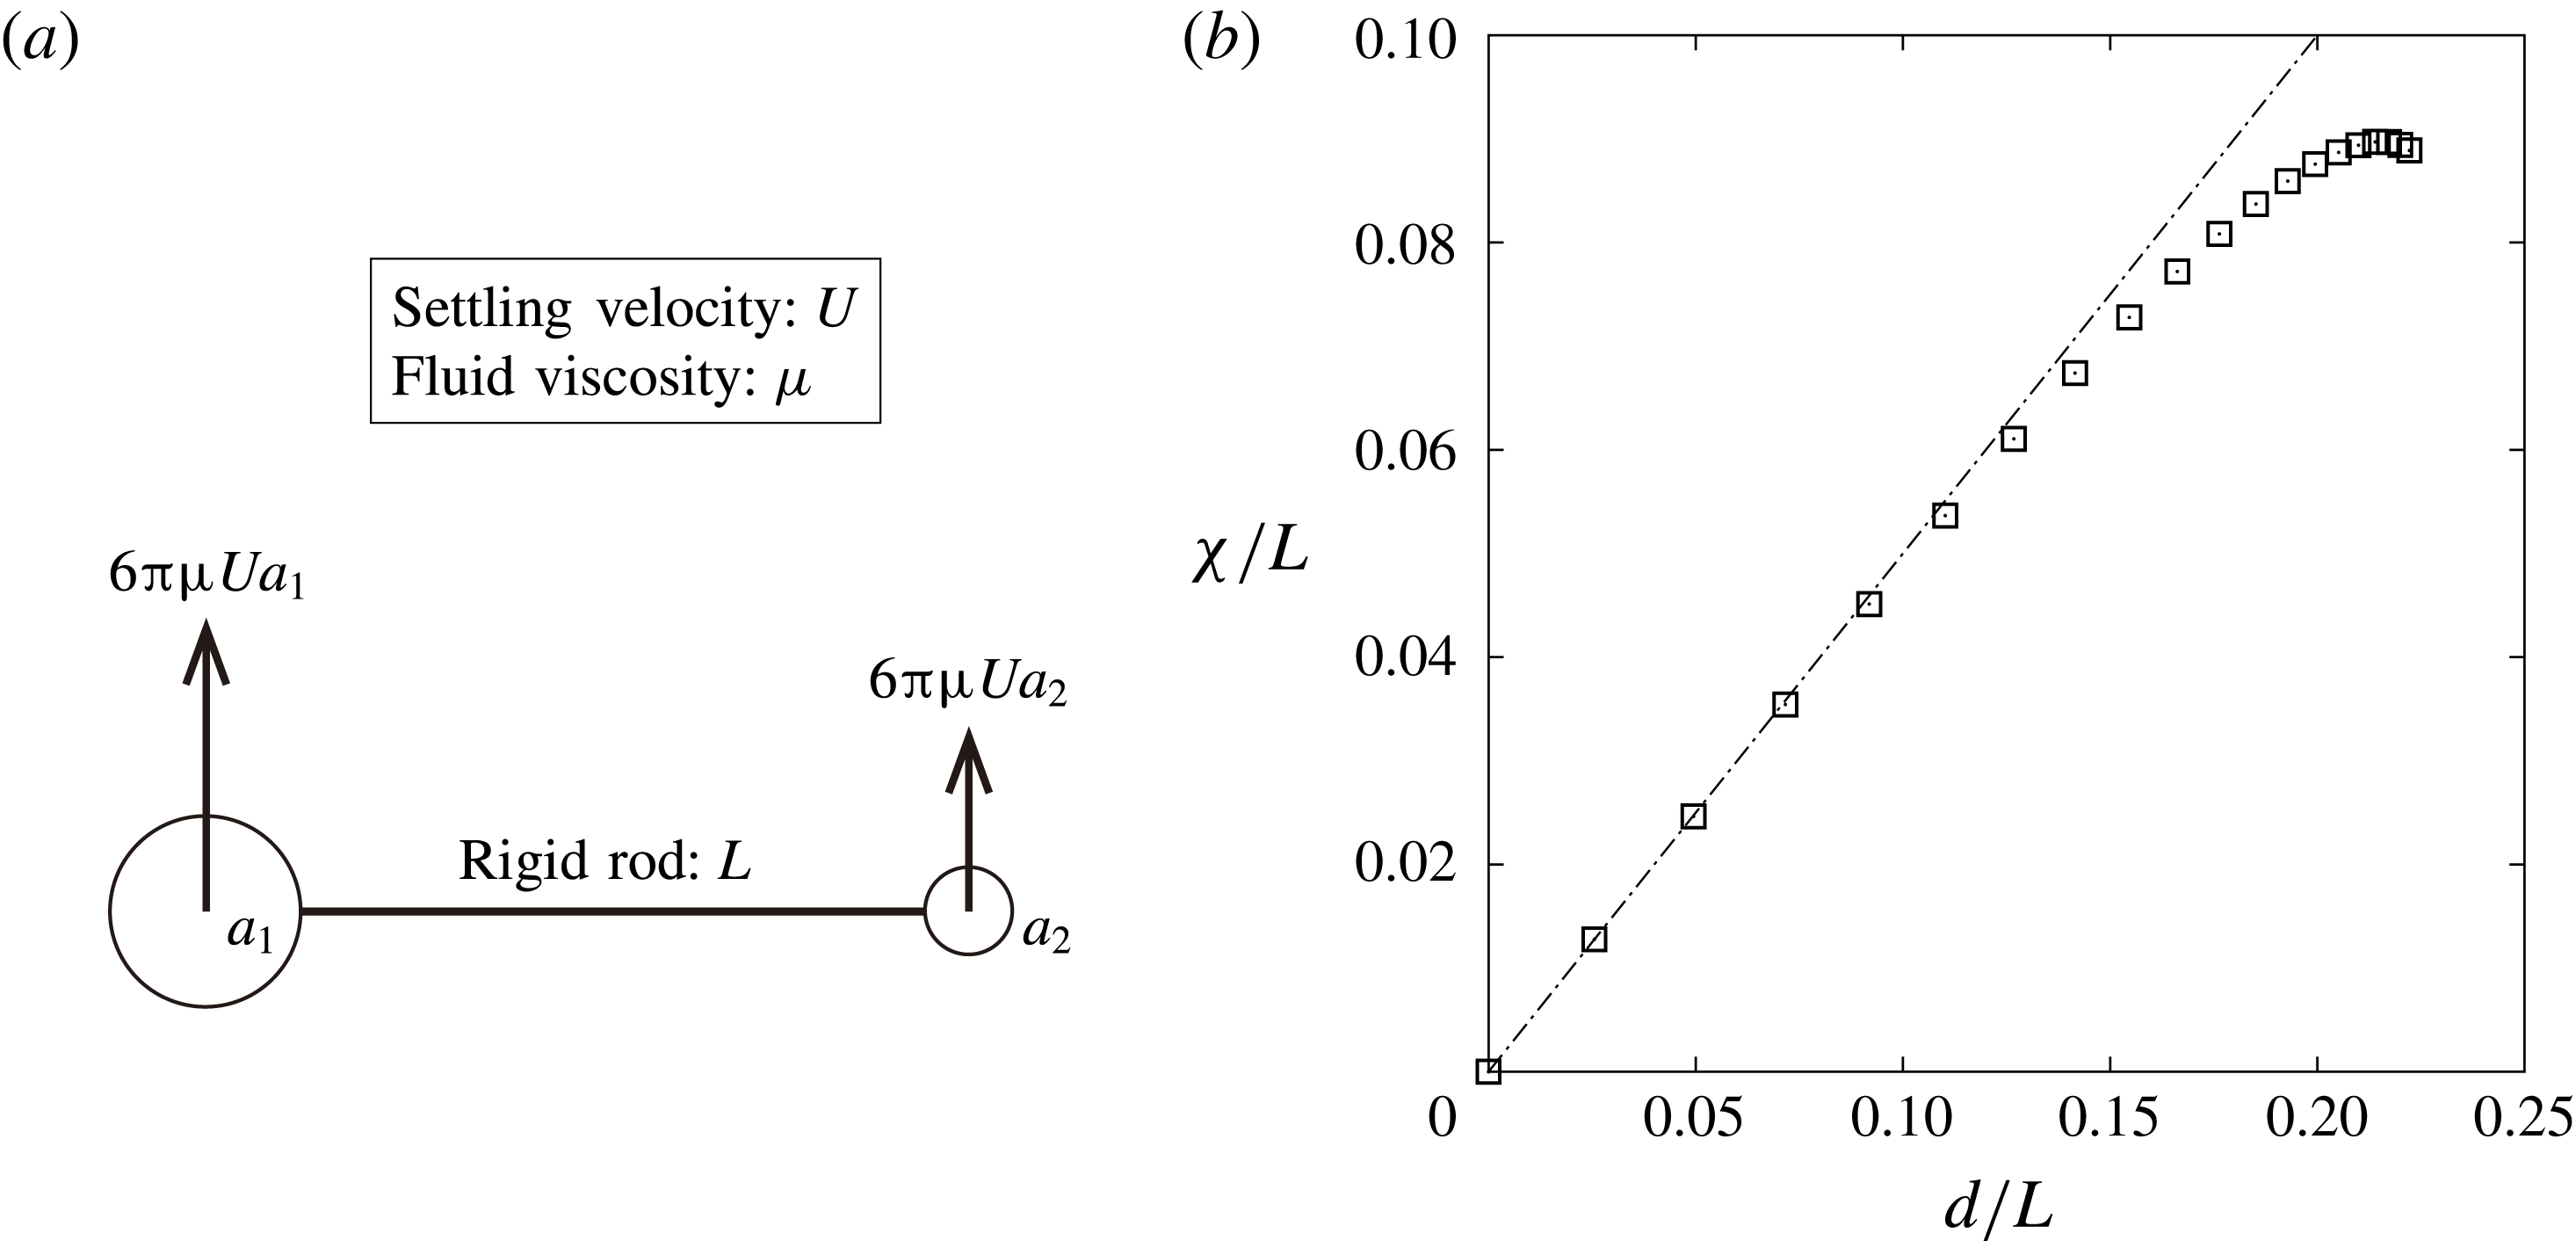
Consider an asymmetric dumbbell, which consists of two spherical particles and a rigid rod as shown in figure 18(a). The particles have a larger density compared to the outer fluid, and the dumbbell would settle downwards. The radii of the spheres are
 $a_{1}$
and
 $a_{2}$
respectively, and the latter particle is smaller: i.e.
 $\unicode[STIX]{x1D6FC}=a_{1}/a_{2}\geqslant 1$
. Three different centres of the dumbbell are considered in this section: volume centre
 $\boldsymbol{x}_{v}$
, areal centre
 $\boldsymbol{x}_{a}$
and the hydrodynamic centre
 $\boldsymbol{x}_{h}$
. The purpose of this section is to show a linearity between distances
 $\unicode[STIX]{x1D712}=|\boldsymbol{x}_{v}-\boldsymbol{x}_{a}|$
and
 $d=|\boldsymbol{x}_{v}-\boldsymbol{x}_{h}|$
, when the radii of the two spheres are nearly the same,
 $\unicode[STIX]{x1D6FC}\approx 1$
. Note that the discussion in this section is an extension from Happel & Brenner (Reference Happel and Brenner1963).
Mass and hydrodynamic resistance of the rigid rod are ignored by assuming that these are sufficiently small compared to those of the spheres. It is also assumed that the hydrodynamic interactions between the two particles are negligible since the length of the rigid rod
 $L$
is long enough. Now, the hydrodynamic force exerted on each particle can be described as
 $6\unicode[STIX]{x03C0}\unicode[STIX]{x1D707}Ua_{1}$
and
 $6\unicode[STIX]{x03C0}\unicode[STIX]{x1D707}Ua_{2}$
as shown in the schematic, where
 $\unicode[STIX]{x1D707}$
is the fluid viscosity and
 $U$
is the settling velocity of the dumbbell.
(a) Schematic of an asymmetric dumbbell settling because of a density difference. (b) Relation between two distances
 $|\unicode[STIX]{x1D74C}/L|$
and
 $d/L$
when changing the radius ratio
 $\unicode[STIX]{x1D6FC}$
from 1 to 2.

Considering the centre of sphere
 $a_{1}$
as the origin, the position coordinates of each centre can be described as:
 $$\begin{eqnarray}\displaystyle & \displaystyle \boldsymbol{x}_{v}=\frac{4/3\unicode[STIX]{x03C0}a_{2}^{3}}{4/3\unicode[STIX]{x03C0}(a_{1}^{3}+a_{2}^{3})}\boldsymbol{r}_{12}=\frac{1}{1+\unicode[STIX]{x1D6FC}^{3}}\boldsymbol{r}_{12}, & \displaystyle\end{eqnarray}$$
 $$\begin{eqnarray}\displaystyle & \displaystyle \boldsymbol{x}_{a}=\frac{4\unicode[STIX]{x03C0}a_{2}^{2}}{4\unicode[STIX]{x03C0}(a_{1}^{2}+a_{2}^{2})}\boldsymbol{r}_{12}=\frac{1}{1+\unicode[STIX]{x1D6FC}^{2}}\boldsymbol{r}_{12}, & \displaystyle\end{eqnarray}$$
where
 $\boldsymbol{r}_{12}$
is a vector from sphere
 $a_{1}$
to
 $a_{2}$
. The hydrodynamic centre
 $\boldsymbol{x}_{h}$
can be obtained from the torque balance as
 $$\begin{eqnarray}\boldsymbol{x}_{h}=\frac{1}{1+\unicode[STIX]{x1D6FC}}\boldsymbol{r}_{12}.\end{eqnarray}$$
From the obtained equation, it is obvious that the three centres always satisfy a relation
 $|\boldsymbol{x}_{h}|\geqslant |\boldsymbol{x}_{a}|\geqslant |\boldsymbol{x}_{v}|$
. Now, the distance between two centres can be obtained as
 $$\begin{eqnarray}\displaystyle & \displaystyle \unicode[STIX]{x1D712}=|\boldsymbol{x}_{a}-\boldsymbol{x}_{v}|=\frac{\unicode[STIX]{x1D6FC}^{2}(\unicode[STIX]{x1D6FC}-1)}{(1+\unicode[STIX]{x1D6FC}^{2})(1+\unicode[STIX]{x1D6FC})(\unicode[STIX]{x1D6FC}^{2}-\unicode[STIX]{x1D6FC}+1)}L & \displaystyle\end{eqnarray}$$
 $$\begin{eqnarray}\displaystyle & \displaystyle d=|\boldsymbol{x}_{h}-\boldsymbol{x}_{v}|=\frac{\unicode[STIX]{x1D6FC}(\unicode[STIX]{x1D6FC}-1)}{(1+\unicode[STIX]{x1D6FC})(\unicode[STIX]{x1D6FC}^{2}-\unicode[STIX]{x1D6FC}+1)}L & \displaystyle\end{eqnarray}$$
by using the relation
 $|\boldsymbol{r}_{12}|=L$
. Figure 18(b) describes the relation between the two distances with changing radius ratio
 $1\leqslant \unicode[STIX]{x1D6FC}\leqslant 2$
. Since the distances satisfy the relations
 $$\begin{eqnarray}\displaystyle & \displaystyle \lim _{\unicode[STIX]{x1D6FC}\rightarrow 1}\frac{\unicode[STIX]{x1D712}}{d}=\lim _{\unicode[STIX]{x1D6FC}\rightarrow 1}\frac{\unicode[STIX]{x1D6FC}}{1+\unicode[STIX]{x1D6FC}^{2}}=\frac{1}{2}, & \displaystyle\end{eqnarray}$$
 $$\begin{eqnarray}\displaystyle & \displaystyle \lim _{\unicode[STIX]{x1D6FC}\rightarrow 1}\frac{\text{d}}{\text{d}\unicode[STIX]{x1D6FC}}\left(\frac{\unicode[STIX]{x1D712}}{d}\right)=\lim _{\unicode[STIX]{x1D6FC}\rightarrow 1}\frac{1-\unicode[STIX]{x1D6FC}^{2}}{(1+\unicode[STIX]{x1D6FC}^{2})^{2}}=0, & \displaystyle\end{eqnarray}$$
there is a linearity between
 $\unicode[STIX]{x1D712}$
and
 $d$
when
 $\unicode[STIX]{x1D6FC}\approx 1$
, which is also shown in the figure.
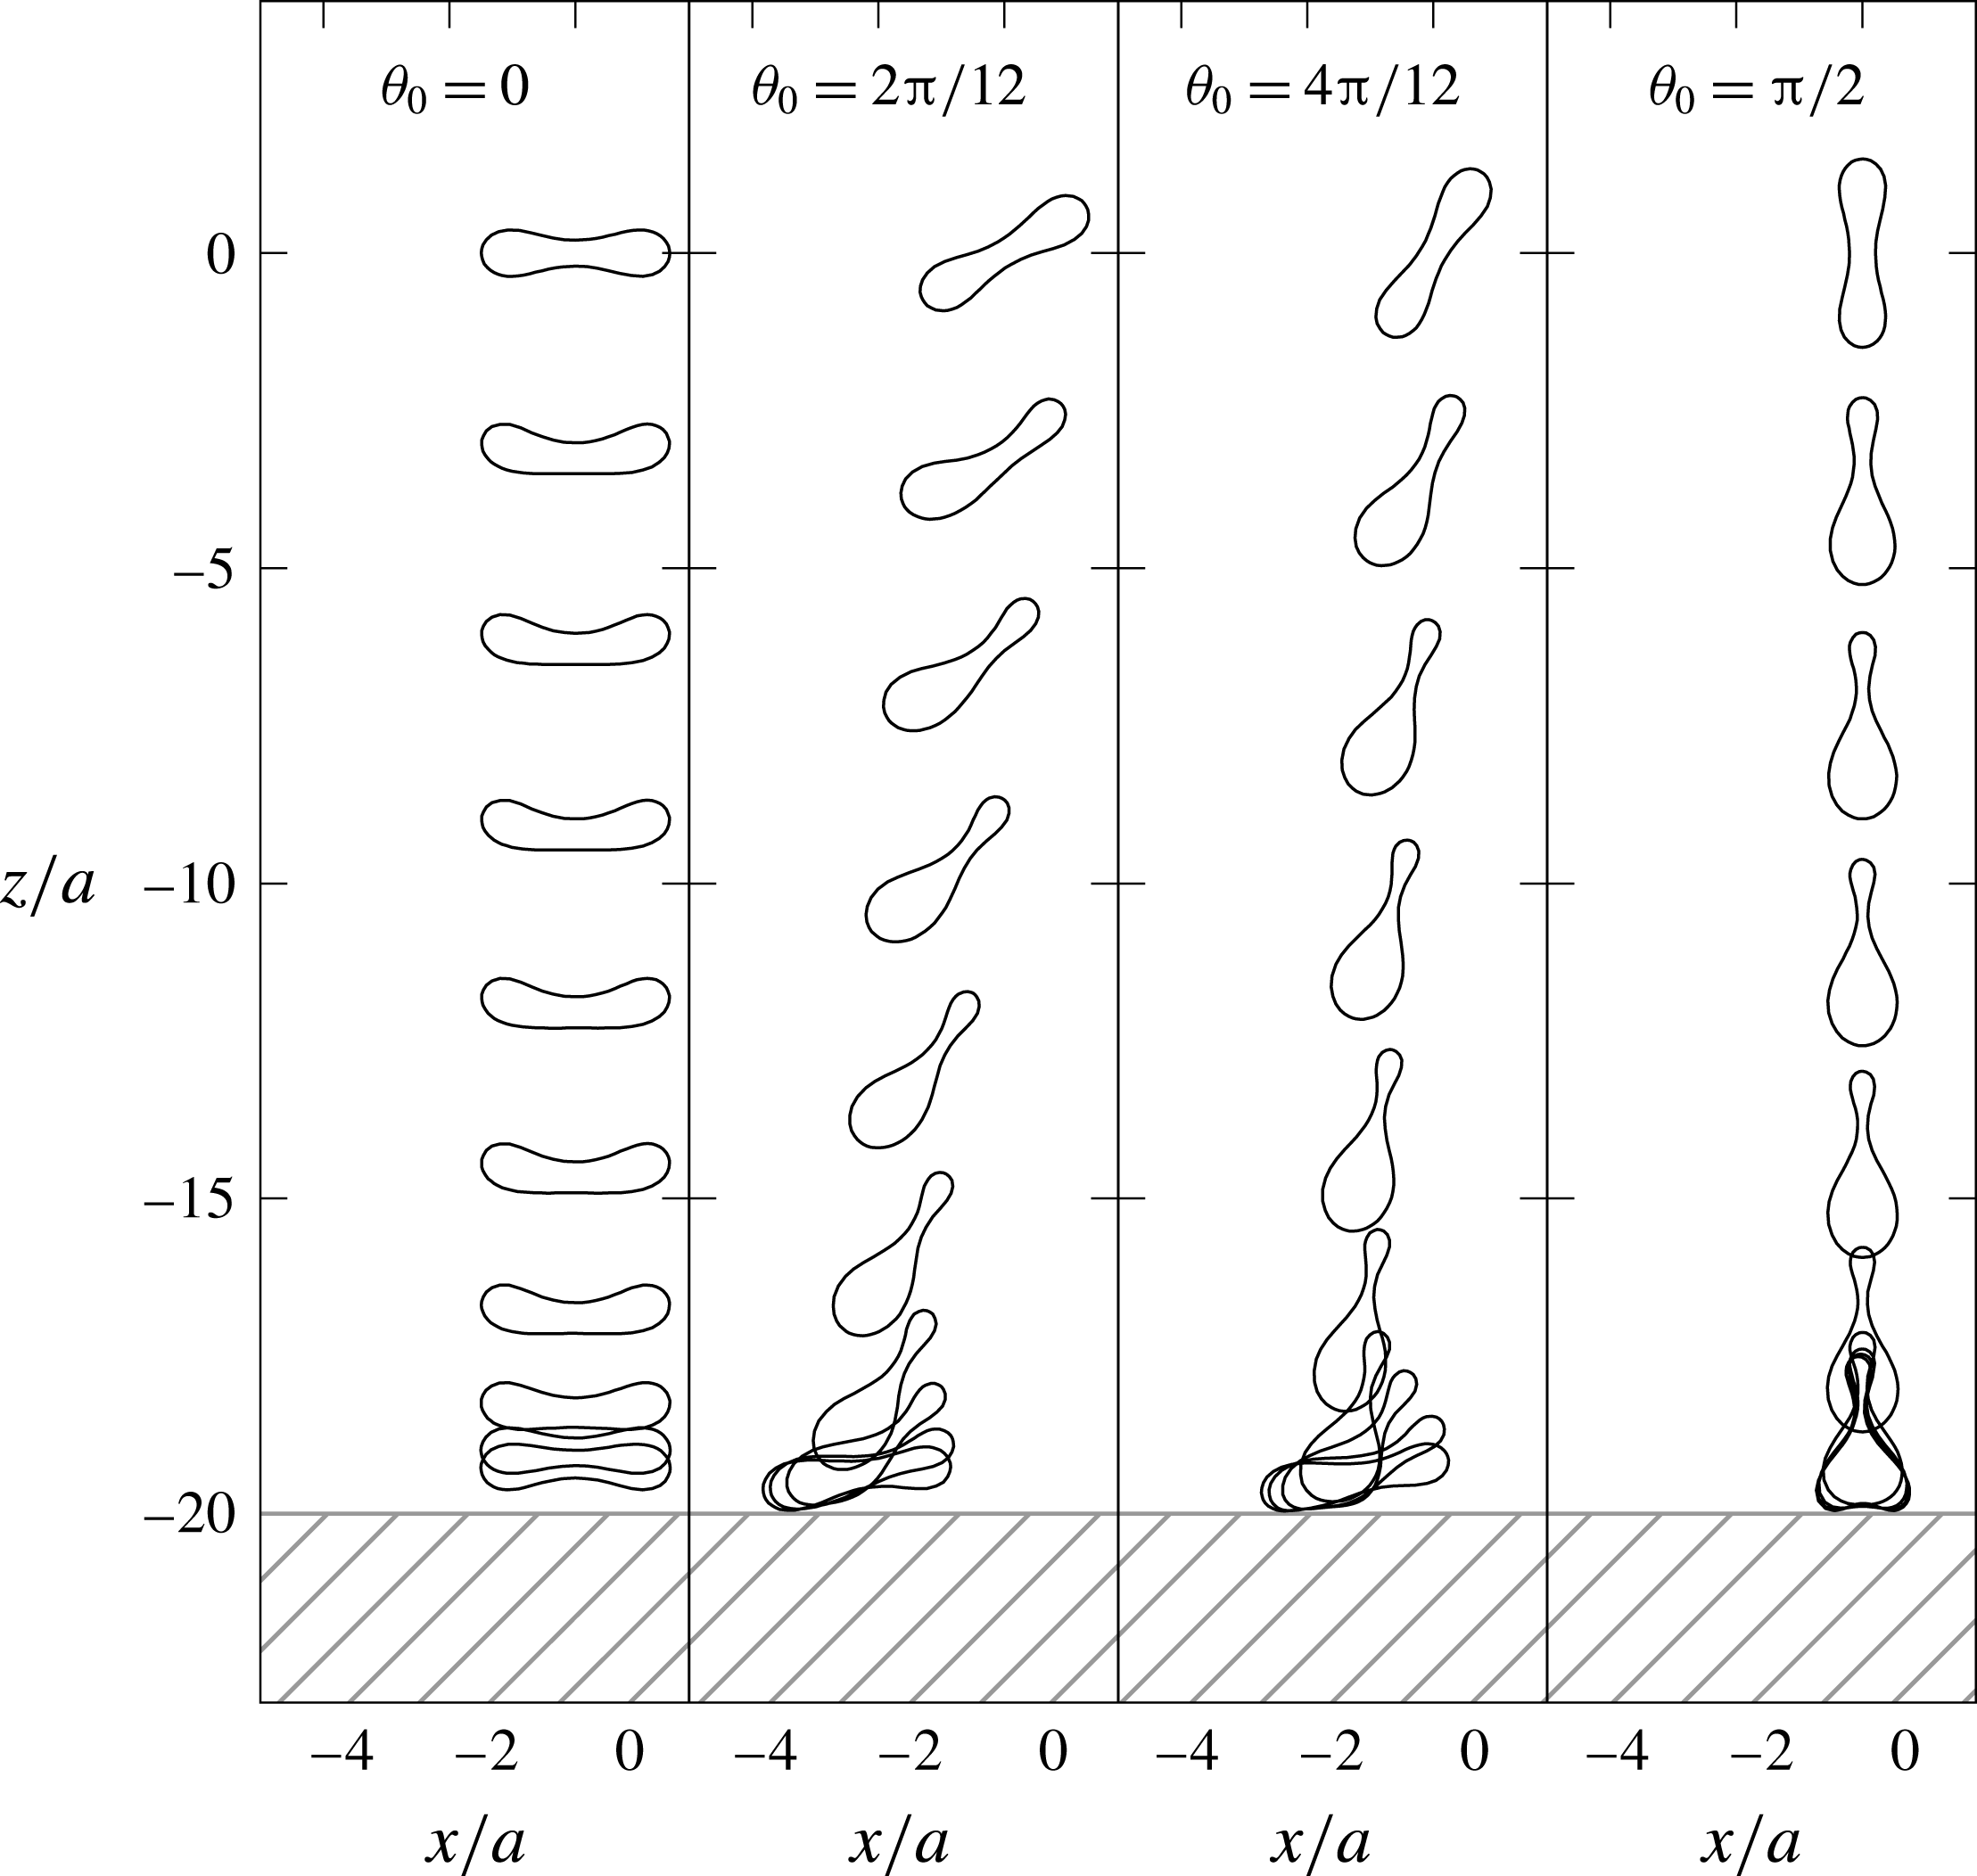
Cross-sectional view of red blood cells settling toward an infinite planar wall at
 $z/a=-20$
. Initial position of the cells are placed at
 $z/a=0$
, and shapes of the cells are shown in intervals of
 $(a\unicode[STIX]{x0394}\unicode[STIX]{x1D70C}g)t/\unicode[STIX]{x1D707}=10$
until reaching
 $200$
. The viscosity ratio
 $\unicode[STIX]{x1D706}=1$
and the Bond number
 $Bo=2.5\times 10^{-1}$
are utilized.

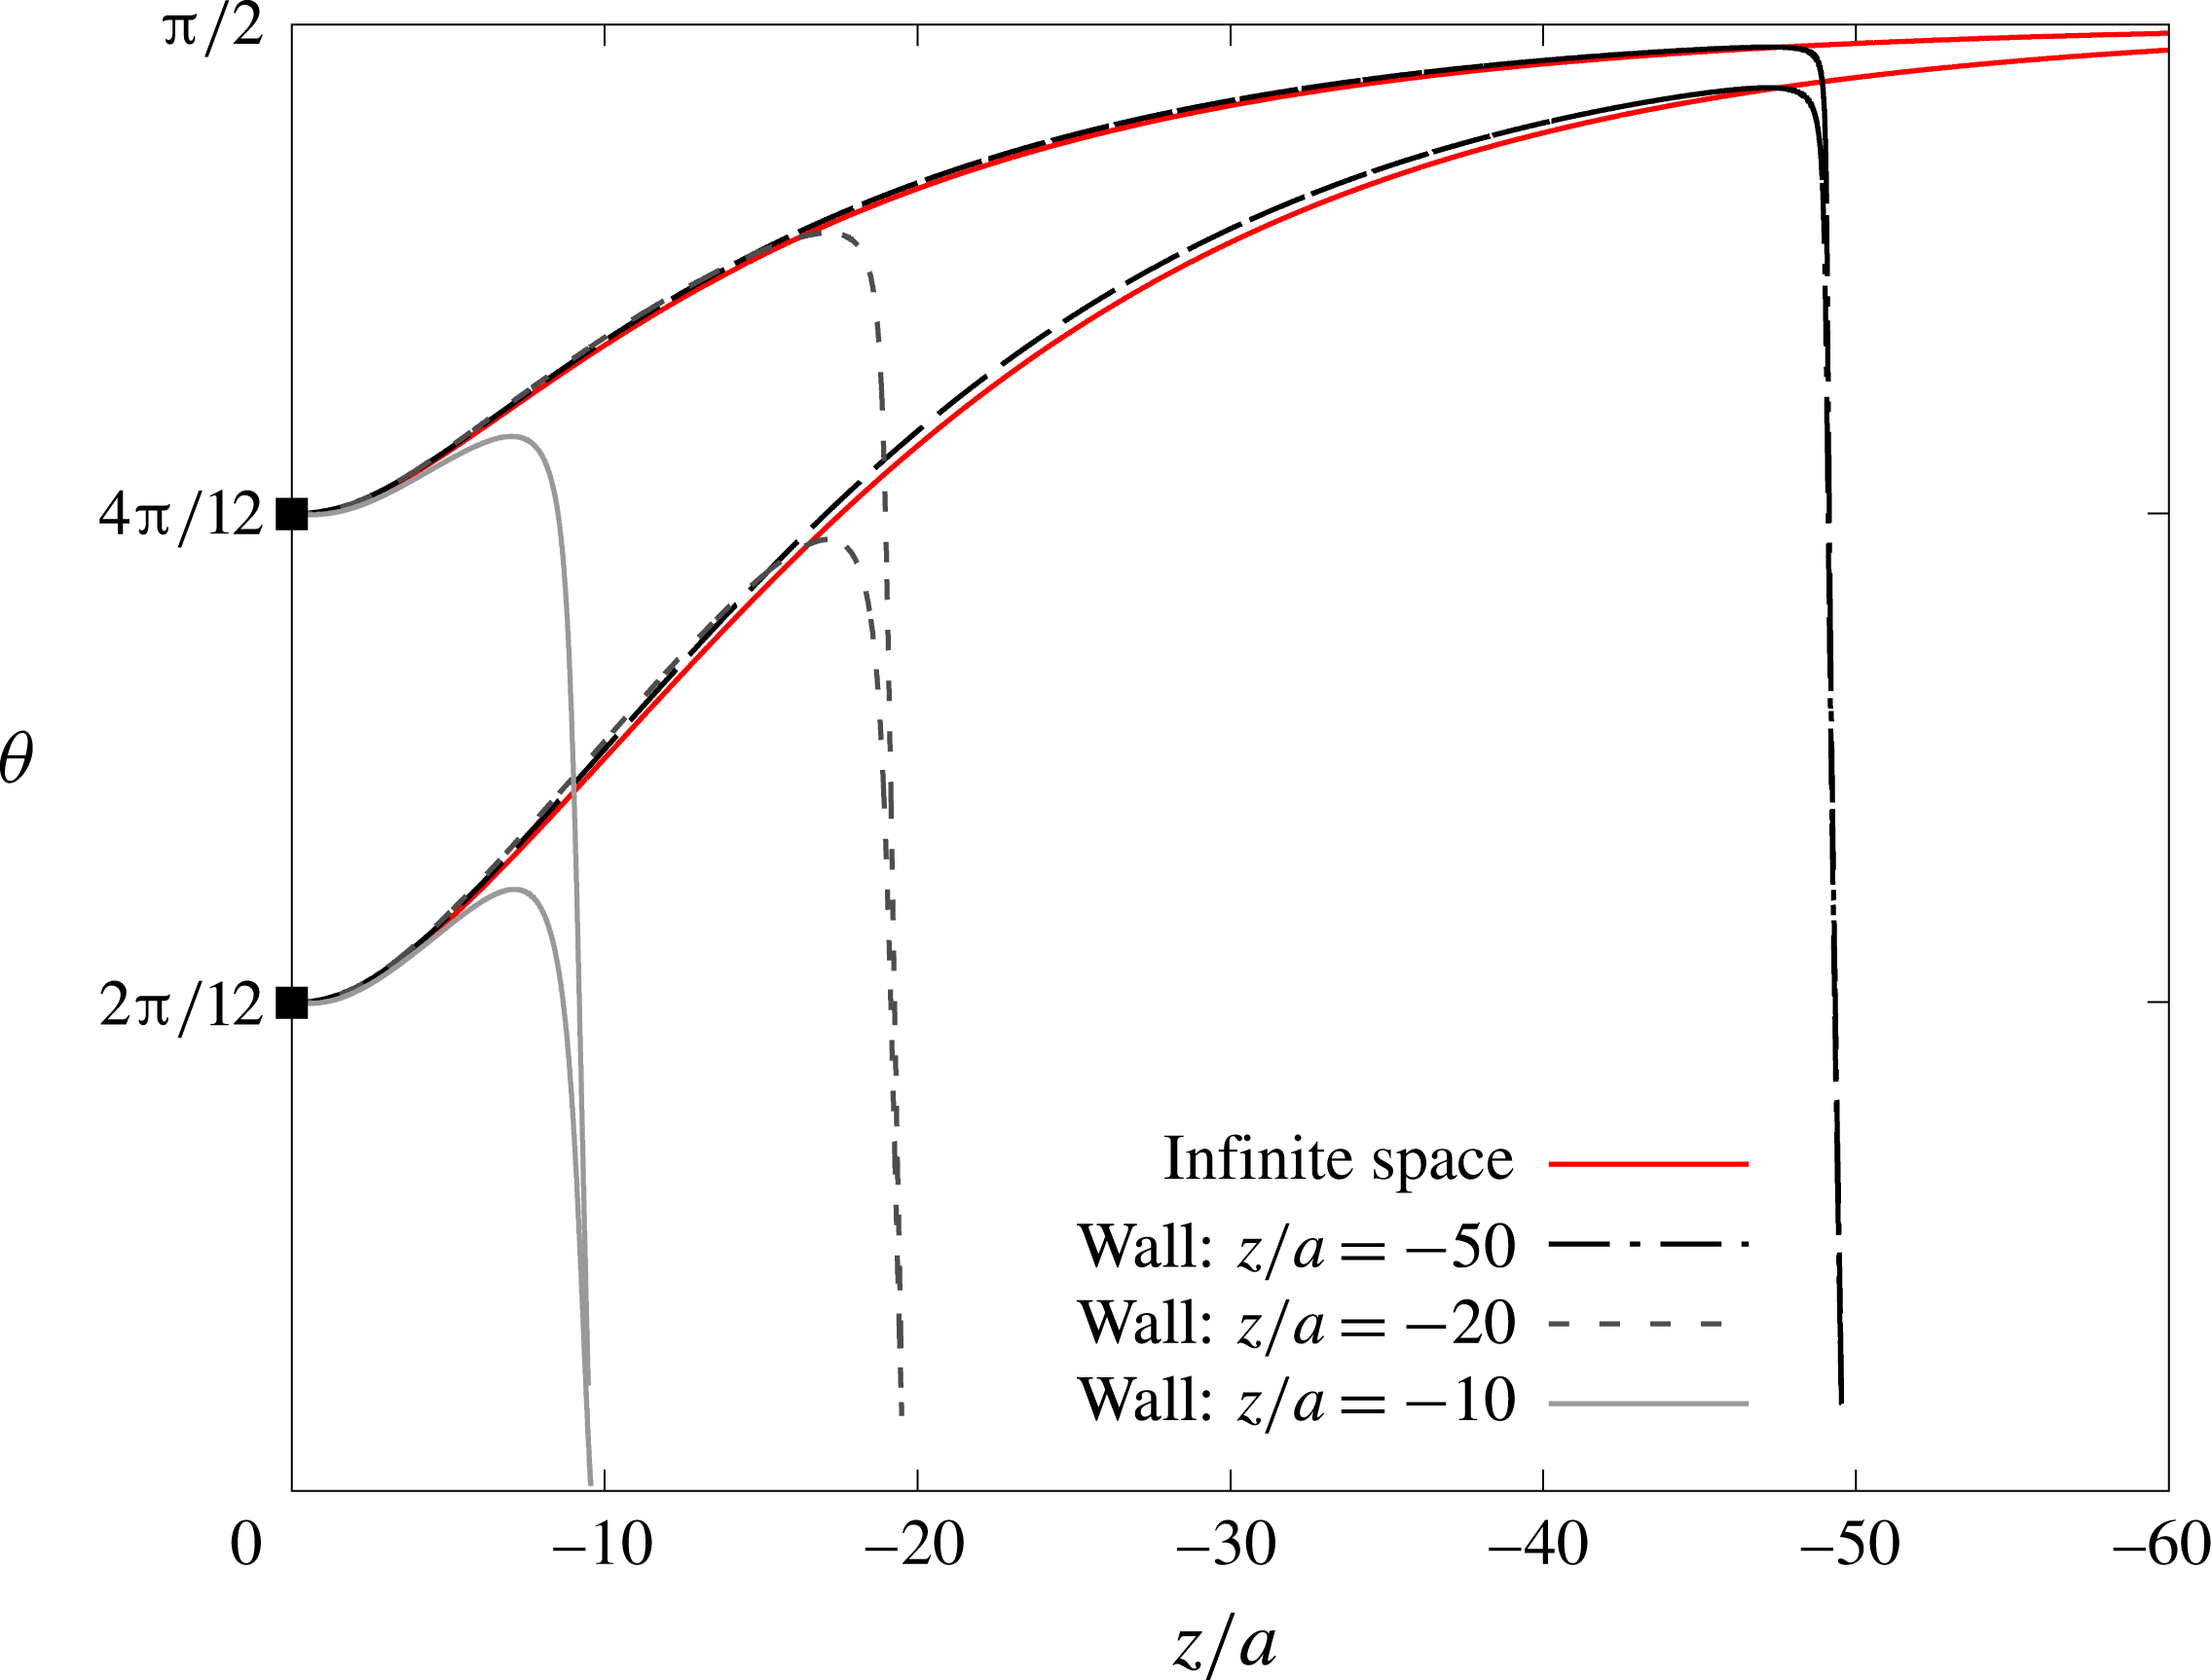
Orientation angle
 $\unicode[STIX]{x1D703}$
of a red blood cell that is settling toward a wall, which is placed at
 $z/a=-10,-20$
and
 $-50$
. Horizontal axis shows the cell position in
 $z$
-axis, and filled squared plots at
 $z/a=0$
correspond to initial states. Red curves express the result of settling under infinite space.

Appendix C. Effect of bottom wall
In order to evaluate the effect of a bottom wall, we simulate settling cells that are approaching a horizontal wall. Note that the image system (Blake Reference Blake1971) is utilized to take into account the effect of the infinite planar wall. Implementation of the wall is described in detail in our previous work (Nix et al. Reference Nix, Imai, Matsunaga, Yamaguchi and Ishikawa2014). The simulations are terminated when the minimum distance between the original cell and the image system becomes closer than the mesh size.
Figure 19 shows the time history of the cell orientations. Though the cells with initial angles
 $\unicode[STIX]{x1D703}_{0}=2\unicode[STIX]{x03C0}/12$
and
 $4\unicode[STIX]{x03C0}/12$
start to reorient toward angle
 $\unicode[STIX]{x1D703}=\unicode[STIX]{x03C0}/2$
at the beginning, they flip the direction of the rotation when they approach near the wall. Except the case for the initial angle
 $\unicode[STIX]{x1D703}_{0}=\unicode[STIX]{x03C0}/2$
, cells land on the wall with the angle
 $\unicode[STIX]{x1D703}\approx 0$
at the end. Figure 20 shows the change in orientation angle
 $\unicode[STIX]{x1D703}$
as a function of settling distance
 $z/a$
. Compared with the settling under infinite space, presence of the wall affects the orientation angle greatly when the distance between cell and wall is less than
 $10a$
. Therefore, our conclusion of reorientation to
 $\unicode[STIX]{x1D703}=\unicode[STIX]{x03C0}/2$
would be altered when the cell is in the vicinity of the bottom wall.