

Introduction
Chemical communication in insects is a process of primordial importance in reproduction and survival, both mating and the search for food depending on it. In fact, before reaching olfactory receptor neurons in the olfactory sensilla of insects, odorant molecules cross an aqueous interface in the sensillar lymph (Pelosi, Reference Pelosi1996). In so-called perireceptor events, two different classes of soluble polypeptides have been identified in the lymph of insect chemosensilla: odorant-binding proteins (OBPs) and chemosensory proteins (CSPs). The former are the main proteins involved in the interaction between odorants and the elements of the sensillar lymph. CSPs are mainly expressed in the lymph of chemosensilla and exhibit binding activity towards odorants and pheromones (Pelosi et al., Reference Pelosi, Zhou, Ban and Calvello2006). From the annotated genome of the Western honeybee Apis mellifera, 21 genes encoding OBPs (Forrêt and Maleszka, 2006) and 6 genes encoding CSPs (Forrêt et al., 2007) have been characterized in expressional profiling in diverse tissues and development stages in the antennae, ovaries and embryos of A. mellifera using bioinformatics and experimental approaches. The Asian honey bee, Apis cerana cerana Fabricius (Hymenoptera: Apidae), has economic importance as an indigenous species, with about two million colonies being kept in China (Chen, Reference Chen2001), and has several unique characteristics different from A. mellifera. Its one putative OBP gene, Ac-ASP2 (Li et al., Reference Li, Zhang, Gao, Cheng and Lou2008), and one CSP gene, Ac-ASP3 (Li et al., Reference Li, Lou, Cheng and Gao2007), have been identified through molecular cloning and immunocytochemical localization; however, both genes required further identification of their spatio-temporal expression profiles in chemosensory tissues to establish their hypothesized roles in chemical communication.
The method of real-time PCR has been widely applied to the detection of insectile pathogenic animalcules, such as honeybee viruses in Varroa mites on A. mellifera (Chantawannakul et al., Reference Chantawannakul, Ward, Boonham and Brown2006) and deformed wing virus and Black queen cell virus in the honeybee A. mellifera (Kukielka et al., Reference Kukielka, Esperon, Higes and Sanchez-Vizcaino2008). In addition, gene expression has been detected in the honeybee brain following caffeine treatment (Kucharski and Maleszka, Reference Kucharski and Maleszka2005) and the first Na+/H+ antiporter quantified from Anopheles gambiae (Rheault et al., Reference Rheault, Okech and Keen2007). In this study, we demonstrate the spatio-temporal expression profiles of both genes, encoding OBPs and CSPs in the chemosensory communication of A. cerana cerana, using SYBR Green I fluorescent dyes, based on the 2−ΔΔCt method and standard curve analysis.
Methods and materials
Insects
Larval, pupal and adult workers from A. cerana cerana colonies were bred at the Experimental Apiary at Zhejiang University, Hangzhou, China. Bees of known ages were identified by marking newly emerged bees from a frame of capped broods kept in an incubator, with the bees being returned to the hive and collected when required. The developmental stages of workers were classified according to description (Rachinsky et al., Reference Rachinsky, Strambi, Strambi and Hartfelder1990; Michelette and Soares, Reference Michelette and Soares1993). For spatial expression profiling, antennae (A), head (H), thorax (Th), abdomen (Ab), wings (W) and legs (L) from 50 adult worker bees were prepared. For expression profiling across different ages of worker bees, 7-day-old larvae and pupae, and 20 antennae from 1-, 4-, 6-, 9-, 12-, 15-, 18-, 21-, 24-, 27- and 30-day-old adult worker bees were prepared.
RNA isolation and cDNA synthesis of antennae of different day ages and tissues from A. cerana cerana
Total RNA was isolated from 100 antennae of A. cerana cerana adult worker bees using Trizol reagent (Invitrogen). cDNA was synthesized using a Super-Script™ II Reverse Transcriptase system (Invitrogen).
Preparation of plasmid standard
Recombinant plasmid containing Ac-ASP3 (Li et al., Reference Li, Lou, Cheng and Gao2007) was cloned into pGEM-T vector (Promega) with Escherichia coli TG-1 from an earlier study. The single colony and Ac-ASP3 were inoculated in LB medium and incubated at 37°C overnight while being shaken (at 180 rpm). After isolation using the method of alkaline lysis, the quality of recombinant plasmid DNA from Ac-ASP3 was determined using an ultraviolet–visible (UV) spectroscopy instrument, and the copy number units of Ac-ASP3 calculated from the nuclear acid length of the plasmids. Finally, the standard curve was constructed through the seven-dilution-gradient concentration method (10−8, 10−7, 10−6, 10−5, 10−4, 10−3 and 10−2 times the original concentration of plasmids).
Primers designed for real-time PCR
Specific primer pairs were designed based on the sequences of Ac-ASP2 (GenBank accession no. DQ449670) (Li et al., Reference Li, Zhang, Gao, Cheng and Lou2008) and Ac-ASP3 (GenBank accession no. DQ449669) (Table 1) to test integrity by amplification. For real-time quantitative reverse-transcriptase PCR (RT-PCR), the specific primers for A. cerana β-actin (GenBank accession no. AB072495) were designed such that the paired primers (Table 1) were expected to amplify a 424-bp fragment.
The primer pairs used for real-time PCR of chemical communication genes of A. cerana cerana

Spatio-temporal expression analysis by real-time PCR
The total 20 μl reaction system consisted of 1 μl plasmid standard DNA of Ac-ASP2 and Ac-ASP3, or 1 μl cDNA (~20 ng) from the antennae of different day age and different tissue of A. cerana cerana, 10 μl iQ™ SYBR® Green Supermix (Bio-Rad Laboratories) and 10 μM of each primer (Table 1). The thermal cycling conditions for real-time PCR were pre-determined at 95°C for 5 min, followed by 45 cycles of 94°C for 30 s, X °C (the T m (melting temperature) value for the primers) for 30 s and 72°C for 40 s, followed by an extension phase at 72°C for 5 min. The melting temperature was increasing at a rate of 0.5°C every 10 s from X °C to 95°C, and the melting curve was recorded at the same time. The maximum emission wavelength of the fluorescence dye was 490 nm.
Data analysis of real-time PCR
The prepared plasmid standard and standard curve of Ac-ASP2 were calculated and analysed in order to determine the original copy number of Ac-ASP2 mRNA in spatio-temporal states of A. cerana cerana. For spatio-temporal transcriptional profiling of the Ac-ASP3 mRNA of A. cerana cerana, PCR reactions were performed in triplicate, and data were processed according to the cycle threshold value (Ct) with β-actin as positive control to corresponding samples obtained using the relative quantification 2−ΔΔCt method (Livak and Schmittgen, Reference Livak and Schmittgen2001).
Results
Spatio-temporal expression analysis of Ac-ASP2 in transcription
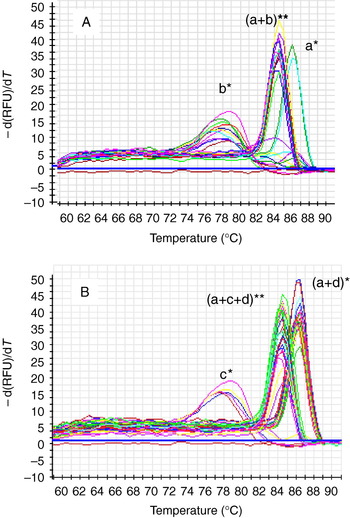
By means of the normalized relative quantification 2−ΔΔCt method (Livak and Schmittgen, Reference Livak and Schmittgen2001) for real-time PCR and using SYBR I, expression profiling of the tissue and development phases of Ac-ASP2 was obtained, with β-actin cDNA of A. cerana as control. From the melt curve graph (Fig. 1), it can be seen that the melting temperature of the positive control β-actin was ~84°C (Fig. 1A, (a+b)**; Fig. 1B, (a+c+d)**) and the amplified products were also unique, indicating that the amplifying condition was appropriate. From the distribution of Ac-ASP2 in the different tissues, the melting temperature for the unique amplified products was ~86°C, indicating that transcripts were only particularly expressed on antennae (Fig. 1A, a*, Fig. 1B, (a+d)*), and never on other tissues (Fig. 1A, b*) and larvae and pupae (Fig. 1B, c*) without the unique products.
Melt curve graph of Ac-ASP2 expression in tissues and development phases obtained from real-time PCR. *Ac-ASP2; **β-actin; a, antenna; b, thorax, abdomen, wings and legs; c, larvae and pupae; d, Development stages at 1, 4, 6, 9, 12, 15, 18, 21, 24, 27 and 30 d. (See online for a colour version of this figure.)

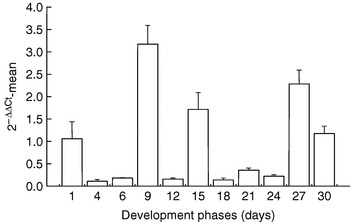
However, the results of the temporal expression analysis indicate two ages at which expression was relatively high (Fig. 2). High expression was found in adults at 9 days and 15 days (but not at 12 days, which shows lower expression than most other days) and also in adults at 27 days and 30 days (relative quantification was a little lower than the first higher period). Transcript level was calculated based on the difference in cycle threshold (Ct) values between Ac-ASP2 and β-actin transcripts.
Transcription profiles in development phases of Ac-ASP2.

Spatio-temporal expression analysis of Ac-ASP3 in transcription
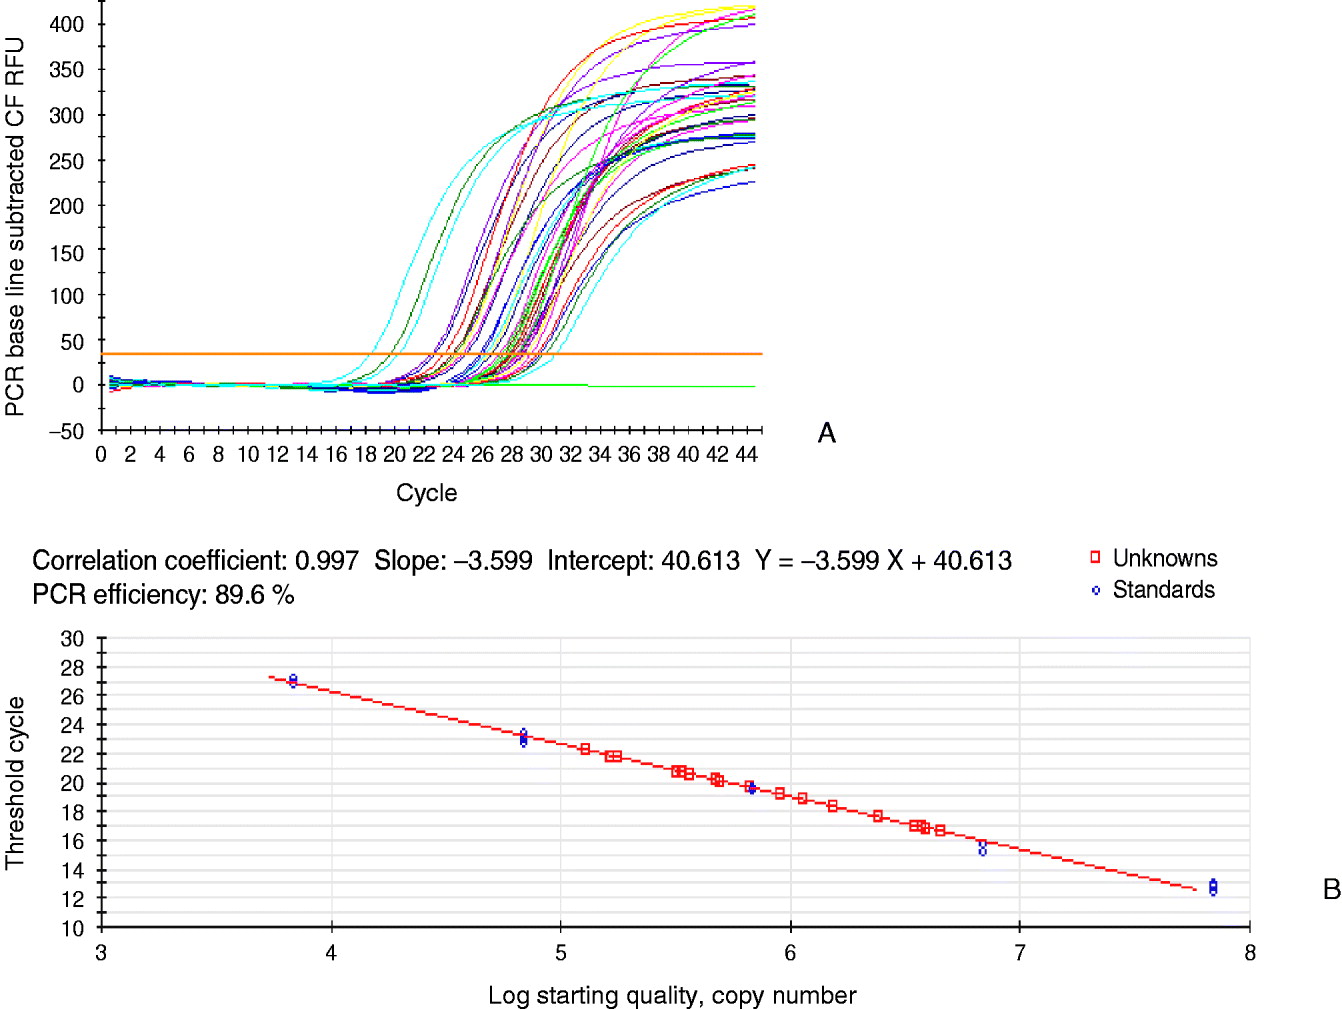
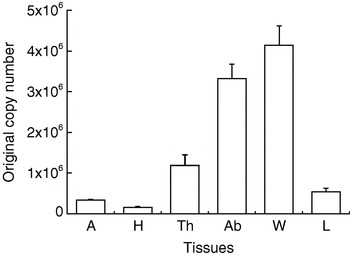
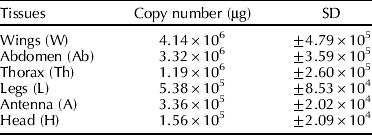
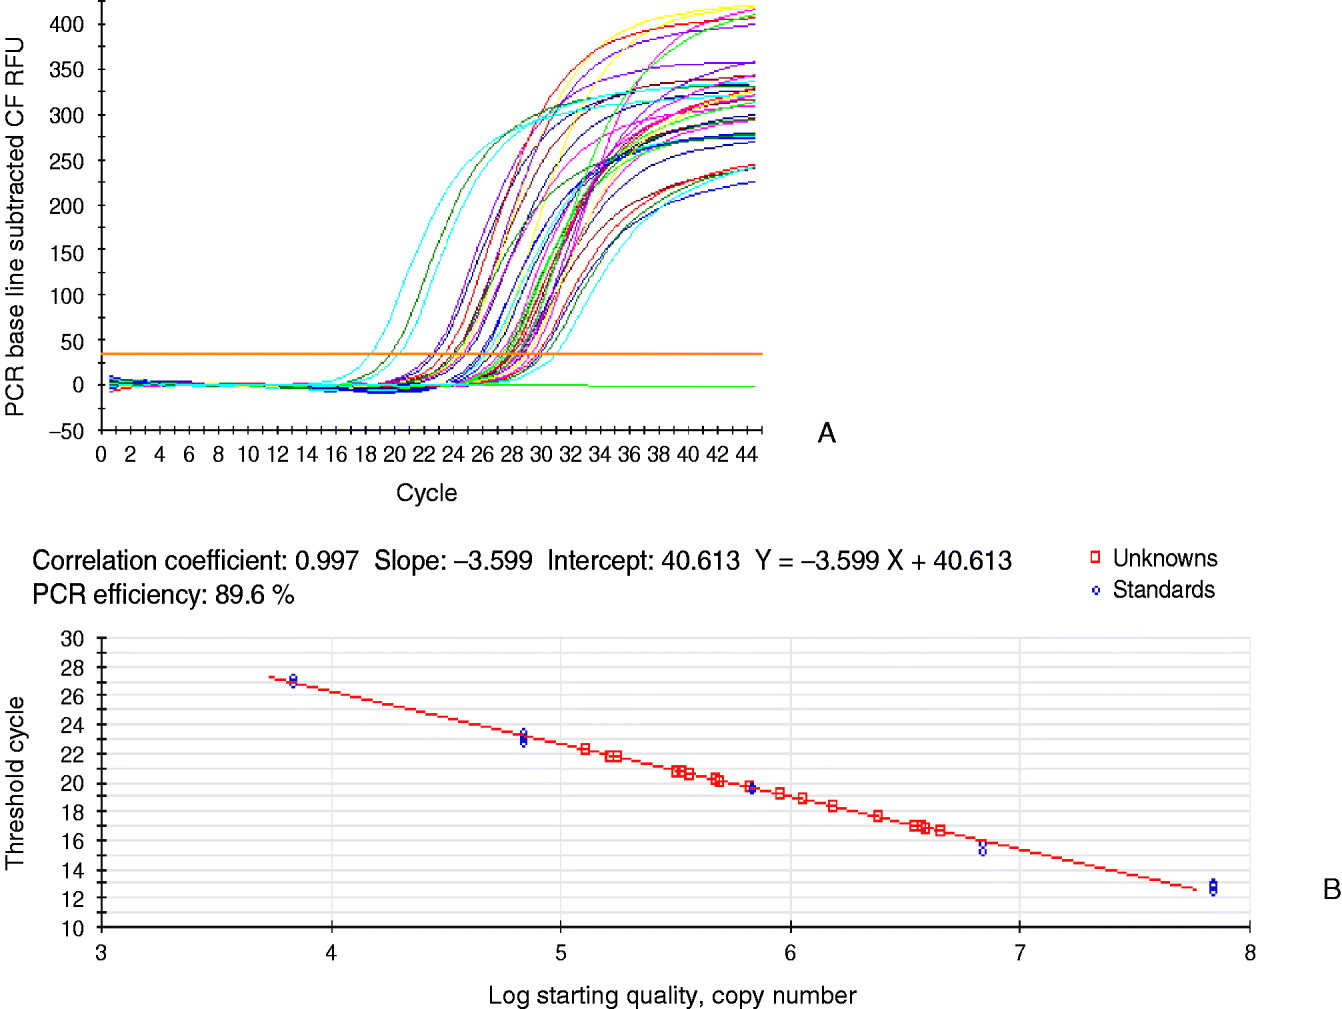
By means of the absolute quantification method using the standard curve for real-time PCR with SYBR Green I, expression profiling in different tissues and development phases of Ac-ASP3 was obtained using β-actin cDNA of A. cerana as control. From the amplification curve, the quality of the real-time PCR is seen to be fine (Fig. 3A), and the standard curve was constructed using the five-dilution-gradient concentration method (10−8, 10−7, 10−6, 10−5 and 10−4 of the original concentration of the plasmids) (the blue circle indicates ‘standards’ in Fig. 3B), with the final concentration of target products mainly distributed from 10−7 to 10−5 (the red square indicates ‘unknowns’ in Fig. 3B). After calculating the data for the standard curve, the results indicate that the original copy number per microgram of transcripts of Ac-ASP3 appears to be higher for the wings (4.14×10⁶±4.79×10⁵) and abdomen (3.32×10⁶±3.59×10⁵), lower on the thorax (1.19×10⁶±2.60×10⁵) and legs (5.38×10⁵±8.53×10⁴), and lowest on the antennae (3.36×10⁵±2.02×10⁴) and head (1.56×10⁵±2.09×10⁴) (Table 2 and Fig. 4).
Amplification graph (A) and standard curve (B) of real-time PCR of Ac-ASP3. (See online for a colour version of this figure.)
Transcription profiles of Ac-ASP3 in organs. A, antennae; H, head; Th, thorax; Ab, abdomen; W, wings; L, legs.

Original copy number of Ac-ASP3 in tissues
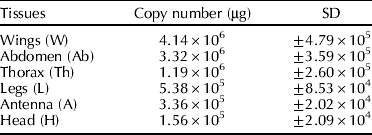
SD, standard deviation.
Discussion
Using real-time PCR, we identified spatio-temporal expression profiles for two genes, Ac-ASP2 and Ac-ASP3, active in chemosensory communication in A. cerana cerana. From expression profiles in different tissues, it was found that there were only two single peaks in the melting curve for Ac-ASP2 (only in antennae, Fig. 1A, a*; Fig. 1B, a+d*) and β-actin (in all tissues, Fig. 1A, (a+b)**), showing particular expression in antennae (Fig. 1A, a*) and not in other tissues (Fig. 1A, b*) or larvae and pupae (Fig. 1B, c*). The results demonstrate that Ac-ASP2 is a gene that encodes antenna special proteins (ASPs), and it is linked to olfactory recognition in chemical communication in the antennae, these being the main olfactory organs in A. cerana cerana. The developmental and temporal expression profiles (Fig. 2) show that transcript amounts of Ac-ASP2 were expressed at high levels at 1, 9, 15, 27 and 30 days.
Because the expression ratios during these periods are generally at least ten times greater than those of the other periods, Ac-ASP2 may play an important functional role in adults during these periods. At the 9 day point, worker bees are making the transition to maturation and are starting to secrete large amounts of beeswax to construct their comb (Yang, Reference Yang1998). At about 15 days, maturing bees begin to fly out and forage for nectar and pollen, and the highest level of foraging activity occurs around the 27–30 day point. However, it is still puzzling that there are lower transcript amounts in the intervening periods of 18, 21, and 24 days. In any event, the results suggest that Ac-ASP2 may play an important role in the processes of producing beeswax and acquiring the odorant molecules related to foraging for nectar and pollen, or other general odorants. In summary, all the results above indicate that Ac-ASP2 might be an odorant-related gene in chemical communication with specific expression in the antennae.
Another gene participating in chemical communication, Ac-ASP3, has transcript amounts that seem to be higher in the wings and legs, lower in the antennae, and lowest on the thorax, head and abdomen in different tissues of A. cerana cerana, as derived from the normalized relative quantification 2−ΔΔCt method (Li et al., Reference Li, Lou, Cheng and Gao2007). In the present study, we found some variation in the results in that the original copy number per microgram for Ac-ASP3 was higher in the wings (4.14×10⁶±4.79×10⁵) and abdomen (3.32×10⁶±3.59×10⁵), lower in the thorax (1.19×10⁶±2.60×10⁵) and legs (5.38×10⁵±8.53×10⁴), and lowest in the antennae (3.36×10⁵±2.02×10⁴) and head (1.56×10⁵±2.09×10⁴) (Table 2 and Fig. 4). From the two methods, the results show that Ac-ASP3 had the highest expression in the wings and lowest in the head, suggesting that Ac-ASP3 plays an important role in chemosensory behaviour in the wings of A. cerana cerana. However, the diversity in the two methods is clear in that Ac-ASP3 appears to be expressed more highly in the thorax and lower in the legs and antennae according to the original copy number obtained from the absolute quantification method (original copy number per microgram), but lower in the thorax and higher in the legs and antennae according to the relative quantification method. So, the expression profiles of Ac-ASP3 in different tissues should be demonstrated using a combination of approaches: if considering the copy number of transcript amounts of RNA units, we should use the method of absolute quantification, but if considering diversity in different tissues, we should use the method of relative quantification.
The technology of real-time PCR is mainly applied to the analysis of the original copy number or expression profiles of the target gene, using the cycle threshold (Ct) value and the standard curve from the amplification. To calibrate the quantification results of real-time PCR, a ‘house gene’ such as the β-actin gene is generally applied as a positive control to allow for variables in the sample treatment process, such as extraction of total RNA, reverse transcription of mRNA, and so on. In this article, the spatio-temporal expression analysis of two kinds of chemical communication-related protein genes, Ac-ASP2 and Ac-ASP3 in the worker bee of A. cerana cerana, has been demonstrated using the absolute quantification method and relative quantification method, respectively. The two methods should be correctly applied to the different studies of expression profiles, and also to account for the possibility of error in the experiment.
Acknowledgements
We are grateful to Prof. Chen Sheng-lu and Dr Su Song-kun at Zhejiang University for their help in bee breeding. This work was supported by the Natural Science Foundation of Zhejiang (Y307597) and the National Natural Science Foundation of China (30270896 and 30900163).