Introduction
In recent years, the adoption of new technologies in agriculture has been enabling remarkable advancements in crop productivity. This trend will have to continue into the future if we want to feed a rapidly increasing global population (nine billion by 2050 following FAO estimation in 2012). These technologies rely on the acquisition of information through remote and proximal sensing. While remote sensing can offer great possibilities, results are expensive when applied to small acreage farms, requires intense post-acquisition processing (where human errors increase) and suffer from more environmental interferences. Therefore, an increasing number of precision agricultural machinery nowadays operate in the proximal sensing mode while using mainly optical sensors. Some applications combine proximal and remote sensing data as with soil characteristics assessment (Aldabaa et al., Reference Aldabaa, Weindorf, Chakraborty, Sharma and Li2015) but appear even more complex to manage for end users. Additionally, proximal sensing mainly uses sensors that integrate an area returning a single joined value often in a fast and efficient manner. In this context imaging techniques have enjoyed minor consideration due to the complexity of data analysis, to the increased cost associated with the high computational burden (increased computing power) needed to process data and to the use of more complex optical devices. Conversely, imaging techniques offer greater flexibility, resulting in a wide range of applications (Saxena and Armstrong, Reference Saxena and Armstrong2014). One such application involves machine operation and positioning with regards to crops without the use of Global Navigation Satellite System (GNSS).
Greater use of precision agriculture (PA) services has been occurring internationally on large-scale farms while in Italy the average farm size tend to be small and therefore less prone to the implementation of PA applications. Among the factors affecting the adoption of precision agriculture technologies farm size has been identified as one of the key drivers (Pierpaoli et al., Reference Pierpaoli, Carli, Pignatti and Canavari2013). In general, the farm machinery fleet is characterised by a high number (1,700,000) of obsolete tractors.
In light of this scenario, the present preliminary report tests a pilot imaging retrofit system. This could be applied independently on a wide range of agricultural machines to test different monitoring or control image-based applications for precision agriculture. The system, currently equipped with an RGB camera, was tested using clustering and shape analysis algorithms and applied to in-field discrimination of weeds within lettuce and broccoli crops for intra-row hoeing. Indeed, different studies are being carried out with the aid of image analysis techniques (Gerhards et al., Reference Gerhards, Sökefeld, Peteinatos, Nabout, Maier and Risser2016; Young et al., Reference Young, Meyer and Woldt2014; Weis et al., 2007) since site-specific mechanical weed control techniques have been gaining interest over the last years making it possible to reduce or avoid altogether use of pesticides.
Materials and methods
The main steps of development and testing of the optoelectronic system can be summarized as follows:
-
∙ design and development of the system and acquisition testing in laboratory;
-
∙ field trials preparation;
-
∙ preliminary field testing (image acquisition);
-
∙ algorithm selection and coding based on the recorded data (actual step);
-
∙ streamlining code for real-time application (under development);
-
∙ actuator control and machine testing (future action).
An initial project phase concerned the choice of the sensor to be equipped, for the purpose, different types of sensors have been taken into consideration, such as spectral, RGB and black & white sensors. The choice fell on an RGB CCD sensor because of its flexibility of use and low price in relation to the information acquired. Instead, Vis-NIR matrix sensors were disregarded because too expensive and black & white sensors because limited for use in morphologic shape analysis, thus offering lower applicative possibilities when compared to colour imaging.
The camera was selected for cost effectiveness with respect to the performance needed. We selected an Allied Vision Mako G-125C RGB camera (Allied Vision Technologies GmbH, Stadtroda, Germany). This is an industrial GigE camera equipped with Sony’s ICX445 CCD sensor with EXview HAD technology, an ultra-compact design, affordable price, 30.3 fps (frames per second) at full resolution including Power over Ethernet (PoE), three opto-isolated outputs and a 64 MByte image buffer. The camera (c-mount) was equipped with a 28 mm lens with F/1.4 max aperture. Its cost is around ~500 €.
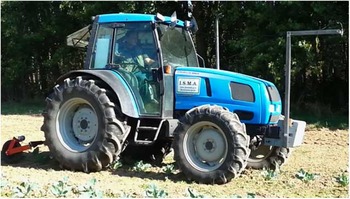
The camera was mounted on the front of a metal frame at ~2 m from the ground and synchronised with a Peiseler wheel (custom made) provided with encoder as visible in Figure 1 obtaining a FOV of 1.5×2.0 m (h x w). The synchronization was achieved using dedicated multi-threading Java software running on a PC. The software, with respect to encoder management, was interfaced with an open-source Arduino™ (Ivrea, Italy) microcontroller that was specifically programmed and configured for this project. Furthermore, it also manages the acquisition according to the encoder pulses elaborating them into spatial ones. The images were acquired every 150 pulses per wheel revolution. A small spatial overlap between two consecutive pictures (~10 cm) was calculated for the acquisition in order to avoid data loss and better recognize the plants. Arduino™ was programmed in C/C++. The control system (microcontroller and pc) for testing was placed in the cab of a Landini Globus 80 tractor (Landini ARGO TRACTORS S.p.A., Fabbrico, Italy). The image elaboration procedures were all developed in MATLAB.
Tractor assembly in field trials: the acquisition system placed in the cabin; a camera mounted on a front frame and a rear-mounted Peiseler wheel provided with encoder.

Prior to testing, the soil was tilled and lettuce and broccoli were planted along 100 m long rows, in double row arrangement (40 cm inter-row spacing), 6 rows per crop. The image acquisition was repeated twice with a one week interval in order to observe weed growth and thus simulate different infestation pressure levels of weeds. This will also add lighting variability to the scene to increase the robustness of the whole process. Moreover, the tests were carried out at the driving speed of 1 and 3 km*h−1.
Once the images were acquired they were preliminary processed with the following steps:
-
∙ illumination correction for an increased uniformity;
-
∙ transformation of the colour coordinates from RGB to HSV since this colour space proved to be more effective for the purpose;
-
∙ extraction of the H (Hue) and S (Saturation) channels;
-
∙ filtering for noise reduction (e.g., low-band filter and morphological filters: erode & fill to avoid empty space within connected components).
These operations were then followed by two morphometric operations on the binarized images:
-
∙ selection on the basis of the area and of shape factors, that is the relationship between the main axes calculated once the centroid is determined (e.g. 0.75=elliptic shape, 1=perfect circle);
-
∙ classification;
-
∙ depending on the images, some additional operations may be required e.g. the program automatically rejects the object only partially included in the images.
Classification was achieved by thresholding with a k-NN clustering algorithm. This is a supervised clustering technique, used for pattern recognition, that classifies each pixel of the input image following the majority vote of its neighbours, with the pixel being assigned to the class most common among its k nearest neighbours (Pallottino et al., Reference Pallottino, Menesatti, Costa, Paglia, De Salvador and Lolletti2010; Menesatti et al., Reference Menesatti, Zanella, D’Andrea, Costa, Paglia and Pallottino2009) being in this case k=3. The neighbours are taken from a set of pixels (one per class) for which the correct classification was known (training set). The training set was built averaging the values of each colour channel of representative patches extracted from original images (30 for crops, weeds and soil, respectively).
Results and discussion
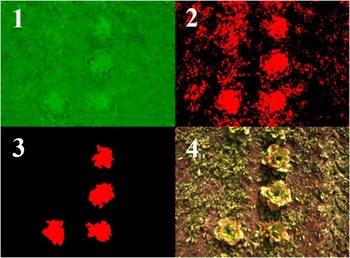
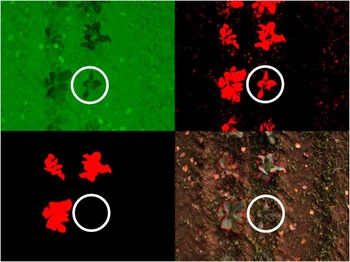
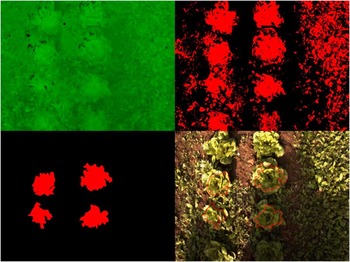
Non-supervised algorithms were preliminary tested in order to evaluate the efficiency in object classification. Those algorithms failed for different reasons, firstly because of the differences in ambient illumination conditions (data not shown), for example the sun’s elevation angle and the different shadows cast by the tractor on the ground. The selected k-NN gave instead, as shown in the Figures 2 to 4 reported below, good object recognition performances even in severe conditions. In this regards most of the commercially available optical automatic hoeing machines, such as e.g. the Steketee IC Weeder or the Ferrari Remoweed, rely on active illumination boxed systems placed near the ground with with increasing costs and specifically designed light emitters. Moreover, the light emission geometry makes these systems less flexible in comparison to the ones based on matrices sensors.
Image processing flow reporting conditions of severe infestation without any shadows and lettuce plants.

Image processing flow reporting conditions of medium infestation with some shadows and broccoli plants. The white circles indicate a misclassified plant of broccoli.

Image processing flow reporting conditions of severe infestation with strong shadows and broccoli plants.

The system set up scored the following operational times: initialization 0.063 s, training test 1.74 s, RGB (~1.3 MP) images opening in 2.88 s, k-NN processing 17.7 s, morphological extraction 0.48 s. At 3 km h−1 the delay between acquisition and the hoeing tools (5 m) is about 4.2 s. Code streamlining is currently under development to achieve real-time application, which in our opinion should allow a sufficient time shrinking to reach the target timing.
The quadrants in the following figures represent the above described image processing flow. The last one (4) represents the overlap of the original image with the selected crop object contour (3).
The white circles in Figure 3 represent a missed broccoli plant that, probably due to the partial shadow cast along the row and to its small size, was misclassified by the system as weed and thus not extracted. In real hoeing this will result in an economic loss for the farmer and needs to be taken into account when evaluating the system’s general performances.
Figure 4 shows a real condition of both severe shadows and infestation that underline the power of the k-NN clustering technique. Indeed, it is clearly visible how the shadows cast by the tractor on the ground create two distinct lighting conditions, similarly the weeds presence is diverse around each plant, however the system is able to cut the lettuce plant not completely present in the image and to correctly extract the remaining four. The drawback of this supervised technique is the need to make a training set per class as mentioned. However, this could be simplified providing the tractor cabin with a touchscreen for a rapid selection of the training set. To do so the operator should acquire few representative images before the hoeing operation.
Conclusion
This work shows preliminary results of the imaging retrofit system developed on lettuce and broccoli under real field conditions. The system was able to detect quite accurately the position of the crops, extracting the single plants from the soil and weeds. However, the system was not able to classify correctly all the crop plants, underlining the need to evaluate carefully the percentage of correct classification for a deep evaluation. Moreover, in order to make the system truly implementable the code streamlining should significantly cut the time needed for the acquisition and elaboration operations. Once ready the system, after calibration, could be mounted on different farm implements and/or be used for different crops/purposes.