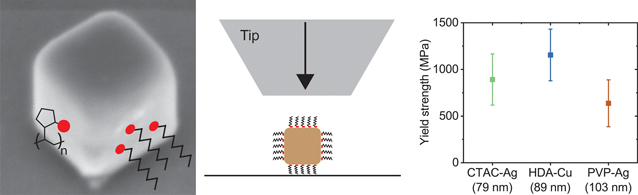
Dislocations are crystalline defects that determine the strength and mechanical behavior of metals. Dislocation motion and the interactions between dislocations and other defects are fairly well understood, but the thermal processes that govern dislocation nucleation remain mysterious.[Reference Shin, Chen, Sanli, Richter, Labat, Richard, Cornelius, Thomas and Gianola1,Reference Weinberger, Jennings, Kang and Greer2] Deformation in bulk materials involves dislocation motion and interactions with other defects, which make it challenging to isolate the materials' response due to dislocation nucleation. Deformation in defect-free nanostructures is dominated by dislocation nucleation rather than dislocation motion. Thus, nanostructures with low dislocation density are ideal for studying dislocation nucleation.[Reference Jeon, Yazdi, Thevamaran and Thomas3,Reference Greer, Kim and Burek4] Experimental studies and atomistic simulations on defect-free nanowires[Reference Richter, Hillerich, Gianola, Mönig, Kraft and Volkert5–Reference Rabkin and Srolovitz7] and single-crystalline nanoparticles[Reference Mordehai, Lee, Backes, Srolovitz, Nix and Rabkin8,Reference Han, Huang, Ogata, Kimizuka, Yang, Weinberger, Li, Liu, Zhang, Li, Ma and Shan9] show that defect-free nanostructures have extremely high yield strengths that approach theoretical limits. Yet, the atomistic mechanisms and probabilistic nature of dislocation nucleation, which results in scattered yield strengths for nominally identical nanostructures, are not well understood. It is necessary to observe dislocation nucleation in nanostructures with precise geometries and surfaces under well-controlled environmental conditions in order to isolate structural and thermodynamic parameters that control nucleation.
Surface stress, surface diffusion, and crystallographic orientation have been proposed as key parameters in dislocation surface nucleation. Surface energy and surface stress have been shown to affect the yield strength of Ag and Cu nanowires in molecular dynamics (MD) simulations.[Reference Li, Xu, Hara, Li and Ma10,Reference McDowell, Leach and Gall11] The effect of surface stress on yield strength becomes increasingly important as the nanowires get smaller. Atomistic simulations of Cu nanowires with {100} facets and characteristic size of less than 50 nm show that the strength of 〈100〉-oriented Cu nanowires decreases with size, while the strength of 〈110〉 oriented Cu nanowires increases with size.[Reference Li, Xu, Hara, Li and Ma10] In contrast, experimental measurements on Ag nanowires with {100} facets, 〈110〉 orientation, and diameters less than 100 nm show that yield strength decreases with increasing size.[Reference McDowell, Leach and Gall11,Reference Jing, Duan, Sun, Zhang, Xu, Li, Wang and Yu12] These conflicting results indicate that further investigation is needed. Surface diffusion has been suggested as a rate-limiting step in dislocation nucleation.[Reference Shin, Chen, Sanli, Richter, Labat, Richard, Cornelius, Thomas and Gianola1,Reference Sun, He, Lo, Xu, Bi, Sun, Zhang, Mao and Li13] The effect of surface diffusion can be tested by coating a metallic nanostructure by another material. Oxide-coated 〈110〉-oriented Au nanowires were found to have higher average yield strength and a narrower distribution of yield strengths than uncoated samples.[Reference Shin, Chen, Sanli, Richter, Labat, Richard, Cornelius, Thomas and Gianola1] This was attributed to lower surface diffusivity on coated surfaces, which results in larger activation volume and energy for dislocation nucleation. While oxide coatings are effective at passivating the surface, the extent of passivation (binding energy between the coating and structure) cannot be varied, and surface stress and surface diffusion cannot be modulated using this approach.[Reference Shin, Chen, Sanli, Richter, Labat, Richard, Cornelius, Thomas and Gianola1]
The ability to tune surface properties in metallic nanostructures would enable the experimental verification of simulations and reveal the role of surface stress and surface diffusion in dislocation surface nucleation. Here, we approach this challenge by investigating dislocation surface nucleation in defect-free Ag and Cu nanocubes that are passivated with organic surfactants. Organic surfactants with different binding energies are used to passivate the nanocubes in order to tune surface stress and surface diffusion on samples with identical geometry and crystallographic facets. Nanocubes are synthesized using colloidal methods, which results in precise structure and low surface roughness compared to nanostructures made using focused ion beam (FIB) milling. Nanocubes are compressed inside of a scanning electron microscope (SEM) in order to determine their yield strength and stress–strain behavior. While only two surfactants are used here, it is possible to synthesize nanocubes with a wide range of surfactants and binding energies or replace existing surfactants through ligand exchange.[Reference Jeon, Yazdi, Thevamaran and Thomas3,Reference Zhou, Li, Gilroy, Tao, Zhu, Yang, Sun and Xia14,Reference Moran, Rycenga, Zhang and Xia15] Then, the role of surface passivation on dislocation nucleation can be explored systematically. This work represents a proof-of-principle for using this approach and paves the way for detailed studies of surface-controlled mechanical properties in nanostructures.
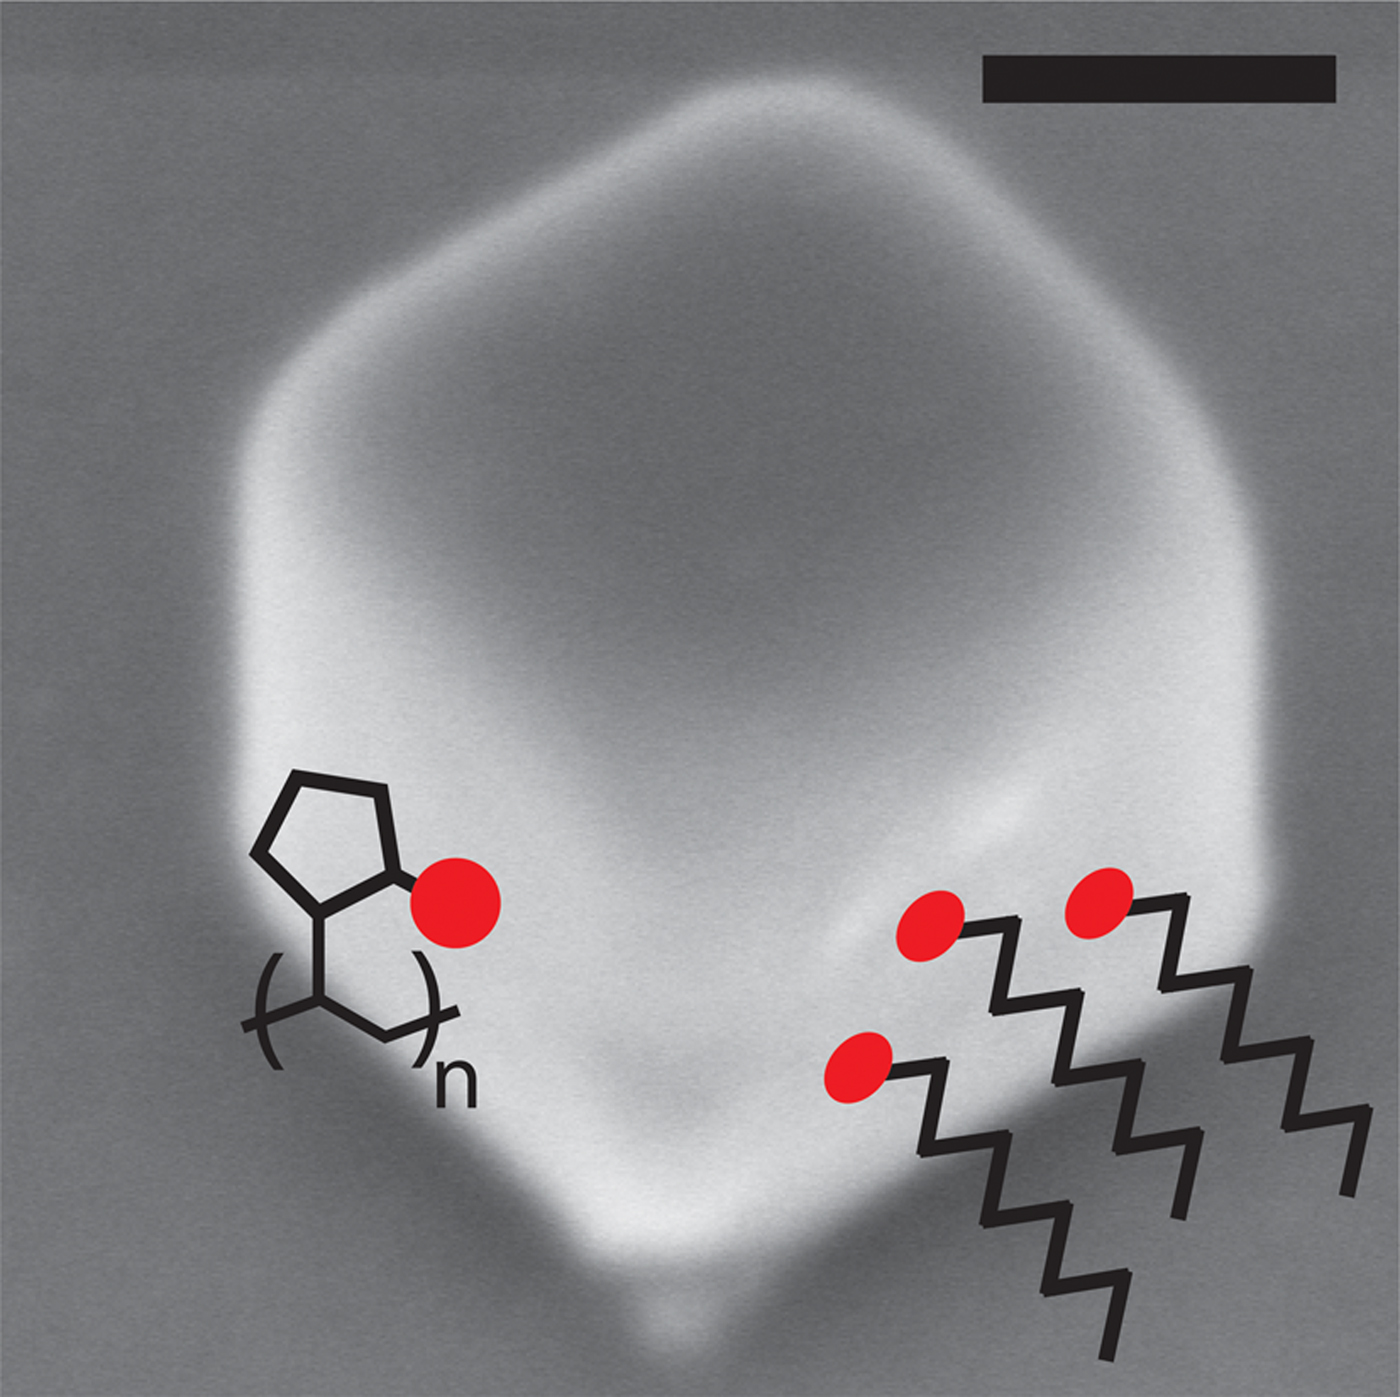
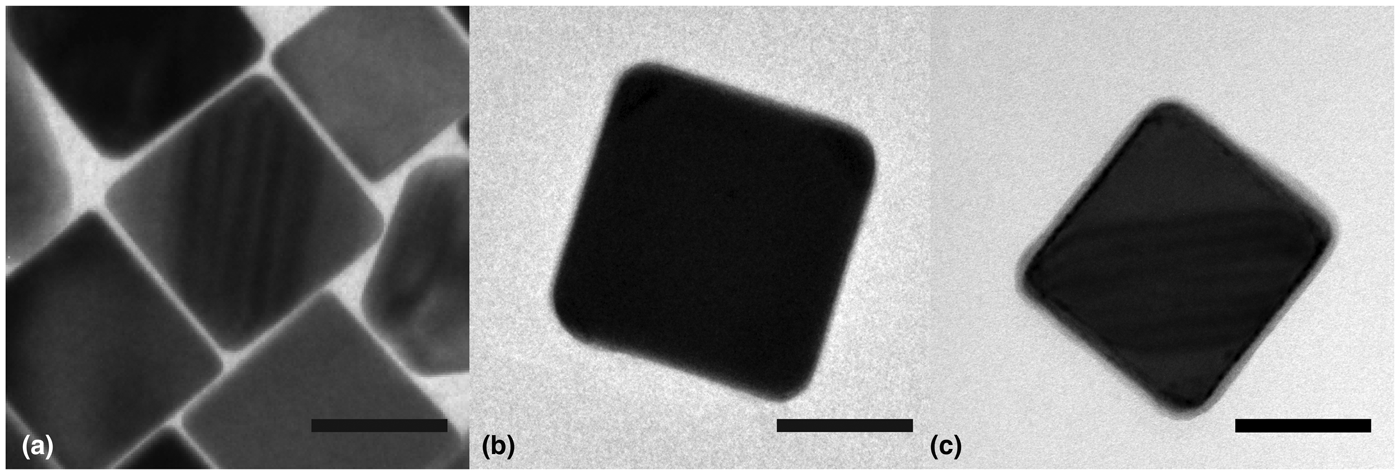
In this study, Ag nanocubes were synthesized with two different surfactants, cetyltrimethylammonium chloride (CTAC) and polyvinylpyrrolidone (PVP) (Fig. 1). Cu nanocubes were synthesized with hexadecylamine (HDA) as a surfactant. Ag nanocubes were synthesized using previously established techniques in which water or ethylene glycol is used as the solvent.[Reference Jeon, Yazdi, Thevamaran and Thomas3,Reference Zhou, Li, Gilroy, Tao, Zhu, Yang, Sun and Xia14] Cu nanocubes were synthesized by adapting a method for Au@Cu core-shell nanocubes.[Reference Hsia, Madasu and Huang16] Small, ~2–3 nm Au nanoclusters were first synthesized and used as seeds for the growth of the Cu cube. The small Au seed consists of <0.01% by volume percent of the nanocube and does not affect the mechanical behavior of the Cu nanocubes. Bright-field transmission electron microscopy (TEM) was used to determine nanocube size, shape, and microstructure (Fig. 2). CTAC-Ag nanocubes were found to be 79 ± 5 nm in size, PVP-Ag nanocubes were found to be 103 ± 8 nm in size, and HDA-Cu nanocubes were found to be 89 ± 6 nm in size. As-synthesized nanocubes are single-crystalline and dislocation-free. The contrast within the nanocubes in Figs. 2(a) and 2(c) is due to thickness fringes. A thin surfactant shell can be observed around the Cu nanocube in Fig. 2(c).
SEM image of a silver nanocube with schematics of alkyl chain (CTAC and HDA) and polymeric (PVP) surfactants. Scale bar is 50 nm.

TEM images of (a) CTAC-Ag, (b) PVP-Ag, and (c) HDA-Cu nanocubes. Scale bar is 50 nm for all images.

Organic surfactants are used during the synthesis of inorganic nanocrystals in order to control crystal growth and stabilize the nanocrystals in solution. The surfactants used here promote the growth of {110} and {111} facets, which results in the formation of nanocubes with {100} facets. The binding energy of a surfactant on a metal surface is dictated by the surfactant functional group. The binding energy is challenging to measure experimentally, but has been studied using density functional theory (DFT). CTAC separates into two ionic species in aqueous solution: CTA(+), which contains a positively charged ammonium group and Cl−. DFT calculations have shown that CTA(+) has a binding energy of 2.26 eV on (111) Ag and 1.73 eV on the (100) Ag surface.[Reference O'Regan, Zhu, Zhong, Anand, Lu, Su and Mirsaidov17,Reference Al-Saidi, Feng and Fichthorn18] 2-Pyrrolidone is the functional group in PVP, and it has a binding energy of 0.78 eV on (100) Ag and 0.69 eV on (111) Ag.[Reference Al-Saidi, Feng and Fichthorn18] An amine group is the functional group in HDA, and it has binding energies of 0.56 and 0.49 eV on (100) and (111) Cu surfaces, respectively.[Reference Liu, Balankura and Fichthorn19] From these calculations, it is apparent that CTAC-Ag > PVP-Ag > HDA-Cu in terms of binding energies. Additionally, the packing density of surfactants is an important factor in the extent of passivation, which is influenced by steric hindrance between surfactant molecules. CTAC and HDA are linear alkyl chains with functional groups at the end of the molecule, whereas PVP is a polymer with a functional group in each monomer unit. Thus, CTAC and HDA bind to surfaces in a linear fashion with high density (Fig. 1).[Reference Liu, Balankura and Fichthorn19,Reference Meena, Celiksoy, Schäfer, Henkel, Sönnichsen and Sulpizi20] In contrast, the PVP molecule binds to the metallic surface at multiple locations along the molecule and it is wrapped around the nanocube.[Reference Koczkur, Mourdikoudis, Polavarapu and Skrabalak21]
The effect of surfactants on surface stress has been previously measured using alkanethiols on planar Au surfaces. Passivation with alkanethiols decreases surface stress, and longer chain length leads to a larger decrease in surface stress due to increased charge donation to the sulfur atom.[Reference Evans and Ulman22] The reduction in surface stress for a 16-carbon alkanethiol, which has the same length as CTAC and HDA, is approximately 0.275 N/m on (111) Au.[Reference Berger, Delamarche, Lang, Gerber, Gimzewski, Meyer and Güntherodt23] Since the binding energy of alkanethiols on Au is 3.16 eV[Reference Evans and Ulman22] and higher than CTAC, HDA, and PVP, the surfactants studied here are expected to lead to a smaller decrease in the surface stress of the nanocubes. Lower surface stress suggests a better passivated surface. Based on these arguments, we expect that CTAC-Ag nanocubes will show the largest decrease in surface stress and the largest increase in yield strength. PVP-Ag nanocubes are expected to have a moderate increase in yield strength while HDA-Cu nanocubes are expected to have a minimal change in yield strength.
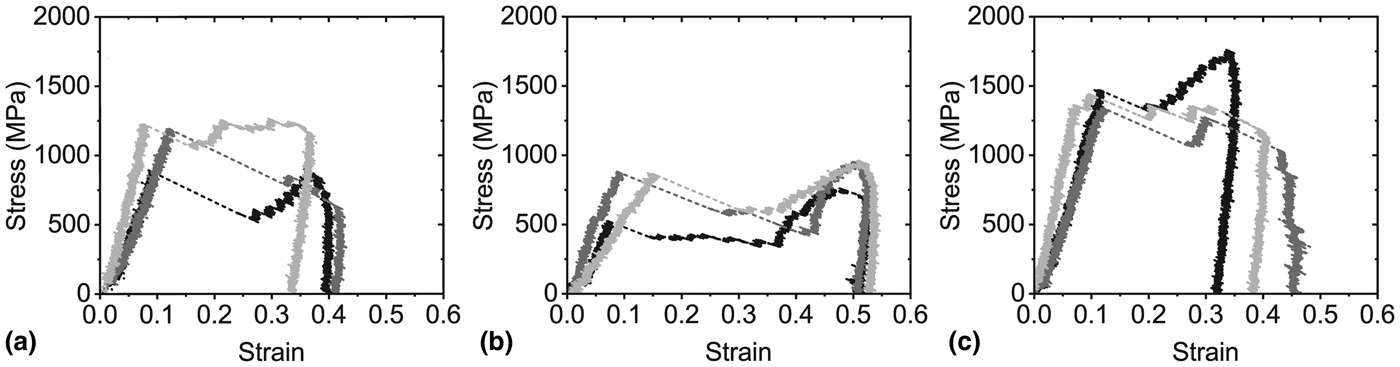
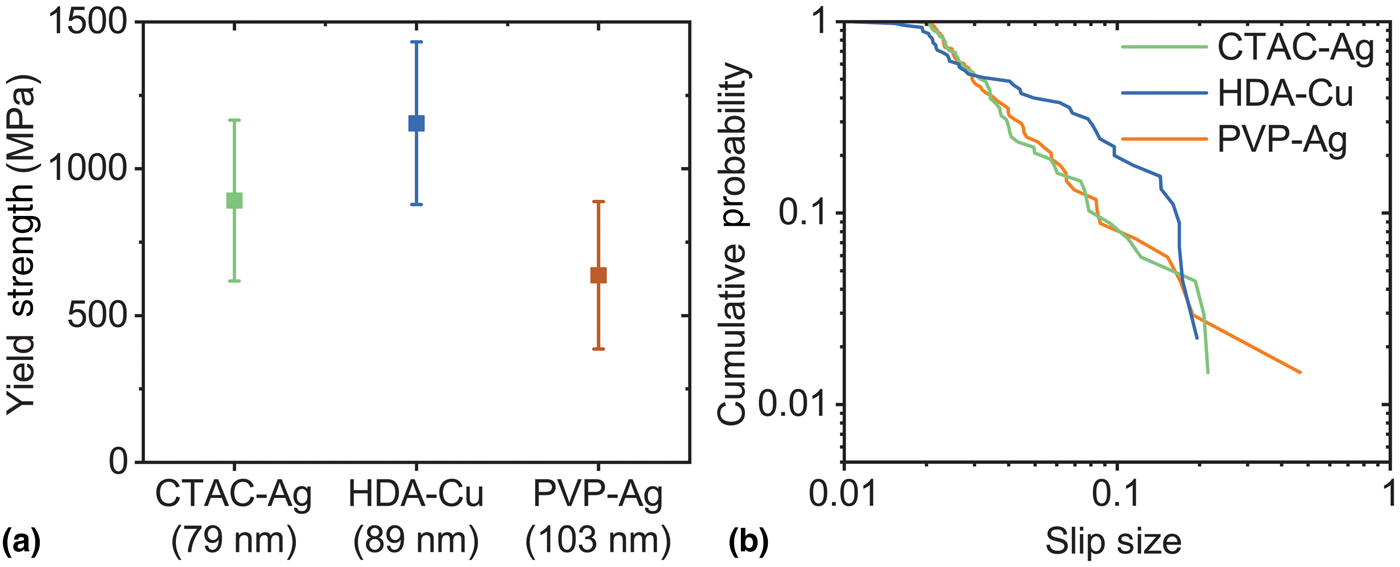
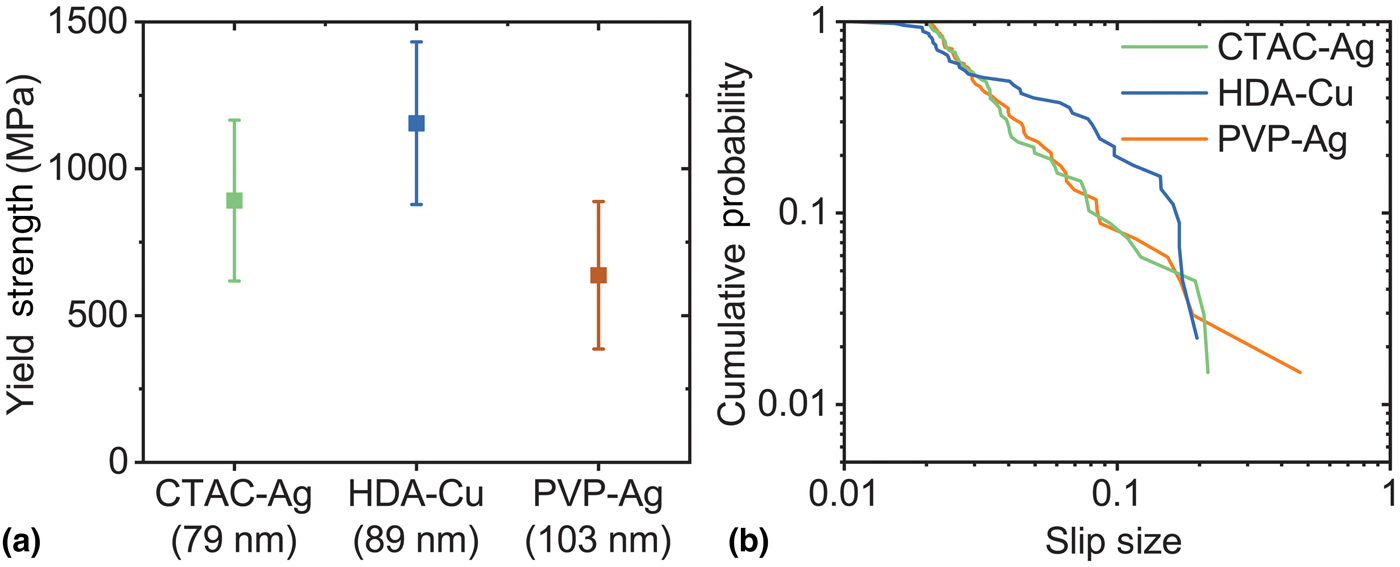
Nanocubes are dropcast onto Si(100) wafers and compressed in situ SEM using a flat punch indenter at a constant loading rate of 1 µN/s for all the samples, which corresponds to a strain rate of approximately 0.01–0.03 s−1.[Reference Kiani, Wang, Bertin, Cai and Gu24] The generated force–displacement curves are corrected for tip stiffness, frame stiffness, and indentation of the nanocube into the Si substrate. Representative engineering stress–strain curves are shown in Fig. 3 for all three nanocubes. Qualitatively, all nanocubes load elastically until dislocation surface nucleation, which marks the onset of plasticity. The yield strengths are plotted versus nanocube size in Fig. 4(a). CTAC-Ag, PVP-Ag, and HDA-Cu nanocubes have yield strengths of 892 ± 274, 637 ± 251, and 1155 ± 277 MPa, respectively. Plastic deformation in the metallic nanocubes occurs through rapid slip events, similar to single-crystalline fcc nanopillars under compression.[Reference Greer, Kim and Burek4,Reference Rabkin and Srolovitz7] The first slip event after plastic yielding corresponds to the largest jump in strain for all nanocube compressions. The size of slip events was plotted as a cumulative distribution in Fig. 4(b). The CTAC-Ag and PVP-Ag nanocubes have a slope of approximately −1.6, whereas the HDA-Cu nanocubes have a slope of approximately −1. Fcc and bcc nanopillars with diameters of 75 nm to 1 µm have cumulative slopes of −1 to −0.5.[Reference Maaß, Wraith, Uhl, Greer and Dahmen25] The difference in the cumulative distribution of slip sizes in the Ag and Cu nanocubes may be due to a difference in the deformation mechanism (e.g., twinning, partial dislocations), but this requires further investigation.
Representative engineering stress–strain curves for (a) CTAC-Ag, (b) PVP-Ag, and (c) HDA-Cu nanocubes in compression.

(a) Nanocube yield strengths. Numbers on x-axis indicate nanocube size, Cumulative distribution of slip sizes during plastic flow.
The nanocube strengths can be compared to the strength of other fcc nanostructures. Defect-free nanowires have been synthesized with {110} facets and tested in tension in the 〈110〉 direction. PVP-coated pentatwinned Ag nanowires with diameters of 40–120 nm have strengths of 1.2–4 GPa.[Reference Zhu, Qin, Xu, Fan, Ding, Zhang, Wiley and Wang26,Reference Filleter, Ryu, Kang, Yin, Bernal, Sohn, Li, Huang, Cai and Espinosa27] These wires plastically yield through dislocation surface nucleation. Dislocations subsequently interact with the twin boundaries, which results in strain hardening, which is absent in our single-crystalline nanocubes. Uncoated, single-crystalline Au and Pd nanowires with diameters of 88–100 nm have strengths of ~1.5 and 2.5 GPa, respectively.[Reference Seo, Yoo, Park, Yoon, Lee, Han, Lee, Seong, Lee, Lee, Cha, Park, Kim and Ahn28,Reference Seo, Park, Yoo, Seong, Li, Ahn, Kim and Choi29] The strength of the CTAC-Ag and PVP-Ag nanocubes is 1.5–2 times lower than the strength of the Ag and Au nanowires. The strength of the HDA-Cu nanocubes is comparable to that of fcc nanowires. The strength of ~90 nm cylindrical Cu nanopillars loaded in compression in the (100) direction was also reported to be in the range of ~1.2 GPa.[Reference Kiener and Minor30] Single crystal Cu nanowhiskers, 75–300 nm diameter, loaded in tension along the 〈110〉 direction have strength ranging in 1–7 GPa.[Reference Richter, Hillerich, Gianola, Mönig, Kraft and Volkert5] Nanostructures loaded in tension in the 〈110〉 direction require the same stress for the slip as nanostructures that are loaded in compression in the 〈100〉 direction according to the Schmid factor.[Reference Weinberger, Jennings, Kang and Greer2] Thus, it is not surprising that the [100] Cu nanocubes have a similar strength as that of [110] Cu nanowires. MD simulations of Cu nanowires with {100} facets resulted in a yield stress of ~2.5 GPa.[Reference Li, Xu, Hara, Li and Ma10] It is likely that the MD strength is higher than experimental values due to the high strain rates and atomically smooth surfaces used in the simulations.
The difference in the yield strength of the nanocubes and other fcc nanostructures may be due to geometry. CTAC-Ag, PVP-Ag, and HDA-Cu nanocubes have corners and edges with radii of curvature of 5 ± 2, 11 ± 2, and 7 ± 2 nm, respectively (Fig. 2). Yield strength is calculated from the nominal area of the nanocube as measured using TEM, which overestimates the contact area. This nominal area is the projected area in TEM, which shows up as dark contrast in Figs. 2(b) and 2(c). As seen in the TEM images, the corners of the projected area are rounded. The edges of the nanocubes are also likely to be rounded, although this cannot be measured directly in TEM. This means that the top surface of the nanocube, which is in contact with the flat punch indenter, and the bottom surface of the nanocube, which is in contact with the substrate, both have rounded edges. Thus, the initial contact area between the cube surface and the diamond tip and the substrate is overestimated at the start of compression when the projected area of the nanocube is used. A corrected initial contact area is calculated by subtracting the radius of curvature of a nanocube corner from each edge of the contact area. This correction reduces the contact area of the CTAC-Ag, PVP-Ag, and HDA-Cu nanocubes by 23%, 38%, and 29%, respectively. Using this correction, the average yield strength of the CTAC-Ag, PVP-Ag, and HDA-Cu nanocubes increases to 1.2 ± 0.4, 1.0 ± 0.4, and 1.6 ± 0.4 GPa, respectively. The strength of all the nanocubes is now similar to that of the previously measured fcc nanostructures, and the difference in the strength of CTAC-Ag and PVP-Ag nanocubes is reduced. The nanocube geometry may also lead to preferential dislocation nucleation at corners and edges, which has been observed in MD simulations of square nanowires.[Reference Weinberger, Jennings, Kang and Greer2] This would reduce the yield strength of the nanocubes relative to cylindrical samples.
The strengths of CTAC-Ag and PVP-Ag nanocubes are significantly lower than the strength of the HDA-Cu nanocubes. This is in contrast to previously studied Ag nanowires and Cu nanopillars, which have similar strengths.[Reference Richter, Hillerich, Gianola, Mönig, Kraft and Volkert5,Reference Zhu, Qin, Xu, Fan, Ding, Zhang, Wiley and Wang26,Reference Filleter, Ryu, Kang, Yin, Bernal, Sohn, Li, Huang, Cai and Espinosa27,Reference Kiener and Minor30] The low strength of Ag nanocubes relative to Cu nanocubes could be due to differences in atomic level surface roughness. Surface roughness in the form of atomic edges and steps are preferred sites for dislocation nucleation.[Reference Rabkin and Srolovitz7] Colloidal nanocubes are expected to have lower surface roughness than FIB milled and electroplated nanopillars but Cu nanocubes have the same strength as Cu nanopillars.[Reference Kiener and Minor30] This indicates that surface roughness is not a major factor in nanocube deformation. While it is impossible to experimentally determine the atomic level surface roughness of the Ag nanocubes versus the Cu nanocubes, it is expected that all nanocubes have a similar surface roughness because they are synthesized using similar techniques.
The low HDA-Cu binding energy leads to a small change in surface stress, which does not appear to affect yield strength or the dislocation surface nucleation energy. CTAC-Ag nanocubes have higher strength than PVP-Ag nanocubes, which may be a result of the higher binding energy and density of CTAC as compared to PVP. However, the relative difference in strengths cannot be completely attributed to surfactants as there could be size dependent properties. CTAC-Ag nanocubes are smaller (79 ± 5 nm) than the PVP-Ag nanocubes (103 ± 8 nm). The higher strength of the CTAC-Ag nanocubes agrees with the “smaller is stronger” trend that has been widely observed in single crystalline nano- and microscale samples.[Reference Greer, Kim and Burek4] It is unclear whether the “smaller is stronger” trend applies to the size regime controlled by surface nucleation. The “smaller is stronger” trend has been observed in Cu nanopillars which deform through dislocation surface nucleation,[Reference Kiener and Minor30] but others have observed a size-independent plateau in strength in defect-free nanostructures.[Reference Han, Huang, Ogata, Kimizuka, Yang, Weinberger, Li, Liu, Zhang, Li, Ma and Shan9,Reference Li, Xu, Hara, Li and Ma10] The influence of size and surfactant cannot be separated for the Ag nanocubes without further experiments.
In summary, we have compressed single crystalline, {100} facetted Ag and Cu nanocubes that are passivated with organic surfactants in order to investigate the influence of surface properties on dislocation nucleation at free surfaces. In situ SEM compressions of CTAC-Ag and PVP-Ag nanocubes resulted in yield strengths of 892 ± 274 and 637 ± 251 MPa, respectively, while HDA-Cu nanocubes have a strength of 1155 ± 277 MPa. The difference in the yield strengths of the CTAC-Ag and PVP-Ag nanocubes may be due to the higher binding energy of CTAC compared to PVP, but differences in the size of these nanocubes (79 nm versus 103 nm) may also play a role. The higher strength of the HDA-Cu nanocubes indicates that the surface properties of Cu are less conducive to dislocation nucleation than Ag, and that the intrinsic material properties of the metal overcome the influence of the surfactant.
Acknowledgment
We gratefully acknowledge financial support from the Stanford SystemX Alliance. M.T.K. is supported by the National Defense and Science Engineering Graduate Fellowship. Part of this work was performed at the Stanford Nano Shared Facilities (SNSF), which is supported by the National Science Foundation under award ECCS-1542152.