I. INTRODUCTION
Recently, carbon nanomaterials are becoming increasingly popular because of their special properties and the possibilities of their versatile applications. Carbon nanotubes (CNTs) represent one of the important carbon materials in the fast-developing nanotechnology research. The unique physical and chemical properties of CNTs suggest that the materials can potentially be utilized in areas such as field emission displays,Reference Fan, Chapline, Franklin, Tomber, Cassell and Dai1–Reference Choi, Son and Kim3 transistors,Reference Bandaru, Daraio, Jin and Rao4 hydrogen storage,Reference Dillon, Jones, Bekkedahl, Kiang, Bethune and Heben5 etc. Carbon nanocoils (CNCs) represent a special class of carbon nanostructures, which were theoretically predicted to exist by Ihara and Itoh.Reference Ihara and Itoh6 It is proposed that periodic insertion of pentagons and heptagons in the hexagonal carbon network leads to positive and negative curvature, which can generate a regular CNC with stable thermodynamics.Reference Ihara and Itoh6, Reference Terrones, Hsu, Hare, Kroto, Terrones and Walton7 In experiment, the formation and morphology of CNCs have been first reported by Zhang and coworkers,Reference Amelinckx, Zhang, Bernaerts, Zhang, Ivanov and Nagy8 Motojima et al.Reference Motojima, Kawaguchi, Nozaki and Iwanaga9 Because of their unique three-dimensional helical morphologies, CNCs have more outstanding mechanical and electromagnetic properties than those of CNTs.Reference Hayashida, Pan and Nakayama10, Reference Treacy, Ebbesen and Gibson11 Due to these excellent properties, CNCs are expected to have a wide applications, which can be used in electromagnetic wave absorbers, field emission devices, micro/nano electro mechanical systems (MEMS/NEMS), etc.Reference Hokushin, Pan, Konishi, Tanaka and Nakayama12, Reference Tang, Yang, Lin, Zhong, Chaktong and Du13 Among many published techniques for the fabrication of CNCs, catalytic chemical vapor deposition (CVD) has been found to be the most popular method, which is carried out using the transition metals such as Fe, Co, Ni, Cu, and their alloys as the catalyst.Reference Okazaki, Hosokawa, Goto and Nakayama14–Reference Chiu, Lin, Wu, Hsieh, Chen and Chen17 Pan et al.Reference Pan, Zhang and Nakayama18, Reference Pan, Zhang, Harada, Takano and Nakayama19 have prepared CNCs using iron-coated indium tin oxide as the catalyst. However, these methods need expensive vacuum evaporation or complex electroplating to prepare iron films, which is not suitable for mass production of CNCs. Okazaki et al.Reference Okazaki, Hosokawa, Goto and Nakayama14 have developed Fe–In–Sn–O powder catalysts by using a coprecipitation technique for synthesizing CNCs. Although a large amount of the CNCs can be synthesized using the above method, the sizes of these nanocoils are too large to have a high crystallinity, and the utilization ratio of catalyst is low. Yu et al.Reference Yu, Qin and Cui20 have reported that helical carbon nanofibers with a symmetric growth mode could be synthesized by the catalytic decomposition of acetylene at 241 °C with Cu–Ni alloy nanoparticles as the catalyst. Although a high yield of coiled nanofibers with small coil diameters can be obtained, the formed coiled nanofibers are highly disordered in structure. Tang et al. have synthesized helical carbon nanotubes (HCNTs) in the pyrolysis of acetylene at 450 °C over Fe nanoparticles generated by means of a combined sol-gel/reduction method.Reference Tang, Zhong, Au, Gedanken, Yang and Du21 These HCNTs range from 100 to 150 nm in diameter and are polycrystalline in structure. Nevertheless, they are short in coil pitch and coil length, which would limit their mechanical properties and potential applications. To synthesize CNCs with smaller diameter and higher crystallinity, first of all, smaller catalyst particles should be prepared. It is noted that a spin-coating method makes it possible to prepare the small catalyst particles with a uniform distribution, in a simple way and low cost. Haubner et al.Reference Haubner, Schwinger, Haring and Schöftner22 have successfully prepared aligned CNTs using a sol-gel-based Fe catalyst film by a spin-coating method. This method is considered to be also valid in fabricating CNCs, which is less reported. In this work, we have prepared Fe–Sn–O film, used as the catalyst for synthesizing CNCs, by a spin-coating method. It is found that the sizes of CNCs synthesized by this method are smaller than those of CNCs synthesized by a sol-gel methodReference Pan, Zhang, Harada, Takano and Nakayama19 and a coprecipitation method,Reference Hayashida, Pan and Nakayama10 and the utilization ratio of the catalyst has also been greatly improved.
II. EXPERIMENTAL
The alcohol solution of FeCl3·6H2O/SnCl2·5H2O (0.2 mol/L) was used as the catalyst precursor. The molar ratio of Fe to Sn was maintained at 3:1. Catalyst alcohol solution with a volume of 10 μL was spin-coated on the Si substrates (size: 8 × 8 mm2) with a rotational speed of 3000 rpm and dried at 40 °C for 10 min. To obtain the catalyst films with different thicknesses, the above process was repeated for one to five times. Then, the samples were calcined at 700 °C for 30 min to oxidize the catalysts. The catalysts were labeled as S1, S2, S3, and S5 corresponding to the spin-coating times for once, twice, three times, and five times, respectively. CNCs were synthesized on these substrates by a thermal CVD system at 700 °C for 30 min by introducing acetylene and Ar gases with flow rates of 30 and 230 sccm. For comparison, CNCs were synthesized, under the same conditions, using Fe–Sn–O catalysts prepared by a sol-gel methodReference Li, Pan, Qian and Liu23 and a solution-dipping method.
The catalyst films were prepared by a spin coater (SC-1B). The deposits were observed and analyzed by scanning electron microscope (SEM; Hitachi S-4800, Tokyo, Japan), transmission electron microscope (TEM; Tecnai G220, FEI, Eindhoven, Netherlands), high-resolution transmission electron microscope (HRTEM; Tecnai G220, FEI, Eindhoven, Netherlands), atomic force microscope (AFM; Agilent PicoPlusII, Agilent, Santa Clara, CA), and Raman spectroscopy (Renishaw inVia plus, Renishaw, Gloucestershire, UK).
III. RESULTS AND DISCUSSION
A. Properties of the CNCs synthesized by two traditional methods
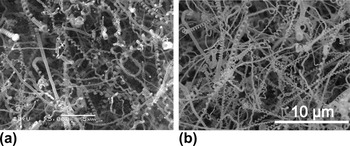
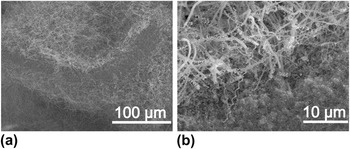
In the previous report,Reference Li, Pan, Qian and Liu23 we have synthesized CNCs using Fe–Sn–O catalyst particles prepared by a sol-gel method. In addition, CNCs have been synthesized using FeCl3·6H2O/SnCl2·5H2O catalyst precursor by a solution-dipping method. Figure 1 shows the SEM images of CNCs grown at 700 °C for 30 min using Fe–Sn–O catalysts prepared by (a) a sol-gel method and (b) a solution-dipping method. It is found that a large number of CNCs have been grown from the catalysts, indicating that both methods are beneficial for the efficient synthesis of CNCs. The properties of the CNCs prepared by the above two methods are summarized in Table I. It is obvious that the average coil diameter and line diameter of the CNCs grown by the sol-gel method are larger than those of the CNCs grown by the solution-dipping method, suggesting that the sizes of catalyst particles prepared by the sol-gel method are larger than those prepared by the solution-dipping method. A careful observation of Fig. 1(b) reveals that some smaller CNCs with an average coil diameter of 200 nm and a line diameter of 100 nm have been formed. Therefore, the solution method is considered to be a promising technique to synthesize CNCs with small diameter. However, the utilization ratio of catalysts prepared by the solution-dipping method is not very high. Figure 2 shows the cross-sectional SEM images of CNCs grown by Fe–Sn–O catalysts prepared by the solution method. It is found that most of the CNCs are grown only on the two surfaces of the carbide catalysts, but no CNC has been formed in the internal parts, which leads to a lower utilization ratio of the catalyst.
Scanning electron microscope (SEM) images of the carbon nanocoils (CNCs) grown at 700 °C for 30 min using Fe–Sn catalysts prepared by a (a) sol-gel method and (b) solution method.

(a) SEM image of the CNCs grown from the surfaces of the thick Fe–Sn catalysts, and (b) the enlarged image of Fig. 2(a).

Properties of the carbon nanocoils (CNCs) prepared by two traditional methods.

It is considered that the diameter of a coil is determined by the size of the catalyst particle. Therefore, to improve the utilization ratio of the catalyst and to synthesize CNCs with a small diameter, a thinner Fe–Sn–O catalyst film composed of the smaller particles should be prepared. Based on the above solution-dipping method, we have prepared Fe–Sn–O catalyst film by a spin-coating method for the growth of CNCs.
B. Growth of CNCs by Fe–Sn–O catalyst film
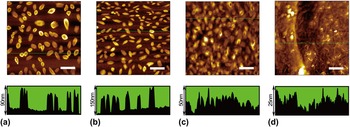
Figure 3 shows a series of AFM images of calcined Fe–Sn–O catalyst films prepared by different times of spin-coating. It is observed in Fig. 3(a) that catalyst particles with a uniform distribution are formed by spin-coating for once, whose density is approximately 8 μm−2. It is also found that there are two kinds of nanostructured catalysts, oval-shaped groove structure and oval-shaped solid structure, the height of which is approximately 90 nm. After spin-coating for twice, large catalyst particles with sizes of approximately 150 nm have been formed, meanwhile, the catalyst density has increased to 14 μm−2 [shown in Fig. 3(b)]. After continuous spin-coating for three times, the density of the catalyst particles remains unchanged, but the catalyst particles gradually form a continuous membrane structure, which leads to the reduction in the relative height of the catalyst particles [shown in Fig. 3(c)]. Figure 3(d) shows the AFM image of the catalyst film after spin-coating for five times. It is clearly observed that all the large catalyst particles have been covered by the catalyst film, and the relative height of the film is only 25 nm, indicating that the film thickness has reached up to over 150 nm.
Atomic force microscope (AFM) images of the calcined Fe–Sn–O catalyst films of (a) S1, (b) S2, (c) S3, and (d) S5. The lower figures show the cross sections along the line drawn in the corresponding images. Scale bar: 2 μm.

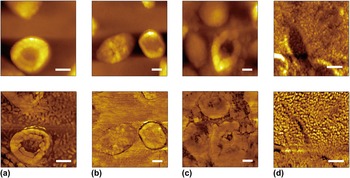
Figure 4 shows the enlarged AFM topographies and the corresponding phase diagrams for the Fe–Sn–O catalyst film of (a) S1, (b) S2, (c) S3, and (d) S5. From the topographic images only large particles can be observed, while from the phase diagrams we can identify other components. It is observed from the phase diagram in Fig. 4(a) that some discontinuous small particles that may be suitable for the growth of small CNCs, distribute around the large particles. However, when the spin-coating times are more than twice, most of the discrete small particles have transformed into a continuous membrane structure as shown in Figs. 4(b) and 4(c).
The enlarged AFM images and corresponding phase diagrams of Fe–Sn–O catalyst film of (a) S1, (b) S2, (c) S3, and (d) S5. Scale bar: 200 nm.

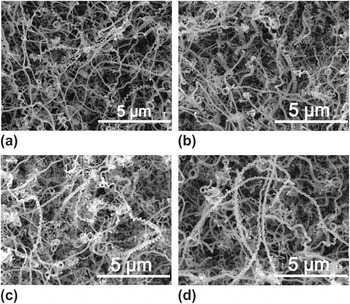
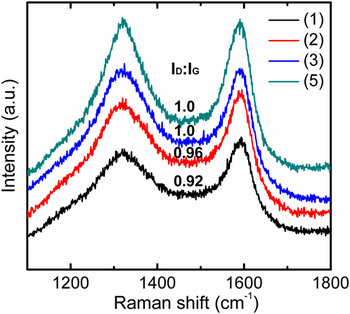
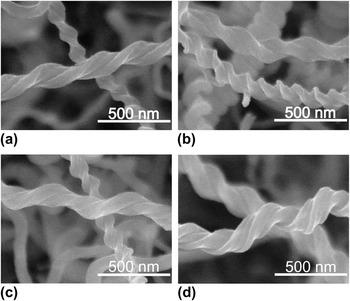
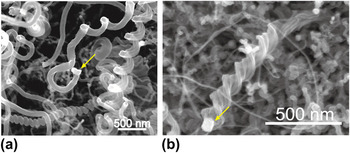
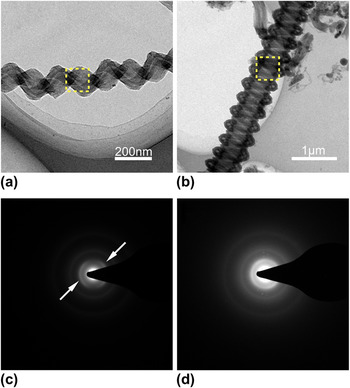
Figure 5 shows the SEM images of CNCs synthesized at 700 °C for 30 min by the Fe–Sn–O catalyst films of (a) S1, (b) S2, (c) S3, and (d) S5. It is found that apart from a small amount of straight carbon nanofibers, many of the CNCs have grown out from the catalyst films of S1–S5. The structures and morphologies of the CNCs synthesized by these catalysts are almost the same, indicating that the catalyst thickness does not affect sizes and morphologies of the final grown CNCs. A careful observation on Fig. 5(d) reveals that the average diameter of the CNCs is smaller than that of straight forms. Such phenomenon also appears in the growth of HCNTs, where carbon products with large diameter are of a straight form.Reference Tang, Wen, Zhang, Liu, Lin and Du24 The carbon nanostructures in CNCs are inspected by Raman spectral analysis with He–Ne laser, as shown in Fig. 6. There exit two main peaks in the Raman spectra, one is around 1322 cm−1 known as D-band originated from structural defects in carbon materials, and the other is around 1591 cm−1 known as G-band originated from graphite structure. Comparing the spectra, the ratio of I D/I G corresponding to the CNCs synthesized by four Fe–Sn–O catalyst films, gradually increases from 0.92 to 1.0 when adding the spin-coating time. Figure 7 shows the SEM images of some typical CNCs synthesized by Fe–Sn–O catalyst films of (a) S1, (b) S2, (c) S3, and (d) S5. It is found that the coil diameter and line diameter of these carbon coils are almost the same, ranging from 100 to 200 and 100 to 150 nm, respectively, which are much smaller than those of CNCs synthesized by a sol-gel method and a solution-dipping method. A careful observation on Fig. 7 reveals that most of the grown CNCs are double-helix and twisted forms, which indicates that the corresponding catalyst particles are mirror-symmetric structures.Reference Li, Pan, Liu and Yu25Figure 8 shows the SEM images for the tips of two typical CNCs with (a) spring-like and (b) twisted forms. The catalyst particles are found at the tips of the CNCs, indicating a tip growth mechanism. The sizes of grain catalysts in Figs. 8(a) and 8(b) are almost the same, approximately 100 nm, which are consistent with those of large particles in Fe–Sn–O catalyst films shown in Fig. 3. Figures 9(a) and 9(b) show the TEM images of a typical double-helix CNC prepared by the spin-coating method and a CNC prepared by the solution-dipping method, respectively. It is observed in Fig. 9(a) that the CNC consists of a carbon tubule and a carbon fiber, which has coil diameter of 170 nm and line diameter of 75 nm. Figures 9(c) and 9(d) are the selected-area electron diffraction (SAED) patterns corresponding to the dotted line area in Figs. 9(a) and 9(b). Continuous diffraction rings are observed in Fig. 9(d), which indicate that a very low degree of graphite structure exists in CNC. Compared with the SAED of the CNC in Fig. 9(d), besides the presence of diffraction ring, two symmetric arcs (shown by the arrows) which are due to the diffraction of (002) graphitic planes can also be observed in Fig. 9(c). The (002) ring is not continuous but distinct arcs, indicating that there exist some more graphite-like crystallites or areas in CNC structure.
SEM images of carbon deposits synthesized at 700 °C for 30 min by Fe–Sn–O catalyst films of (a) S1, (b) S2, (c) S3, and (d) S5.

Raman spectra of carbon deposits synthesized by Fe–Sn–O catalyst films of (a) S1, (b) S2, (c) S3, and (d) S5.

SEM images of some typical CNCs synthesized by Fe–Sn–O catalyst films of (a) S1, (b) S2, (c) S3, and (d) S5.

SEM images for the tips of two typical CNCs synthesized by Fe–Sn–O catalyst films. The yellow arrows point to the catalyst particles.

Transmission electron microscope (TEM) images of (a) a typical CNC prepared by the spin-coating method, and (b) a CNC prepared by the solution-dipping method. (c, d) The corresponding selected-area electron diffraction patterns in (a, b).

In the above section, we have mainly discussed the growth status of the sample surface. In addition, the status of the sample cross section has been investigated, and some interesting phenomena have been found.
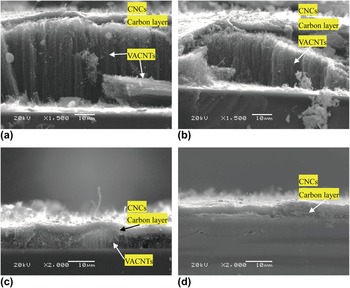
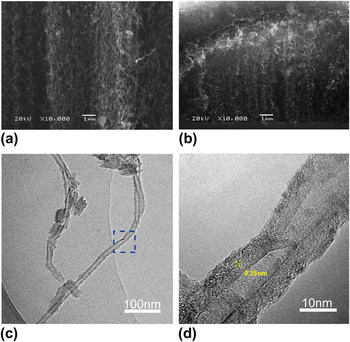
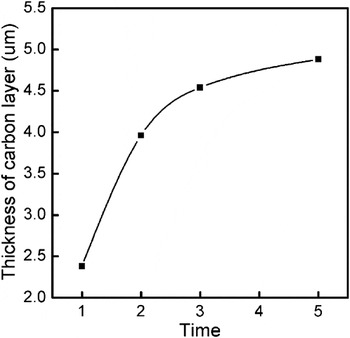
It is observed from Fig. 10(a) that a sandwich-like nanostructure has been formed on the Si substrate. The top layer is mainly composed of CNCs, the middle part is a carbon layer with a thickness of approximately 2.38 μm, and the bottom layer is vertically aligned carbon nanotubes (VACNTs) with a height of approximately 44 μm. For the catalyst film of S2, sandwich-like nanostructure has also been formed, as shown in Fig. 10(b). Differently, the thickness of VACNTs grown from S2 is approximately 26 μm which is a little thinner than that grown from S1, and the height of nanotube array is decreased from the middle to both sides. A careful observation in Fig. 10(c) reveals that a layer of CNC and a carbon layer are mainly grown. In addition, very thin VACNTs with a height of only few microns have also been grown from the Si substrate and formed a periodic wave structure. Figures 11(a) and 11(b) show the enlarged SEM images of VACNTs layer grown from the catalyst films of S1 and S3. It is found that the VACNTs grown from S1 arrange more orderly than those grown from S3. Typical TEM image in Fig. 11(c) further illustrates that the as-grown product contains CNTs, and the corresponding HRTEM of the CNT is shown in Fig. 11(d). It is observed that the CNT has an average outer and inner diameter of 18 and 4.5 nm and the interlayer spacing of the CNT is about 0.35 nm. When using the thickest catalyst film of S5, CNCs/carbon double-layer structures are formed as shown in Fig. 10(d). It is found that the formed carbon layer using the catalyst of S5 is thicker than that using the catalysts of S1–S3 but much thinner than that using the catalysts prepared by the solution-dipping method. Figure 12 shows the dependence of the average thickness of carbon layer on the spin-coating times. It is found that with increasing the spin-coating times, the thickness of carbon layer gradually increases to a steady state, from approximately 2.4 to 4.9 μm. It is considered that increasing the spin-coating times leads to the increase in the catalyst content (catalyst film thickness) on the Si substrate, which absorbs more carbon atoms during the CVD process, and subsequently forms a thicker carbon layer.
The cross-sectional SEM images of carbon deposits synthesized by the Fe–Sn–O catalyst films of (a) S1, (b) S2, (c) S3, and (d) S5.

The enlarged cross-sectional SEM images of vertically aligned carbon nanotubes (VACNTs) synthesized by the Fe–Sn–O catalyst films of (a) S1 and (b) S3. (c) Transmission electron microscope image of CNTs and (d) the corresponding high-resolution transmission electron microscope image.

The thickness of carbon layer dependence of spin-coating times.

C. Growth mechanism of the CNCs and the multilayer structures
The differences in the spin-coating times affect the growth of the carbon nanostructures and the thickness of the carbon layer. The catalyst film of S1 leads to the growth of CNCs/carbon layer/VACNTs sandwich-like structure, the catalyst films of S2 and S3 lead to the growth of CNCs/carbon layer/thin CNTs structure, while the catalyst film of S5 leads to the growth of CNCs/carbon double-layer structure. To increase the utilization ratio of the catalysts (reducing the thickness of the carbon layer and increasing the production of CNCs), the spin-coating times should be reduced. The growth mechanisms of these different multilayer structures have been discussed in detail.
It has been reported that the diameter of a CNT depends on the size of the catalyst particle.Reference Li, Kim, Zhang, Rolandi, Wang and Dai26, Reference Duesberg, Graham, Liebau, Seidel, Unger, Kreupl and Hoenlein27 Similarly, the line diameter of a CNC is also determined by the size of the catalyst particle at the coil tip.Reference Pan, Zhang and Nakayama18 In this experiment, according to the TEM and SEM observation the average line diameter of the grown CNCs is approximately 100 nm (Figs. 7–9), consistent with the sizes of catalyst particles observed at the tips of the CNCs (Fig. 9); the average diameter of the grown CNTs has been observed to be ranged from 10 to 20 nm (Fig. 11), therefore the corresponding catalyst particle also should be approximately 10 nm. However, CNCs or CNTs with average diameter ranging from 20 to 100 nm have rarely been observed from the growth result. According to the AFM observation, there exist catalyst particles with sizes ranging from 10 to 100 nm (Figs. 3 and 4). From the composition of the catalyst, a large number of experimental results indicate that the growth of CNCs needs Fe–Sn catalysts with sizes of no less than 100 nm and the optimum molar ratio of Fe to Sn is 3:1,Reference Okazaki, Hosokawa, Goto and Nakayama14, Reference Pan, Zhang and Nakayama18, Reference Pan, Zhang, Harada, Takano and Nakayama19, Reference Li, Pan, Qian and Liu23 while most of the VACNT growth only needs Fe catalysts with sizes ranging from 10 to 20 nm.Reference Haubner, Schwinger, Haring and Schöftner22, Reference Futaba, Hata, Yamada, Mizuno, Yumura and Iijima28, Reference Lee, Lee and Kim29 It is speculated that with the decrease in the size of catalyst particle, the content of both Sn and Fe in the catalyst is reduced. When the size of the catalyst is reduced lower than 20 nm, there are only the pure Fe particles. The above speculation is the possible reason that the large catalyst particles lead to the growth of the CNCs and the small catalyst particles lead to the growth of the VACNTs. While for the middle-sized catalysts, they are unsuitable for the CNC or CNT growth, but they still have the catalytic activity of decomposing acetylene, carbonization, and carbon precipitation, which contribute to the increase in the carbon layer. According to the above corollary and experimental results, it is reasonable to assume that three kinds of catalysts are formed by the spin-coating method, the first is large Fe–Sn–O catalyst particles with diameters of approximately 100 nm, whose role is the formation of CNCs; the second is small Fe catalyst particles with diameters of approximately 10 nm, whose role is to grow the CNTs; and the third is the middle-sized Fe–Sn–O or Fe–O catalyst particles with diameters from 20 to 100 nm, whose role is the formation of carbon layer.
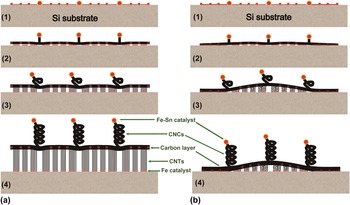
Based on the experimental results and the above assumption, a possible model for the multilayer structure growth from the Fe–Sn–O catalyst film is proposed, where the growth mechanisms of the CNCs/carbon layer/VACNTs sandwich-like structure and the CNCs/carbon layer/thin VACNTs structure are mainly discussed. It has been observed from the AFM images of Figs. 3 and 4 that the spin-coating times affect the distribution and continuity of the catalyst particles. Catalyst film composed of the discrete particles with different sizes is formed by spin-coating for once. When the spin-coating times are more than two times, the large particles are still isolated. However, the small particles continue to accumulate due to a higher density, changing from the discrete state into the continuous state. Figure 13 shows two growth models of the CNCs/carbon layer/VACNTs three-layer structure by Fe–Sn–O catalyst film. From the Fe–Sn–O catalyst film composed of the discrete small particles, CNCs/carbon layer/VACNTs sandwich-like structure would finally be grown [Fig. 13(a)], while from the Fe–Sn–O catalyst film composed of part of the continuous small particles, CNCs/carbon layer/thin VACNTs structure would finally be grown [Fig. 13(b)]. The film consisting of three discrete catalyst particles is formed during the initial stages of the thermal CVD process [Fig. 13(a)1]; after feeding acetylene, large Fe–Sn catalyst particles start to grow CNC buds, simultaneously the middle-sized Fe–Sn or Fe particles start carbonization and then form a thin carbon layer [Fig. 13(a)2]; and meanwhile the small isolated Fe particles start the growth of CNTs. With continuous feeding of acetylene, three kinds of carbon structures are grown. The CNTs become vertically aligned, which then lift up the carbon layer as well as the CNCs [Fig. 13(a)3]. With the increasing of growth time, the CNCs and CNTs become longer, and carbon layer becomes thicker, forming a CNCs/carbon layer/VACNTs sandwich-like structure [Fig. 13(a)4]. Similarly, for the film consisting of part of the continuous catalyst particles [Fig. 13(b)1], the large Fe–Sn catalyst particles start the growth of CNCs, meanwhile both the middle-sized particles and some part of the small continuous particles start carbonization and then form a thin carbon layer [Fig. 13(b)2]; while from another part of the isolated Fe catalysts, CNTs are grown [Fig. 13(b)3]. Due to the constrain on the both sides of the carbon layer, however, CNTs cannot continue to grow, which leads to formation of a distorted thin VACNTs. Finally, a CNCs/carbon layer/thin VACNTs structure is formed [Fig. 13(b)4].
Growth model of the CNCs/carbon/VACNT three-layer structure by Fe–Sn–O catalyst films composed of (a) discrete particles and (b) part of the continuous particles.

IV. CONCLUSIONS
We have synthesized CNCs with coil diameter from 100 to 200 and line diameter from 100 to 150 nm by using the Fe–Sn–O film catalyst prepared by a spin-coating method. Comparing with the CNCs synthesized by the sol-gel method and the solution-dipping method, the CNCs prepared by the spin-coating method are much smaller and have a higher crystallinity. CNCs/carbon layer/VACNTs sandwich-like nanostructures can be grown by controlling the spin-coating time. It is considered that there are three kinds of the catalysts formed by the spin-coating method, large Fe–Sn particles, middle-sized Fe–Sn or Fe particles, and small Fe particles, their role is to lead to the growth of CNCs, carbon layer, and VACNTs, respectively.
ACKNOWLEDGMENTS
This work was supported by the National Natural Science Foundation of China (No. 51072027), the Fundamental Research Funds for the Central Universities (No. DUT11ZD102), and the Project for Scientific Researches of 2009 in Universities from the Education Department of Liaoning Province (No. 2009S016).