INTRODUCTION
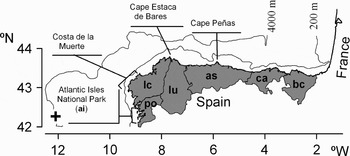
On 13 November 2002, 45 km off the Galician coast, the single-hulled tanker ‘Prestige’, carrying 77000 tons of type M-100 fuel, started spilling through a series of cracks in its hull. After 2 d of north-westward steaming, its course was deflected south-westwards, until the ship sank at a location 100 km off the Galician coast (42°26 N 11°24W) at depths of 3530 (stern) and 3819 (bow) m (Figure 1; Balseiro et al., Reference Balseiro, Carracedo, Gómez, Leitão, Montero, Naranjo, Penabad and Pérez-Muñuzuri2003; Álvarez-Salgado et al., 2006). Before sinking, the ‘Prestige’ left a wake of 6000 tons of fuel which could be easily identified from the space as a characteristic, triangular shape (Balseiro et al., Reference Balseiro, Carracedo, Gómez, Leitão, Montero, Naranjo, Penabad and Pérez-Muñuzuri2003). There were further massive oil spills associated with the wreck, but only the fuel spilled during the first days entered the Bay of Biscay (Figure 1; García-Soto, Reference García-Soto2004; Balseiro et al., Reference Balseiro, Carracedo, Gómez, Leitão, Montero, Naranjo, Penabad and Pérez-Muñuzuri2003), to impact over more than 1000 km of shoreline on the Cantabrian Coast during 5–6 December 2003. Wind forcing, in combination with the Iberian Poleward Current (IPC, sometimes also referred to as ‘Navidad’: García-Soto et al., Reference García-Soto, Pingree and Valdés2002; Llope et al., Reference Llope, Anadón, Viesca, Quevedo, González-Quirós and Stenseth2006), were soon blamed as dispersal vectors by many scientists within the Spanish marine science community on the basis of accumulated oceanographic knowledge (Serret et al., Reference Serret2003; see also Fernández, Reference Fernández2003). When present, the IPC flows along the continental slope, northward along the west Iberian coast (Portugal and Galicia) and then eastward along the northern Spanish coast (Frouin et al., Reference Frouin, Fiuza, Ambar and Boyd1990; Haynes & Barton, Reference Haynes and Barton1991; Figure 1). The interannual variability of the IPC and its penetration in the Cantabrian Sea have been analysed since 1979 (~25 y, García-Soto et al., Reference García-Soto, Pingree and Valdés2002), the observations showing a large-scale pattern predictable to some extent. Thus, the ‘Prestige’ accident represented a unique opportunity to observe the large scale fuel deposition patterns at the coast following an oil spill, in order to understand their relationship to prevailing oceanographic conditions.
Map of the Spanish north coast. The ‘Prestige’ wreckage is indicated by a plus symbol. Contours correspond to the 200 and 4000 m isobaths. Shaded areas represent the Spanish regions affected by the oil spill: ai, Atlantic Isles; po, Pontevedra; lc, La Coruña; lu, Lugo; as, Asturias; ca, Cantabria; bc, Basque Country. The main affected area was the ‘Costa de la Muerte’.

MATERIALS AND METHODS
Fuel distribution was recorded in the Asturias and Cantabria regions (as and ca in Figure 1) from December 2002 to March 2003. This section comprises nearly 80% of the north Spanish shores (Figure 1). To the best of our knowledge, no equivalent studies on fuel distribution have been conducted in the rest of Spanish regions affected by the ‘Prestige’ (po, lc, lu and bc in Figure 1). In Asturias, sampling was restricted to a limited number of sites distributed along the coast, while in Cantabria the whole coast was inspected. To homogenize data treatment, the coastline of Cantabria was divided into segments of a length (633 m) equal to the average length of segments on the Asturian coast (633 ± 456 m, mean ± SD, N = 57, range = 50 to 2086 m). Estuaries and beaches that were cleaned immediately after the oil spill were eliminated from the analysis to obtain an unaltered picture of the fuel wave imprint. The length of all segments and oil spots was measured at the same map scale (1:25000), to minimize length distortions due to the fractal-like nature of the coastline.
Observations were done in accordance with the Shoreline Assessment Job Aid by the US National Oceanic and Atmospheric Administration (NOAA) (http://response.restoration.noaa.gov/shor_aid/shor_aid.html). Data were recorded in slightly modified versions of the NOAA Shoreline Assessment Forms (http://response.restoration.noaa.gov/oilaids/shore/shore.html). We registered all oiled patches within each segment of shore and estimated their length, orientation and fuel coverage. Visual estimates of oil coverage for each patch were binned into discrete categories (0 for no oil, 1 for patch with <1% coverage, 2 for 1–10%, 3 for 11–50%, 4 for 51–90% and 5 for 91–100%) which were then treated quantitatively. Patch width perpendicular to the shoreline was not recorded, although the vertical distribution of the patches was restricted to the upper littoral (see results). We used three estimates of fuel impact for each segment. First, the proportion of shore affected in each segment, calculated as the sum of the lengths of all oiled patches in the segment divided by the segment length. Second, the impact intensity, calculated as the average of the oil coverage index for all patches in the segment, weighed by the patch length. Third, an impact index, calculated as the product of the two previous indices.
On the basis of circulation patterns of the oil patches along the northern Spanish coast (García-Soto, Reference García-Soto2004), we expected lower fuel impact west of Cape Peñas, and higher impact east. For this reason, we divided our study area into two zones, one west and another east of Cape Peñas. To check for differences between observation teams, we further subdivided the group of observations east of Cape Peñas into a subgroup comprising observations conducted by the Asturian team and another subgroup comprising observations conducted by the Cantabrian team. Thus, we have considered three zones: west Asturian (Was), east Asturian (Eas) and east Cantabrian (Eca). Statistical significance of differences in proportion of segment affected, coverage index and impact index between Was, Eas and Eca were assessed by means of a Kruskal–Wallis non-parametric, one-way comparison.
RESULTS
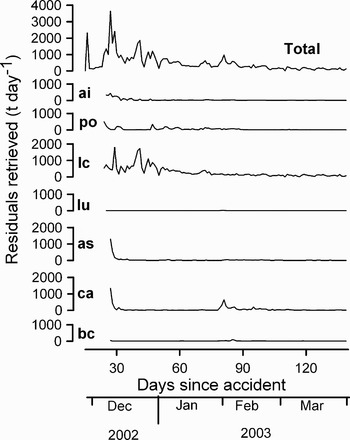
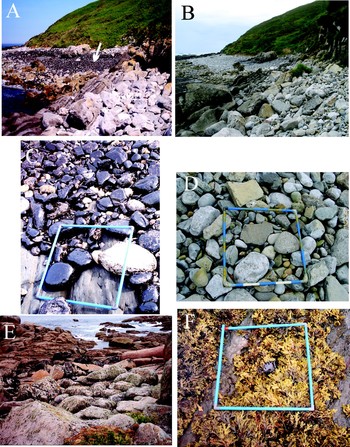
Fuel deposition occurred mainly during the two months following the accident, with the exception of a peak that occurred in the Cantabrian region by the end of January 2003 (Figure 2). In Asturias and Cantabria, most of the oiled debris was retrieved during the first few days after fuel arrival on 5–6 December, which suggests that fuel arrival to the coast was almost simultaneous in these provinces (Figure 2). Cleanup of oiled debris was more intense at the La Coruña province, which was the main impact site, followed by Asturias and Cantabria, while it was negligible at the extremes of the Cantabrian coast, in the province of Lugo and in the Basque Country (Figure 2). This indicates that fuel deposition concentrated on the central part of the Cantabrian coast, where we conducted our detailed research on fuel distribution. Two years after the spill, most of the fuel had already been removed by wave action (e.g. Figure 3A, B, C & D), although some remains can still be detected underneath blocks.
Time evolution of the residuals retrieved from the coast at the different Spanish regions: ai, Atlantic Isles National Park; po, Pontevedra; lc, La Coruña; lu, Lugo; as, Asturias; ca, Cantabria; bc, Basque Country (see Figure 1 for geographical location). Before 6 November 2002, only the total was recorded, although all of it belonged to La Coruña. In other regions, the graph starts at about the same date that they received the first fuel wave. Data for this graph were collected from the web page of the Spanish Ministry of Environment, where they were published daily.

(A) Situation of ‘Vidiago’ Beach (43° 24′ 4″ N/4° 39′ 20″ W) 23 March 2003, 4 months after the oil spill. The white arrow indicates a dense patch of fuel on a boulder beach at the upper intertidal; (B) situation of the same spot 15 September 2004, almost 2 y after the ‘Prestige’ oil spill. Most of the fuel has already been removed by wave action; (C & D) details of boulders at the same beach, same dates; (E) situation of the upper intertidal at Punta Lobeira (43° 11′ 39 ″ N/9° 7′ 1″W) at the ‘ground 0’ area in La Coruña, Galicia (co in Figure 1). Note that the patches of fuel are distributed on and among lichens at the supralittoral band; and (F) a rare sight: a patch of fuel deposited on Fucus sp. at the ‘Luanco’ beach (39° 5′ 46″ N/46° 41′ 6″ W), photographed 2 June 2003.

During our survey, all fuel patches were located at the supralittoral level, dominated by terrestrial lichens such as Xanthoria spp. or Caloplaca spp. and the upper littoral, dominated by the marine lichens Verrucaria spp., dense populations of the snail Melaraphe neritoides and a lower band dominated by barnacles of the genus Chthamalus or the snail Littorina saxatilis (Figure 3E). In the area of Cape Peñas, the transition between the supralittoral and the upper littoral is approximately located at 4.5 m above the lowest astronomical tide (Fernández & Niell, Reference Fernández and Niell1982; Anadón, Reference Anadón1983). Further inspection of the coast during the following summer revealed that fuel could impact and remain in the low intertidal during neap tides and calm conditions (Figure 3F).
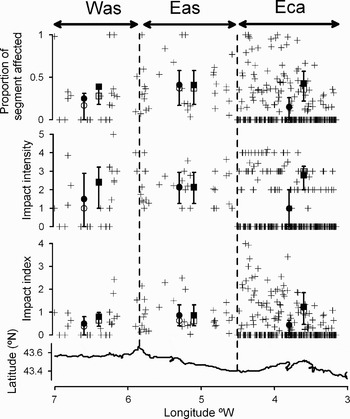
A total of 62% (15 out of 24), 100% (33 out of 33) and 35% (91 out of 256) of the segments surveyed contained patches of fuel in regions Was, Eas and Eca respectively (Figure 4). Differences in the proportion of oiled segments between regions (Asturias vs Cantabria, that is, Was and Eas vs Eca) might reflect differences in the observational protocol. Exposed shores were accessed by boat in region Eca, but were not visited in regions Was and Eas. As a consequence, the Eca dataset includes less accessible, more exposed, vertical shores where fuel deposition was less intense. In contrast, observations in Was and in Eas were conducted by the same team and following the same protocol. Thus, differences in the percentage of fuelled segments between Was and Eas can be unambiguously attributed to differences in fuel deposition patterns.
Plot of the proportion of segment length affected, the impact intensity and the impact index for all of the segments considered in the study vs the geographical longitude. Also represented are descriptive statistics for segments belonging to the three regions considered: Was (west of Cape Peñas, in Asturias), Eas (east of Cape Peñas, in Asturias) and Eca (east of Cape Peñas, in Cantabria). Filled and empty circles represent the mean and median for all segments in the region. Filled and empty squares represent the mean and median for all segments in the region but excluding those not impacted by fuel. Error bars join the 25 and 75% percentiles.

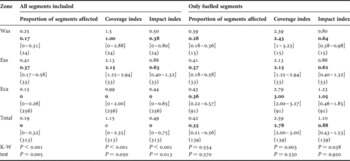
The mean (median) fraction of shore length affected was 0.25% (0.17%) in Was, 0.41% (0.37%) in Eas, and 0.15% (0%) in Eca; the coverage index was 1.50 (1.00) in Was, 2.13 (2.15) in Eas and 0.99 (0) in Eca and the the impact index was 0.50 (0.38) in Was, 0.86 (0.63) in Eas and 0.44 (0) in Eca (Table 1; Figure 4). There were highly significant differences between the three regions for the three estimates of impact (Kruskal–Wallis test, P < 0.001, Table 1). This effect is a consequence of a higher proportion of non-impacted segments in the Eca data set, since the significance of the tests drops abruptly when non-impacted segments are removed from the analysis (Table 1). The three impact indices differed significantly (P < 0.05) or marginally significantly between Was and Eas (Table 1). In other words, Was was more impacted than Eas. However, the fact that these differences disappear when non-oiled segments are excluded from the analysis (P > 0.5 in all three cases, Table 1), indicates that Was is less impacted than Eas because there were more impacted segments at Eas, not because the impacted segments were more severely affected.
Mean, median (bold), 25 and 75% quartiles (in brackets) and number of observations (between parentheses) for the proportion of segment length affected, coverage index and impact index, in all three regions considered and in the total. Descriptive statistics are presented for all of the segments, and for segments impacted only, as well as P values of the Kruskal–Wallis (K-S) non-parametric, one-way comparison between all three groups (upper figure) and between Was and Eas only (lower figure). See also Figure 3.

Was, west Asturian; Eas, east Asturian; Eca, east Cantabrian.
DISCUSSION
Our study represents a snapshot of fuel arrival to the northern Spanish shores following the ‘Prestige’ oil spill, because the coast was hit by a very brief, quasi-simultaneous fuel wave, followed by much less intense fuel deposition thereafter (Figure 2). Rapid initiation of a volunteer observational programme on the northern Spanish coast was also fundamental, because fuel deposited on the coast was rapidly removed by wave action (Figure 3), thus studies initiated later than summer 2003 would have severely underestimated fuel deposition.
The imprint of the ‘Prestige’ on the northern shoreline was extensive, but not intensive. On average, only 19% of the shoreline was affected by fuel, and the fuel coverage in fuelled patches was less than 10% (i.e. a fuel coverage index of less than 3 for all fuelled segments pooled, Table 1). Because of the sampling protocol, that excluded very exposed coastal areas, these figures are probably overestimated in Was and Eas, while the estimation for Eca is probably closer to the actual extent of the areas impacted by fuel. These figures are consistent with low fuel contents measured during the winter of 2002–2003 in shelf sediments (IEOhttp://www.ieo.es/prestige/resultados.htm) and the water column (IEOhttp://www.ieo.es/prestige/resultados.htm) off the Cantabrian coast. They are also consistent with absent or mild ecological impacts of the fuel on plankton (Varela et al., Reference Varela2006), rocky intertidal communities (Lobón et al., unpublished), and cell and tissue condition biomarkers in mussel, hake and anchovy (Labarta et al., Reference Labarta, Fernández-Reiriz, Garrido, Babarro, Bayona and Albaigés2005; Marigómez et al., Reference Marigómez, Soto, Cancio, Orbea, Garmendia and Cajaraville2006) on the Cantabrian coast.
Fuel deposition occurred at the supralittoral level, probably due to a combination of tidal and weather conditions. Fuel arrival to the Cantabrian Coast coincided with a period of spring tides, and maximum tidal height was probably higher during that period due to the prevailing rough sea conditions and low barometric pressures. This was a fortunate situation, since the upper littoral zone on the Cantabrian coast is characterized by a low diversity community dominated by lichens and barnacles (Fernández & Niell, Reference Fernández and Niell1982; Anadón, Reference Anadón1983), and these organisms seemed highly resilient to the effects of fuel (Figure 3E). Our observations of fuel deposition on macroalgae during the summer following the ‘Prestige’ accident (Figure 3F), indicate that fuel can be deposited at lower intertidal levels during calm weather and neap tides, although these fuel patches were rapidly removed by wave action (personal observation).
Fuel deposition was spatially heterogeneous along the northern Spanish coast. The Asturian coast east of Cape Peñas was more impacted than the Asturian coast west of Cape Peñas (Table 1; Figure 4), and, according to cleanup data, the central Cantabrian coast, comprising Cantabria and Asturias, was more impacted than the extremes, Lugo to the west and the Basque Country to the east (Figure 2). This agrees with aerial and satellite observations showing that the bulk of the fuel spilled before the ‘Prestige’ sank, approached the Cantabrian shores east of Cape Peñas, probably with a main contribution of the IPC to fuel transport and some contribution of winds (3.3% of the wind intensity, Montero et al., Reference Montero2003; 3%, García-Soto, Reference García-Soto2004; 2%, Álvarez-Salgado et al., Reference Álvarez-Salgado, Herrera, Gago, Otero, Soriano, Pola and Garcia-Soto2006). Satellite-derived maps of ocean surface temperature and altimetry (García-Soto, Reference García-Soto2004) and oceanographic observations (Quintana et al., Reference Quintana, Lavín and Arteche2004; Ruiz-Villareal et al., Reference Ruiz-Villareal, González-Pola, Diaz del Río, Lavín, Otero, Piedracoba and Cabanas2006) show that the IPC took place off the coast of northern Spain during the winter of 2002–2003, following the ‘Prestige’ accident. Certainly, at Cape Estaca de Bares the IPC is deflected offshore by the presence of a wide continental shelf which occupies the region covering Lugo and the portion of Asturias west of Cape Peñas (Was, see Figure 1 for locations; Pingree & Le Cann, Reference Pingree and Le Cann1990), which was less impacted by the fuel. At the level of Cape Peñas the slope regains proximity to the coast, which would explain why the region east of Cape Peñas was more impacted by the fuel.
A difference in measurement protocol has rendered our comparison between regions (Asturias vs Cantabria) unfeasible. In Spain, management of coastal areas depends on the Autonomous Communities, not on the central government, thus crisis management varied spatially. Assessment of spatial patterns of fuel deposition was absent in the Galicia (which comprises the coastal provinces of Pontevedra, La Coruña and Lugo) and Basque Country Autonomous Communities; moderate, volunteering in the Asturian Autonomous Community, and institutionally supported in the Cantabria Autonomous Community (Figure 1). These contrasting approaches are responsible for the lack of an integrated, homogeneous, event-scale assessment of coastal fuel deposition patterns following the ‘Prestige’ oil spill. The contrast between the spatial scales of the fuel spill and the fragmentation of political action had also collateral consequences. For example, fishermen's claims for the closure of coastal fisheries were more intense east than west of Cape Peñas in the Asturias region. However, these fisheries had to be managed uniformly by the Asturian Autonomous Government, even though a rapid monitoring would have revealed that fishermen's claims were supported by observed spatial heterogeneities in fuel deposition. In conclusion, oil spill response protocols should be planned considering a range of realistic scales of the spills, not to the scale of political territories. Scientific monitoring of the fate and effects of spilled pollutants should be activated immediately after the disaster, and should follow previously tested protocols. Basic knowledge of the dispersal mechanisms involved, such as that reported in this paper, should help in defining these scales and protocols.
ACKNOWLEDGEMENTS
We are greatly indebted to the students L. Fernández, A. García, C. García-Comas, F. González, J. Höfer, C. Lobón, D. Menéndez, I. Naredo, L. Macías, P. Núñez, R. García, M. Rimada, M. A. Rodríguez, M. E. Santamaría, C. Santín, A. Segura, A. B. Suárez, S. Teijeiro, L. Terente and B. Villazán, who volunteered for fuel sampling and to J. Oliveros for his technical assistance. The University of Cantabria was financed by a special contract with the Cantabria Autonomous Government. Financial support during the late stages of the study came from a fellowship from the Ministry of Education for the improvement of higher education (MEC-03-EA2003-0066).