

1. Introduction
A traditional view holds that British capital exports contributed to higher foreign incomes and stronger growth in the late nineteenth century (Fishlow Reference Fishlow1985; Foreman-Peck Reference Foreman-Peck1994; Collins and Williamson Reference Collins and Williamson2001). Indeed, the areas of recent European settlement such as Australia, Canada, the United States, and even parts of Argentina and Brazil enjoyed high incomes witnessing extended periods of strong economic growth. Capital inflows, coming largely from Great Britain, also mushroomed prior to 1913. In theory these inflows should have boosted the marginal product of labor (and other inputs) and raised incomes in the medium term via accumulation. The conventional view is that foreign capital-funded infrastructure such as railroads, harbors and municipal public works raised productivity.
Other factors lurk in the background. The correlates of strong ‘catch-up’ growth and high steady-state income levels such as human capital, a low dependency ratio and an abundant natural resource endowment were the primary determinants of these capital inflows (Clemens and Williamson Reference Clemens and Williamson2004). Schularick and Steger (forthcoming) control for these factors and endogeneity, finding a positive marginal impact of capital inflows and growth during five-year periods between 1880 and 1913 due to a strong correlation between capital inflows and investment. We continue further in this vein, exploring three unexplored facets using a cross-country comparative approach.
First we investigate the relation between changes in income per capita and foreign capital over short and long horizons. Different growth models have different implications for the time period over which capital flows should matter for incomes and growth rates of income.
Second, we look for evidence that the sector to which foreign capital was directed mattered for the relationship between inflows and incomes. Investment in the many large infrastructure projects of the past may have affected growth differently than inflows of foreign portfolio capital for ‘government’ purposes.
Third, we link the recurrent financial crises and income volatility of the late nineteenth century to capital inflows. In today's reincarnation of globalization, financial crises have been blamed on premature capital account liberalization in emerging markets, but even the overall impact of these shocks are still debated (Kose, Prasad, Rogoff and Wei Reference Kose, Prasad, Rogoff and Wei2006). Rancière, Tornell and Westermann (Reference Rancière, Tornell and Westermann2008) argue that financial crises cause significant income losses in capital-importing countries. However, they also suggest capital inflows deliver rapid growth in non-crisis periods, which is likely to offset the negative effects of crises. Countries with high capital inflows grow faster on average than countries with low capital inflows. Other evidence suggests, to the contrary, that capital controls in the post-World War II period have protected countries from financial crises and hence raised growth (Eichengreen and Leblang Reference Eichengreen and Leblang2003). Which, if any, of these dynamics obtained further back in the past? We investigate by looking at the long- and short-run association between capital inflows and income losses via their tendency to raise the probability of a banking, currency or debt crisis.
Looking to the past can be useful for guidance on how capital inflows matter. Researchers of today's ‘globalization’ have not come to a clear consensus on the growth impact of foreign capital flows, but their time period of observation has been relatively short, the number of less developed countries willing to completely liberalize has been small and, arguably, the rules of the game have changed considerably since central banks, fiscal authorities and multilateral institutions often intervene in market outcomes. History provides insight into a world without these constraints.
2. International capital markets and economic growth, 1880–1913
International capital flows were an important feature of late nineteenth-century globalization (Cottrell Reference Cottrell1975; Edelstein Reference Edelstein1982; Davis and Huttenback Reference Davis and Huttenback1986; Obstfeld and Taylor Reference Obstfeld and Taylor2004). To understand the role of foreign capital, there are a number of challenges including measuring the amount of integration, discerning whether capital simply chased other factors and flowed to areas with higher potential for growth (i.e. endogeneity) and how much capital's impact depended on local conditions such as property rights, credible commitments, local financial development and other institutional factors. Finally there are more transparent theoretical and empirical identification issues. We discuss each in turn.
2.1. Measuring integration prior to World War I
Several different data sets measure net capital inflows in the nineteenth century. Indirect measures are available using the current account and the balance of payments accounting identity but only for a limited set of countries. These do not generally contain reliable information on data from income earned on foreign investments, transfers and ‘invisible’ services.
A popular direct measure is based on capital issues on the London financial market recorded in the financial press and other primary sources. Leland Jenks and Matthew Simon used such sources, and their data are re-compiled in the ‘capital calls’ data published by Stone (Reference Stone1999). These come largely from information on new equity and bond issues in London which were listed in the Investors’ Monthly Manual, though researchers relied on many other leading financial newspapers, parliamentary reports and prospectuses as documented in Stone (Reference Stone1999, appendix A).
In the original data, the use of other reports and a detailed analysis of each security allowed Simon to ascertain the actual amount of money paid by investors to the issuer. That said, the actual amount of new ‘real’ or physical investment abroad is obviously not equal to the value of the press-reported ‘capital calls’. New physical investment would depend on the use to which such funds were put and where they were used. This is why the literature on British capital flows before 1913 distinguishes between financial capital and real capital transfers. Also the ultimate purchaser of the securities listed would affect the amount of net capital flows to the issuing country. In this regard, it is not clear that 100 percent of all purchasers were British residents, but a reasonable assumption is that assets issued abroad and at home simultaneously were a small portion of overall capital issued. Stone's data are also better at tracking portfolio capital flows than short-term flows of capital and long-term direct investment.
The literature on measuring nineteenth-century capital flows is voluminous and scholars such as Davis and Huttenback (Reference Davis and Huttenback1986) have produced alternative series, but still, their series correlate with those from Stone (Reference Stone1999) with a correlation coefficient of 0.92 (Davis and Huttenback Reference Davis and Huttenback1986, p. 37). Stone's data on capital calls also correlate highly with current account data in Jones and Obstfeld (Reference Jones and Obstfeld2003). A regression of the ratio of the current account deficit to GDP on the ratio of capital calls to GDP with country-fixed effects yields a coefficient of 0.38 (t-statistic = of 5.26), and raw correlation coefficients are higher.
2.2. Where did the capital go?
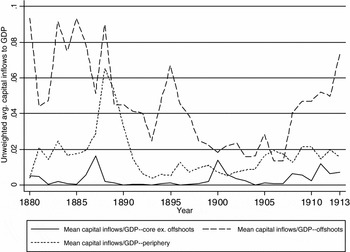
Figure 1 shows within-group average ratios of capital calls to GDP in three types of countries: institutionally advanced core (Belgium, Denmark, Norway, Sweden and Switzerland), the British offshoots (Australia, Canada, New Zealand) plus the United States, and the poorer regions of the world (Argentina, Austria–Hungary, Brazil, Chile, Egypt, Finland, Greece, India, Italy, Japan, Mexico, Portugal, Russia, Spain, Turkey, Uruguay). Foreign investment often equalled up to 20 percent of total capital formation in the typical developing country of the time and up to 50 percent in Australia, Canada, Argentina and Brazil (Fishlow Reference Fishlow1985; Williamson Reference Williamson1964; Edelstein Reference Edelstein1982).
Average levels of the ratio of capital inflows to GDP for different types of capital importers, 1880–1913

Up to 40 percent of all British lending between the 1860s and 1913 went to the British Empire, and, of this portion, the bulk ended up in Canada and Australasia. Ferguson and Schularick (Reference Ferguson and Schularick2006) argue that lending within the British Empire required a lower risk premium than other similar countries outside of the empire. Property rights and political ties were stronger within the empire and other institutions, such as the Joint Stock Acts, increased demand for colonial assets.
Clemens and Williamson (Reference Clemens and Williamson2004) take issue with this market failure view and suggest that factor endowments mattered more for the direction of these flows. Canada, the various colonies of Australasia and other new world regions such as the USA which received heavy inflows (both relative to local GDP and in terms of overall British outflows) were richly endowed in natural resources, high in human capital and scarce in labor and physical capital. Such a combination made for the expectation of a relatively high rate of return on investment. After controlling for these factors, they find that the British Empire did not receive greater inflows from Britain than other comparable regions.
2.3. What happened to the capital inflows?
Stone reports three categories of activity to which capital flows were destined: government, railways and private non-railway. The government category accounted for about a third of British capital exports. This category included bonds carrying guarantees provided by local governments on interest payments for private and state-owned railways. The countries that devoted the largest share of the inflows to government uses were Norway, Denmark, Greece and Japan. Railways (fully private concerns in terms of ownership) captured close to a third of British capital exports between 1880 and 1913. Over 80 percent of these outflows went to the US, Canada, Argentina and India. The US, Argentina and Canada were also amongst those that devoted the highest share of their inflows to railways. Finally, the ‘private’ category included investments in utilities (sewage, water treatment, electrical generation etc.), financial firms, raw materials extraction, and other industrial and ‘miscellaneous’ enterprises. Austria, France and Germany devoted high shares of their inflows to this category.
Information from sovereign bond prospectuses published in Fenn on the Funds can also be examined as an imperfect way to gauge the intended uses of foreign capital. The colonies of Australasia, South Africa, and Canada borrowed almost exclusively to fund railroads, harbors, sewage systems and other infrastructure. Fenn's summary of investments in these places reported, ‘the vast majority of funds have been for internal improvement’. Other countries, such as Russia (an issue to strengthen the specie [reserve] fund), Japan (to pay charges on pensions), Egypt (Pasha loan for repayment of existing debt) and Austria (an issue in 1851 to improve upon the value of the paper florin), borrowed to plug revenue gaps or to fund offensive, defensive and civil wars.Footnote 1 If substantial flows to such countries ended up on wasteful or inefficient projects or merely consumption, then capital flows might not have been associated with any permanent increase in incomes. We now turn to a more formal investigation of these relationships.
3. Economic growth and foreign capital: some testable hypotheses
3.1. Foreign capital and economic growth in a neoclassical world and beyond
What does basic theory say about the relationship between economic growth and capital flows? The effect on growth of a sustained rise in the level of capital inflows is transitory in a neoclassical growth model (Henry Reference Henry2007).Footnote 2 Opening up simply accelerates a country towards its steady state. A permanent rise in inflows would be associated with a permanent rise in the level of income per capita as if domestic savings rates permanently increased. Booms and busts in capital inflows might be associated with alternate periods of high and low growth relative to a steady-state trend growth value. Long-run growth rates depend only on the growth rate of total factor productivity. Furthermore, Gourinchas and Jeanne (Reference Gourinchas and Jeanne2006) argue that capital inflows make a long-lasting impact on growth if they accompany an unobserved change in the steady-state potential of a country or when they improve the growth rate of total factor productivity. Contrary to the neoclassical view, in an endogenous growth model of the ‘AK’ variety, the growth rate would depend directly on the investment rate. As long as investment is sustained, growth rates and incomes rise. There is also a possibility of a long-run impact on income since foreign capital frequently funded large infrastructure projects (Williamson Reference Williamson1964; Cottrell Reference Cottrell1975; Eichengreen Reference Eichengreen1995, p. 79). These lags could occur via their delayed impact on market access, improved public health or incentives for urbanization.
3.2. Capital flows and financial crises: an indirect association between growth and capital flows
Balance of payments problems, sudden stops of net capital inflows, and crises were part and parcel of international financial markets between 1880 and 1913 (Bordo, Eichengreen, Klingebiel and Martínez-Peria Reference Bordo, Eichengreen, Klingebiel and Martinez-Peria2001; Bordo, Cavallo and Meissner Reference Bordo, Cavallo and Meissner2010). Crises were rare, but the average country could expect some sort of crisis every 15 years or so (Bordo and Meissner Reference Bordo, Meissner, Edwards, Esquivel and Márquez2007). These arguably occurred due to foreign capital inflows. If so, there may be an indirect negative impact of capital flows on income since crises are associated with lower incomes.
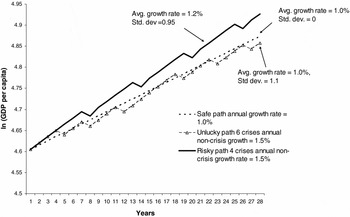
Still, crisis-prone countries might appear to grow faster on average. Rancière, Tornell and Westermann (Reference Rancière, Tornell and Westermann2008) build a growth model based on the idea that systemic financial crises (i.e. periods of inefficiently low investment and growth below trend) are the side effect of receiving foreign capital flows. There are two key necessary conditions for the Rancière et al. finding. First, the economy benefits from a systemic bailout in the event of a crisis and, second, that contract enforcement problems exist but are neither too severe nor too mild. When this is so, agents take on foreign debt, use leverage to increase returns and investment, and growth is higher than without foreign inflows. Along this equilibrium path, however, a time-invariant and exogenous probability of crisis and crash exists. Countries receiving the most foreign capital and hence occasional large crises, or in their terms, high skewness of the growth of real credit, grow faster on average. However, even in the former case there are ‘unlucky’ paths where even such economies fail to grow faster than countries which take the safe path and do not borrow abroad. Figure 2 illustrates three possible paths of output for hypothetical countries consistent with the model studied in Rancière et al. (Reference Rancière, Tornell and Westermann2008) and similar to their figure II. The risky paths represent two dynamic equilibria with capital inflows and the same ex ante probabilities of a financial crisis. They are distinguished ex post due to a different number of realizations of crisis events, and the lower ‘unlucky’ path is unable to attain higher long-run growth for this reason only. In the long run, or with a larger number of paths represented, the cross-sectional distribution of incomes would be representative of the long-run distribution of paths under capital inflows. The cross-sectional mean growth rate and mean income levels would be higher than in the ‘safe’ no capital inflows equilibrium.
Hypothetical evolution of GDP per capita for three kinds of countries

4. Growth and international capital market integration: the empirical evidence
4.1. A preliminary look at the data
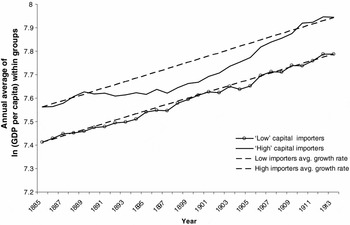
Figure 3 displays actual time-series paths of the logarithm of GDP per capita between 1885 and 1913. In Figure 3 we study two groups of countries: ‘high’ capital importers having an average ratio of capital inflows to GDP above the median of the average within country capital flow ratio (taken over the period 1885–1913).Footnote 3 In our sample this is a ratio above 0.63 percent of GDP. The countries in the ‘high’ group are Argentina, Australia, Brazil, Canada, Chile, Mexico, New Zealand, Norway, USA and Uruguay. The ‘low’ group consists of Austria, Denmark, France Germany, India, Italy, Japan, Portugal, Spain and Sweden. A trend is also plotted in Figure 3 which is calculated as the average growth rate of the average level of the natural logarithm of GDP per capita within each group. There is no significant difference in the trend rates: they are 1.3 and 1.4 percent per year for the low and high groups respectively.
Real GDP per capita and capital inflows to GDP, 1880–1913

This similarity masks a long period of below-trend growth for the ‘high’ receivers in the 1890s and a period of above-trend growth beginning roughly in 1900. The period between 1890 and 1900 was marked by a major financial crisis in Argentina, several other recipients (Australia and the US amongst them) and London. This led to a major slowdown in global capital inflows. The first decade of the twentieth century witnessed a resurgence in capital flows.
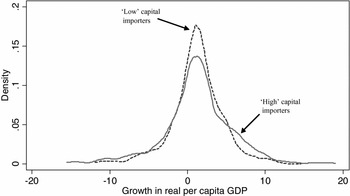
Despite the apparent similarity in trend growth, there is evidence of slightly higher volatility in the ‘high’ importing countries. Figure 4 presents a kernel density plot of average growth rates for the ‘high’ and ‘low’ groups. This evidence suggests that the ‘high’ capital importers faced somewhat more volatile growth rates without substantially altering their mean long-run growth rate of per capita GDP.
Kernel density plot of annual growth of GDP per capita for ‘high’ and ‘low’ capital importers, 1885–1913

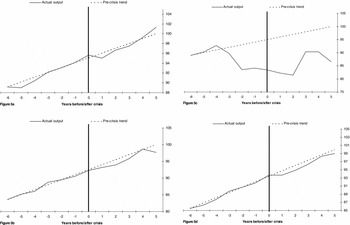
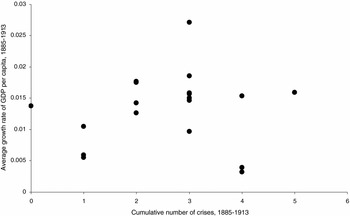
Figures 5a–5d provide further evidence on the relation between crises and income levels. Average income levels across countries are calculated in a window beginning six years before all the way to five years after banking, currency and debt crises as well as an indicator equal to one if any type of financial crisis occurred.Footnote 4 We include here only the first year of any type of crisis. The dashed line represents the average growth rate for the countries in a window from six to three years before the crisis event. We stop the trend calculation three years prior to the crisis to avoid including abnormally high growth rates in the midst of economic booms. The trend is indexed relative to its value six years after the crisis and the deviation from this trend in index points is given by the solid line. The figures suggest medium-term recovery from banking and currency crises but not from debt crises. In the short to medium run (between zero and three years) the income losses from these crises are quite visible. The data suggest a loss of 1 percent of income relative to the trend in the first, second and third years after a crisis for a cumulative loss of roughly 3 percent of income relative to trend (Figure 5d). We see no return to pre-crisis trend levels even after six years. Figure 6 shows that in the long run there was no significant relationship between average growth rates and financial crises.
(a) Output per capita, trend output per capita and banking crises. (b) Output per capita, trend output per capita and currency crises. (c) Output per capita, trend output per capita and debt crises. (d) Output per capita, trend output per capita and any type of crisis

Average growth of GDP per capita, 1885–1913 and the cumulative number of crisis events, 1885–1913

The evidence from Figures 3 through 6 is not fully consistent with that from the recent period. Rancière et al. (Reference Rancière, Tornell and Westermann2008) report that over 10-year periods, between 1961 and 2000, countries in their sample with financial crises tend to grow on average faster. Although crises bring income down, the growth rates of these economies are strong enough preceding these events to make for higher average growth rates. We find no evidence of this type of relationship in the nineteenth century even if we control for other determinants of long-run growth. Growth rates are perhaps somewhat stronger coming out of crises relative to pre-crisis trends, as Figures 5a–5d highlight, but not sufficiently high for long enough to make for higher-trend growth. We discuss below whether this is because the countries of the late nineteenth century found an ‘unlucky’ path, as illustrated in our Figure 2 and figure II of Rancière et al., or whether the assumptions made in Rancière et al. are invalid for the late nineteenth century.
Still, findings more consistent with ours are available. Sebastian Edwards (Reference Edwards2007) demonstrates that Latin American economic growth in the late twentieth century was significantly below trend due to sudden stops and current account reversals. Eichengreen and Leblang (Reference Eichengreen and Leblang2003) study the period 1880–1913 together with the subsequent 100 years. They conclude that capital controls are associated with higher growth, crises are associated with lower growth, and that capital controls limit the probability of a crisis which should lead to lower volatility. Rancière, Tornell and Westermann (Reference Rancière, Tornell and Westermann2006) also investigate the impact of capital market liberalization (1980–2002) on annual growth in GDP per capita and an indirect channel going from liberalization to crises and back into (lower) growth. They find a direct positive effect of liberalization on growth in the short run and a negative indirect effect on growth via crises. Countries have higher growth rates (on the order of one percentage point faster) after liberalization, but crises, associated with liberalization, bring output down by 10 percent.
4.2. Multivariate regression-based evidence
Multivariate econometric estimation of the impact of capital flows and crises on growth is complicated since the time horizon over which one measures the outcomes of interest matters. Of course, estimating growth regressions in a cross-country panel raises many other econometric issues including endogeneity, heterogeneity and model selection in addition to data measurement problems. Yet these pitfalls must be gauged against the benefits of a comparative approach, which include: the ability to control for unobservable heterogeneity, common factors across countries and the possibility of finding general relationships in the data.
Figure 2 illustrates how identification of the impact of capital flows in the data may be difficult. Assume that countries that receive more capital grow faster and take the country-year as the unit of analysis. In any given non-crisis year, the country more open to foreign financing will be growing more rapidly. In a crisis year, however, growth and output may be lower, but (by assumption here) crises are directly related to capital inflows. A regression of growth of GDP per capita on capital flows and other controls, without controlling for crises, biases downwards the coefficient on capital inflows. Also changing the time unit of observation to five-year periods (cf. Schularick and Steger forthcoming), 10-year periods (cf. Rancière et al. Reference Rancière, Tornell and Westermann2008) or 30-year periods (cf. Prasad, Rajan and Subramanian Reference Prasad, Rajan and Subramanian2007) could dramatically change inference depending on when crises occurred within the chosen windows. Finally, if there are diminishing marginal returns to capital, the identification of the positive growth impact of capital flows in a long time span could be even harder to disentangle from the negative side effect on long-run growth of the cumulative number of crises. Both factors would be bringing the growth rate downwards over the long run.
4.3. Long- and short-run associations between GDP per capita, capital inflows and crises
4.3.1. Model and data. In what follows we attempt to remedy these issues by employing an autoregressive distributed lag model (ARDL (p, q)) for the logarithm of real GDP per capita. An error correction representation of the model allows study of short-run and long-run relationships between capital flows, crises and output per capita. Our estimating equation is

The dependent variable in equation (1) is the annual change (denoted by Δ) in the logarithm of real GDP per capita (y). Short-run associations between variables on the right-hand side of equation (1) and GDP per capita are captured by using annual changes in the explanatory variables (X). Further lags in these changes yield an indication of the medium-run impact of such variables.
Long-run relationships between GDP per capita are isolated in the error correction term in square brackets. The error term, ε, is a composite error term consisting of year dummies, country fixed effects and country-time idiosyncratic white noise errors. We report the product of long-run coefficients β and the speed of adjustment ϕ below.
Our dynamic fixed effects model (1) assumes common transition dynamics across countries. Pesaran and Smith (Reference Pesaran and Smith1995) analyze another two approaches under heterogeneity of the coefficients. One is to allow for differences in the short-run coefficients across countries (pooled mean group estimator) and the second admits differences in the short-run and long-run coefficients (mean group estimator).Footnote 5 We consider the former below. Another benefit of this method is that inclusion of sufficient lags of the variables of interest can mitigate endogeneity problems. Finally, since we have roughly 30 periods for each country, this estimation approach may be preferable to the system GMM models used by Schularick and Steger (forthcoming) which are suited for ‘large N small T’ panels (Roodman Reference Roodman2007).
Our sample covers the years 1880 to 1913 and includes a minimum of 12 countries for which we have savings data based on Taylor (Reference Taylor2002). These are Argentina, Australia, Canada, Denmark, France, Germany, Italy, Japan, Norway, Spain, Sweden and the United States. Savings is a key control in standard empirical growth models, but it is unavailable for many countries. For comparison we also look at results omitting the savings variable and are able to include eight other countries (Austria, Brazil, Chile, Egypt, India, New Zealand, Portugal and Uruguay) without such data between 1880 and 1913. We also include key growth determinants: the population growth rate, the percentage of the population enrolled in primary school, and the level of exports divided by GDP (Sala-i-Martin, Doppelhofer and Miller Reference Sala-i-Martin, Doppelhofer and Miller2004; Mankiw, Romer and Weil Reference Mankiw, Romer and Weil1992).
To capture the direct impact of global capital market integration we use the ratio of Stone's capital calls to GDP. Finally we control for the impact of crises by creating a variable measuring the cumulative number of financial crises. The crisis could be a currency, banking, twin (i.e. banking and currency) or debt crisis. A banking crisis in one year followed by a currency crisis in the next year is counted as two separate crisis events as are ongoing years of banking, or currency crises. For debt crises, we only code the first year of a debt crisis to avoid including the often long periods without negotiated settlement but in which the economy may have recovered.
The lag structure we use is based on minimization of the Akaike Information Criterion and the Bayesian Information Criterion. We allowed for up to four lags of the difference in capital inflows and up to three lags of the difference in cumulative crises. However, we limited the lags on all other control variables to 0 so as not to ask too much of the relatively small data set. Both information criteria suggest a lag length of 0 for the ratio of capital inflows to GDP and inclusion of the first and lagged difference of the cumulative crisis variable.
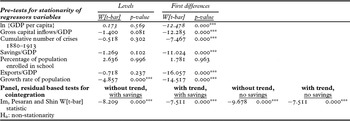
We also report tests for stationarity and cointegration in Table 1. Using the test for unit roots in panel data developed by Im, Pesaran and Shin (Reference Im, Pesaran and Shin2003), we cannot reject that all variables in levels are non-stationary except the growth rate of population. After first differencing (i.e. year-to-year differences), we reject the hypothesis that all variables are non-stationary except the school enrolment rate. In the lower panel of Table 1 we use the Im et al. test on the residuals from country level regressions of the log of GDP per capita on the levels of the right-hand side control variables to test for cointegration between income and these variables. We present tests that account for common time trends, a country-level intercept and with and without country-level trends. These test statistics are given for the two main samples we work with. In all cases we find evidence of cointegration by rejecting the null hypothesis of non-stationarity of these residuals.Footnote 6
Tests for stationarity and cointegration

Notes: The table presents test statistics for unit roots of the levels and differences of the given variables (as indicated) for heterogeneous panels based on Im, Pesaran and Shin (Reference Im, Pesaran and Shin2003). The series are non-stationary under the null-hypothesis. Country-level intercepts, country-level time trends and a common time trend are allowed where indicated. The lower panel conducts unit root tests on the residuals from a regression of GDP per capita on capital flows, cumulative crises, enrollment rates, savings rates, exports to GDP, population growth rates and savings rates (where indicated). A rejection of the null hypothesis is consistent with cointegration between GDP per capita and the other variables.
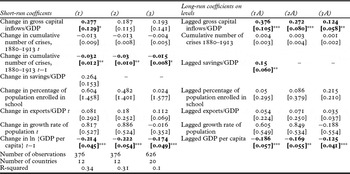
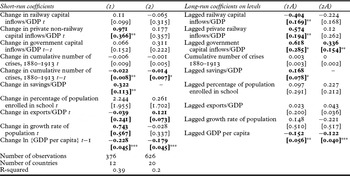
4.3.2. Baseline results. Table 2 shows our results for three baseline models. Robust standard errors clustered at the country level are reported throughout the article. Column 1 presents results for the sample of 12 countries with savings data, column 2 presents results for the same countries without savings and column 3 reports results for the larger sample.
Income per capita, capital market integration and financial crises, 1880–1913

Notes: Dependent variable is the annual change in log{GDP per capita}. Year dummies included but not reported. Hetreoscedasticity robust standard errors clustered at the country level are in parentheses. See the text for precise definitions of variables.
* p-value < 0.1; ** p-value < 0.05; *** p-value < 0.01.
First, rises in capital inflows generally have no statistically significant relationship in the short run with income per capita. Coefficients on changes in capital flows are significant only in column 1. In both samples, there is a positive and significant relationship in the long run between income and capital inflows. This suggests capital flows during the nineteenth century had long gestation lags as discussed above, and it is consistent with the fact that the large infrastructure projects and railways that it often funded took many years to develop. The marginal long-run impact of capital inflows in column 1A is to raise income by 2.02 percent (-1 *(0.376/-0.186)). A one standard deviation rise in the capital inflows to GDP ratio would be associated with a roughly seven percent rise in GDP per capita in the ‘long run’. The speed of adjustment parameter suggests that half of such a gain would be realized in three and a half years. In other words, a rise in inflows of this magnitude could have raised income per capita significantly. Moreover, it would have raised growth rates roughly one half of a percentage point above the average growth rate for five to seven years. The long-run impact in the larger sample is about half of the size of that in column 1.
For both samples, crises bring income down in the year following a crisis. The coefficients are again larger in the smaller sample implying income falls between 1.5 and 3 percent in the short run. This is equivalent to two years of growth for the average country. The long-run coefficients reported on the right-hand panel of Table 2 show that countries’ income levels do not suffer in the long run because of previous crises. This suggests that nations made up for crisis losses in income in the medium term, as is also consistent with Figure 3.
The point estimates on the other coefficients support general results from cross-country growth regressions, although individually many of the variables here are not statistically significant. There is some evidence consistent with conditional convergence based on the fact that lagged levels of GDP per capita are negatively associated with the annual growth rate. Overall, this specification suggests that crises bring incomes down in the short term but not in the longer-term, while capital flows are not associated with higher incomes in the short run but are positively related to income in the long run.Footnote 7
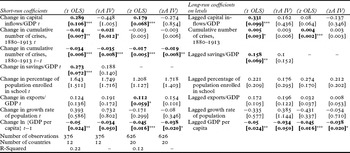
4.3.3. Alternative specifications: the uses of foreign capital. Table 3 investigates whether the uses to which British capital were put led to differential associations with income. By including all three components, collinearity may be clouding the results. In any case, Table 3 shows that there is no strong evidence of a short-run impact in any of these individual categories. The coefficient on the first difference of private inflows is positive and significant in the shorter sample.
Income per capita and the use of foreign capital, 1880–1913

Notes: Dependent variable is the annual change in log{GDP per capita}. Year dummies included but not reported. Hetreoscedasticity robust standard errors clustered at the country level are in parentheses. See the text for precise definitions of variables.
* p-value < 0.1; ** p-value < 0.05; *** p-value < 0.01.
Countries that received higher private and government inflows had higher incomes in the long run. However, larger inflows of railway capital were associated with lower income in the long run, with the coefficient being significant only in the shorter sample. The negative sign on the level of railways investment is indicative of possible problems in collinearity among the regressors. Indeed, the sign on the coefficient on railways is positive when we leave out other forms of investment flows. In both models of Table 3, financial crises are still associated with short-run downturns in income but have no long-run negative impact on income.
4.3.4. Endogeneity of capital flows. It is quite possible that the countries receiving more capital in the nineteenth century also had higher income for unobservable reasons or due to omitted factors. Use of longer lags of GDP in unreported specifications of the regressions and our use of many controls reassures us that we are eliminating the possibility of an endogeneity bias. Still, we attempt an instrumental variables specification of our baseline model as a robustness check.Footnote 8 What we require are factors driving capital inflows un-associated with local unobservable factors.
An earlier literature that studied capital inflows for particular countries discussed push (British) and pull (receiving country) factors that determined the size of capital flows in any given year. Edelstein (Reference Edelstein1982) argued that British investors chose to invest in countries where prospects for growth were good and risk-adjusted payoffs were large. Key ‘exogenous’ push factors were British savings rates and the rate of return on British assets. Other studies of particular countries (Canada, the US and Argentina) suggest that British gross investment was a key exogenous driver of the amount of flows to particular markets. These studies point to the possibility of using British variables as excluded instrumental variables to deal with the endogeneity of capital flows.
In Table 4 we use lagged British investment, its change, and the Bank of England discount rate as instruments for capital flows. In the first stage, we found that the lagged level of inflows was negatively correlated with British investment. These instruments were not particularly strong, however, especially in predicting changes in inflows. Instrumental variables results show that the long-run coefficient on capital flows in column 1A of Table 4 is smaller than its OLS estimate and it is also insignificant. A Hausmann test for exogeneity suggests we cannot reject the exogeneity of capital inflows, implying endogeneity is not a key concern.
Endogeneity in the relation between output per capita and capital market integration, 1880–1913

Notes: Dependent variable is annual growth rate of GDP per capita. Estimation in cols. 1A and 2A is by two-stage least squares. Excluded instruments for capital flows are the lagged level and change in investment/GDP in the UK and Bank of England's discount rate. Hetreoscedasticity robust standard errors clustered at the country level are in parentheses. See the text for precise definitions of variables.
*p-value < 0.1; **p-value < 0.05; ***p-value < 0.01.
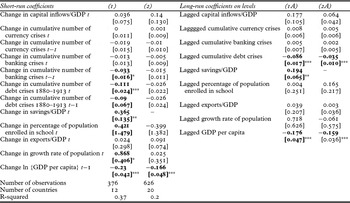
4.3.5. Types of crisis. In the recent literature (e.g. IMF 2009), banking crises have been cited as the most costly type of financial crisis in terms of output losses. Currency crises may be associated with sharp changes in the exchange rate, but their costs may depend heavily on how much foreign debt is denominated in foreign currency, and how much of these liabilities exist (Bordo, Meissner and Stuckler Reference Bordo, Meissner and Stuckler2010). The impact could, in other words, be highly heterogeneous. Debt crises may be costly if countries rely on foreign capital inflows to keep investment high, although releasing a country of the burden of debt may actually raise output in certain cases.
Table 5 breaks the crisis indicator down into these three different types of crisis to see if there are differential impacts on output. Consistent with Figures 5a–5d, it appears that banking crises and debt crises are driving the negative relationships in Table 2. Currency crises are not significantly related to income either in the short or the long run. Banking crises seem to have negative relationships with income in the short run but not the long run. In the larger sample of column 2 in Table 5, the coefficient on the second lag of banking crises is only significant at the 83 percent level. In our smaller sample, the debt crises in Argentina and Spain decrease income by a statistically significant 9 percent in the short run. It also appears that this type of shock is not overcome in the long run since the cumulative debt crisis indicator in levels is significant and negative. In the larger sample, which includes the two previous defaults and those of Portugal, Brazil and Uruguay, the long-run relationship is negative and statistically significant, implying a permanent reduction of 3.5 percent in incomes.Footnote 9
Output effects by type of crisis, 1880–1913

Notes: Dependent variable is the annual change in log {GDP per capita}. Year dummies included but not reported. Hetreoscedasticity robust standard errors clustered at the country level are in parentheses. See the text for precise definitions of variables.
* p-value < 0.1; ** p-value < 0.05; *** p-value < 0.01.
4.4. Crises and capital flows
As discussed above, exposure to foreign capital inflows is likely to heighten the probability of financial crises. If so, capital inflows could indirectly affect income via a financial crisis channel. There are many possible connections between crises and capital flows. High inflows are often associated with sudden stops of capital and sharp depreciations of the exchange rate. If debt is denominated in foreign currency, as it was for many countries in the nineteenth century, this increases the probability of default. Sudden stops and currency crises may also be a function of such fundamentals.Footnote 10 Increased financial globalization can also be associated with a deterioration in monitoring and greater likelihood of crisis and contagion (cf. Calvo and Mendoza Reference Calvo and Mendoza2000). The empirical links between capital flows and crises have been examined in depth elsewhere in our research and that of others (e.g. Radelet and Sachs Reference Radelet and Sachs1998).
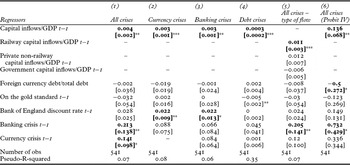
We summarize the relationship between capital flows and an indicator for all crises and separately the three forms of financial crisis (banking, currency and debt) in Table 6. We also test for whether some kinds of capital flows have a stronger relationship with crises than others. The probit models for crises use a parsimonious set of explanatory variables including capital inflows. These include the ratio of foreign currency debt to total (public) debt, whether a country was on the gold standard or not, the Bank of England discount rate and the lagged value of banking and currency crises. In column 6 of Table 6 we present an ‘instrumental’ variables probit model to allow for the possibility that unobservable or omitted factors which were driving the probability of crisis could also influence the level of capital inflows.
The determinants of financial crises, 1880–1913

Notes: Probit estimations are by maximum likelihood. Dependent variables are as listed at the top of each column. See text for further information.
Standard errors are clustered at the country level are in parentheses. See the text for precise definitions of variables.
* p-value < 0.1; ** p-value < 0.05; *** p-value < 0.01.
The results in Table 6 suggest that higher capital inflows were strongly related to a higher probability of having any kind of crisis. In column 5 we find that the marginal effects of railway inflows are statistically significant and positive, but private or government inflows are not statistically significant. This is another possible explanation for the negative relationship between railway inflows and income found in Table 4. The result is consistent with several hypotheses such as maturity mismatch problems or moral hazard arising from implicit or explicit interest guarantees, which were common for these projects. Revenues arising from railways were not immediate since neither construction nor development and settlement around the rail-lines were immediate, but interest payments had to be covered in the short term. Any short-term financing for such projects with long gestation periods could have been withdrawn or not renewed due to external shocks in the capital market, leading to liquidity problems.
In terms of endogeneity, in column 6, the instrumental variables probit suggests an even stronger positive relationship between inflows and crises.Footnote 11 Here a one standard deviation rise in inflows would raise the probability of a crisis by 0.52 – four times the unconditional probability of 0.1.
5. Discussion of the direct and indirect impact of capital inflows
Our comparative exercise suggests a positive association between income and foreign capital. This relationship worked over the medium term because of the nature of nineteenth-century investment. To achieve the higher incomes made possible by capital inflows, growth accelerated typically by one half of a percentage point over five to seven years after a shock to capital inflows. In unreported error-correction models for the growth rate, we found no relationship between the long-run growth rate and higher capital flows.
Rancière et al. argue that capital flows raised growth through a leverage effect, while exposing countries to more frequent crises. This finds some superficial support in the data. However, we are unable to replicate their finding that countries experiencing crises (which are due to capital inflows) experienced significantly higher average growth rates in any decade prior to 1913.
One possibility is that borrowers took on less leverage, which is the channel by which growth rises in Rancière et al. Imperfect enforceability and systemic bailouts drive this result. In the nineteenth century, foreign loans often hypothecated revenues of railways or the customs houses, leading to more severe consequences of default. Imperial relations and other interventions also could have helped enforce contracts (Mitchener and Weidenmier Reference Mitchener and Weidenmier2010). On the other hand, investors may have viewed these actions as insurance inefficiently increasing supply via creditor moral hazard.
The record on bailouts is also mixed. Large banks were sometimes supported by governments in the nineteenth century. In the midst of banking crises, governments gave implicit support to large banks (e.g. on New South Wales, Australia, in 1893 see Hickson and Turner Reference Hickson and Turner2002; on Italy see Luzzato Reference Luzzatto1968). And yet only one bank survived the crisis of 1890 in Argentina and the banking system of Brazil crumbled during the crack of the Encilhamento (Triner and Wandschneider Reference Triner and Wandschneider2005). Still, in Argentina in the 1880s, Eichengreen highlights how investments in railways were guaranteed by the Argentine government. In the US, where no institutional lender of last resort existed, banking crises occurred due to both panic and contagion among depositors but also for fundamental reasons (cf. Ó Gráda and White Reference Ó Gráda and White2003; Moen and Tallman Reference Moen and Tallman1992; Jalil Reference Jalil2010).
Finally, another obvious possibility is that countries in the nineteenth century simply followed an ‘unlucky’ path like that in Figure 2. Even if all of the assumptions in Rancière et al. held, the examination of the realization of the dynamic equilibrium is not sufficient to accept or reject such a theoretical model.
Domestic risk factors mattered for the relation between incomes, capital inflows, sudden stops and crises (Bordo, Cavallo and Meissner Reference Bordo, Cavallo and Meissner2010; Kose et al. Reference Kose, Prasad, Rogoff and Wei2006). A sudden stop with a currency crash and debt crisis was more likely in the nineteenth century in a country with large foreign currency liabilities, low reserves and low openness to trade.Footnote 12 Output losses were largest where such events occurred (e.g. in Argentina and Portugal in the early 1890s). Compare this experience to Canada with three minor currency crises. Although Canada was nearly always above the 90th percentile in terms of capital inflows relative to GDP, it enjoyed strong economic growth on the back of railway investment and other infrastructure development. It also maintained the gold standard peg. This was due to its stable banking system, the political ability to avoid a debt crisis and the trust and support it enjoyed from the global financial markets. Australia and the Scandinavian countries share similar histories. Still, much further research must investigate the regularities and idiosyncrasies in such outcomes.
6. The net benefits of laissez faire financial globalization: some tentative conclusions
Nations relying on capital inflows in the first era of globalization often saw incomes fall moderately to substantially around the time of financial crises. Most appear to have rebounded from these shocks in the long run, leaving nations near their long-run trend incomes; if they avoided crises altogether then foreign capital flows were associated with higher and less volatile incomes.
Particular fundamentals increased the likelihood that capital flows and sudden stops would turn into financial crises with large income drops. These were: foreign currency debt, currency mismatches, financial development. Financial development and credibility in the eyes of international capital markets also seem important.
Finally, foreign financing may also have conferred other benefits such as enhanced risk-sharing and consumption-smoothing opportunities or improved policy. These dimensions of the benefits of integration are beyond the scope of our study but should be investigated since evidence from the last 30 years suggests the real benefits to integration are to be found here (IMF 2007). Also, further investigation into how countries transition from being crisis prone to having credibility, along the lines of Hoffman, Postel-Vinay and Rosenthal (Reference Hoffman, Postel-Vinay and Rosenthal2007), will be fruitful for understanding the long-run evolution of the benefits and costs of participating in a financial system with global reach.
Acknowledgements
Comments from Joshua Aizenman, Dan Bogart, Tim Guinnane, Michael Hutchison, Olivier Jeanne, Paolo Mauro, Kris James Mitchener, Hashem Pesaran, Brian Pinto, Albrecht Ritschl, Moritz Schularick, Alan M. Taylor, Aaron Tornell, the editor Hans Joachim Voth, three anonymous referees and conference participants at the All UC Group Conference at the Huntington Library, World Bank, Strasbourg Cliometrics, the World Economy and Global Finance Conference at Warwick and the Conference on Globalization and Democracy at Princeton University were very helpful. Seminar audiences at Carlos III Madrid, Manchester University, Nova University Lisbon, Paris School of Economics, Trinity College Dublin, UC Santa Cruz and USC also provided generous feedback. Antonio David and Wagner Dada provided excellent research assistance for early data collection. We thank Michael Clemens, David Leblang, Kris Mitchener, Moritz Schularick, Irving Stone, Alan Taylor, Marc Weidenmier and Jeff Williamson for help with or use of their data. Financial assistance from the UK's ESRC helped build some of the data set that underlies this article and supported this research. We acknowledge this with pleasure. Errors remain our responsibility.
Data appendix
Most of the data underlying this article were used in previous work (Bordo and Meissner Reference Bordo, Meissner, Edwards, Esquivel and Márquez2007, Reference Bordo and Meissner2006). The bulk of the macro historical data set is that used in Bordo et al. (Reference Bordo, Eichengreen, Klingebiel and Martinez-Peria2001). Controls in the growth regressions and incomes come from data underlying Clemens and Williamson (Reference Clemens and Williamson2004) and Obstfeld and Taylor (Reference Obstfeld and Taylor2003), to whom we are grateful for sharing their data. Expansive data descriptions and sources for those data are listed in the working paper versions of our work on crises in NBER Working Papers 11173 and 11897.
As in Bordo et al. (Reference Bordo, Eichengreen, Klingebiel and Martinez-Peria2001), we date currency and banking crises using both qualitative and quantitative evidence. For all countries besides Austria, Russia, New Zealand, South Africa, Mexico, Turkey, Egypt, Uruguay and India we have relied on the dates of Bordo et al. We relied on personal correspondence with Luis Bertola for Uruguay. Other published country sources were used to date remaining crises.
We have dated currency crises for these countries, when possible, by using an approach based on the exchange market pressure (EMP) methodology which looks at changes in reserves, the exchange rate and the interest rate using data available from Global Financial Data and data underlying Flandreau and Zúmer (Reference Flandreau and Zúmer2004) published on eh.net (http://eh.net/databases/finance/).
Debt crisis dates are based on Beim and Calomiris (Reference Beim and Calomiris2001). Only private lending to sovereign nations is considered when building those default dates. Not every instance of technical default is included in the chronology; the authors identified periods (six months or more) where all or part of interest/principal payments were suspended, reduced or rescheduled. Some of those episodes are outright debt repudiations, while others were reschedulings agreed upon mutually by lenders and borrowers. Additional data are from a spreadsheet underlying Reinhart, Rogoff and Savastano (Reference Reinhart, Rogoff and Savastano2003).
Sources for hard currency debt are given in Bordo and Meissner (Reference Bordo, Meissner, Edwards, Esquivel and Márquez2007) and we augmented this with data made available by Flandreau and Zúmer (Reference Flandreau and Zúmer2004). What we refer to as hard currency debt is public debt that carried a gold clause or was made payable at a fixed rate in a foreign currency (see Bordo and Meissner Reference Bordo, Meissner, Edwards, Esquivel and Márquez2007).